. 2022 Dec 2;8(48):eabo0876.
doi: 10.1126/sciadv.abo0876. Epub 2022 Dec 2.

MacroH2A impedes metastatic growth by enforcing a discrete dormancy program in disseminated cancer cells

Affiliations

MacroH2A impedes metastatic growth by enforcing a discrete dormancy program in disseminated cancer cells

Dan Sun et al. Sci Adv. .

Abstract

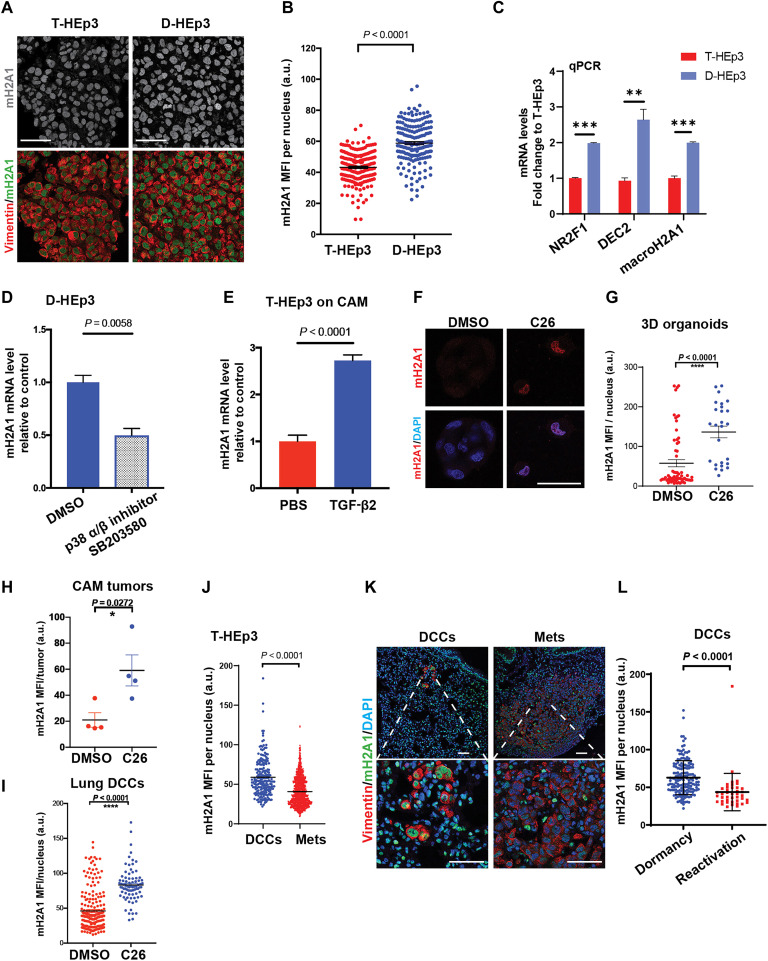
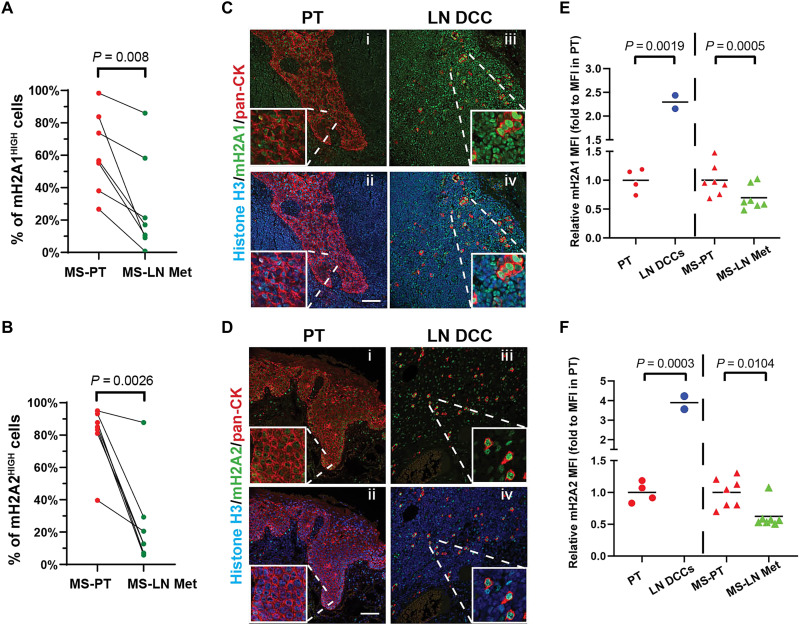
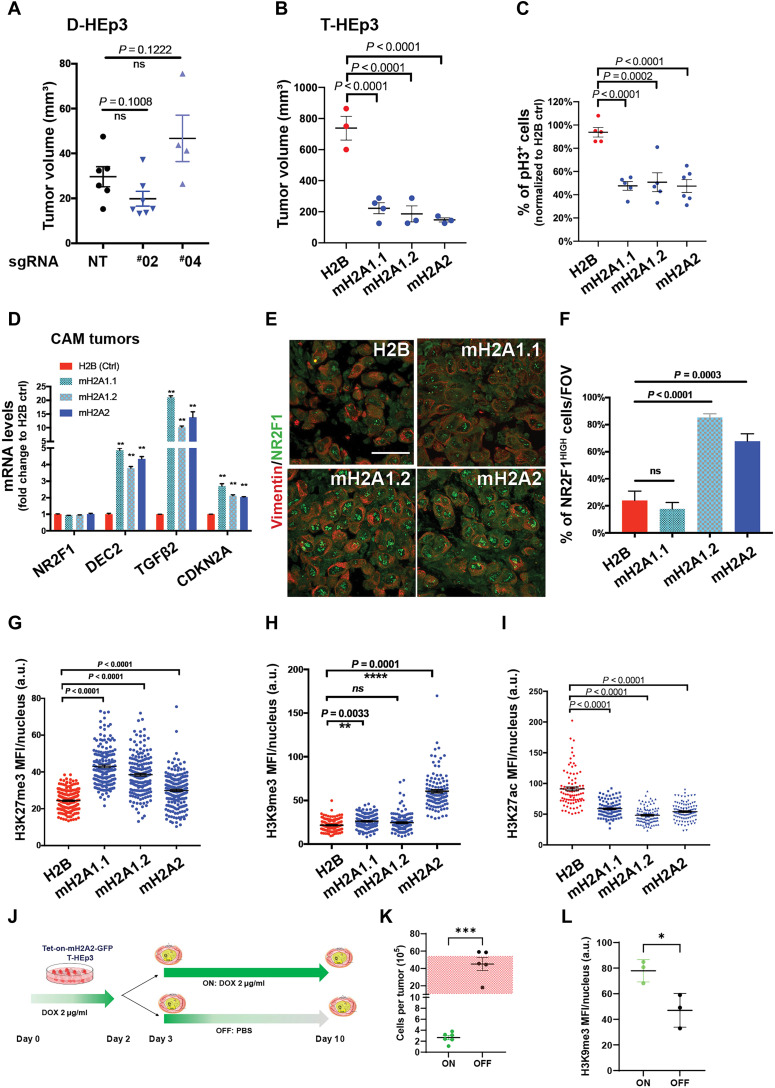
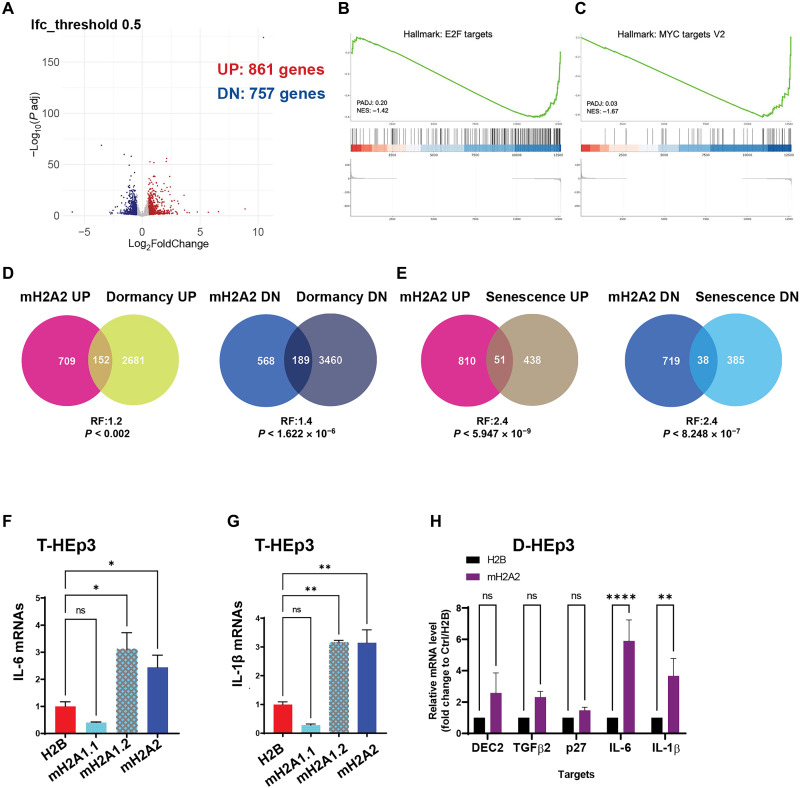
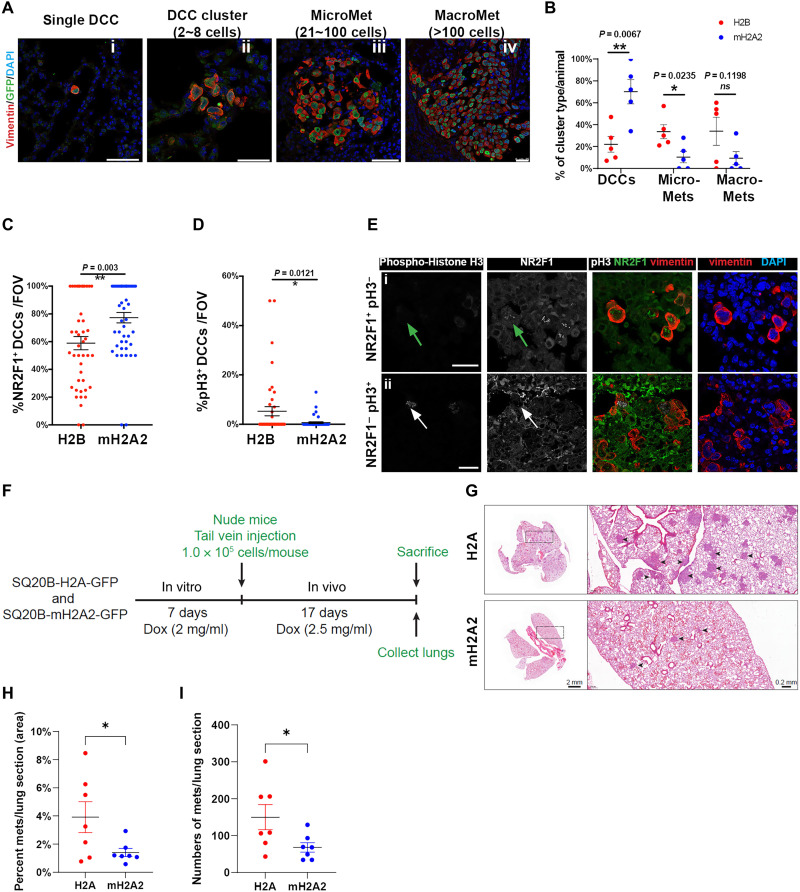
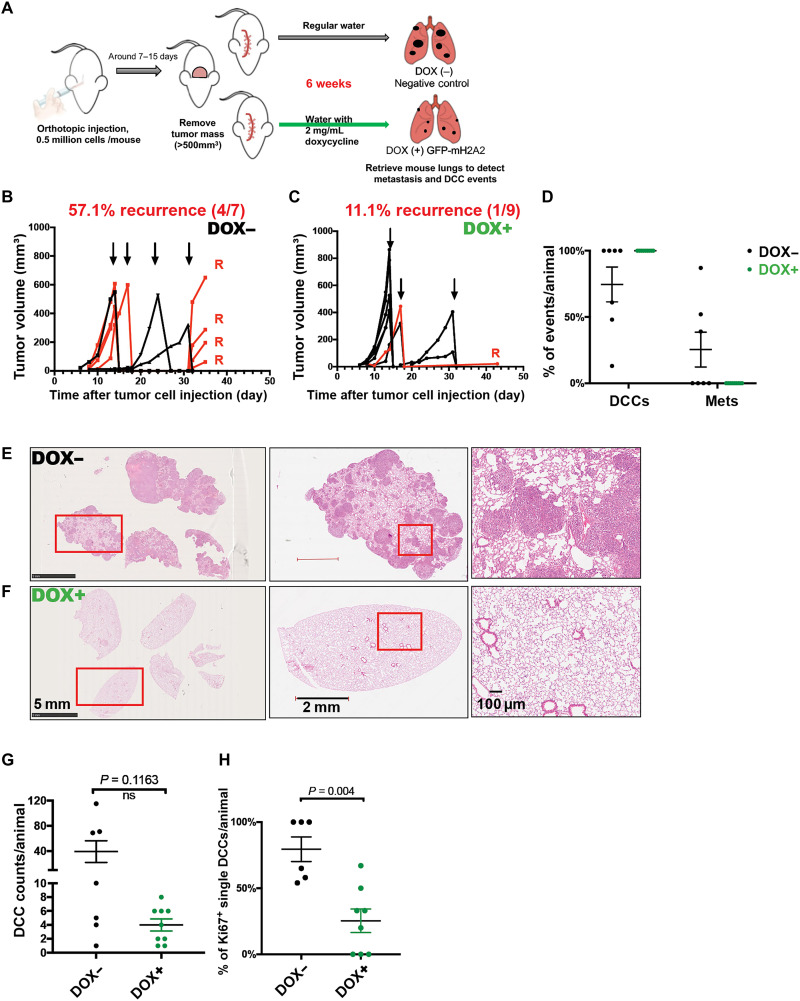
MacroH2A variants have been linked to inhibition of metastasis through incompletely understood mechanisms. Here, we reveal that solitary dormant disseminated cancer cells (DCCs) display increased levels of macroH2A variants in head and neck squamous cell carcinoma PDX in vivo models and patient samples compared to proliferating primary or metastatic lesions. We demonstrate that dormancy-inducing transforming growth factor-β2 and p38α/β pathways up-regulate macroH2A expression and that macroH2A variant overexpression is sufficient to induce DCC dormancy and suppress metastasis in vivo. Notably, inducible expression of the macroH2A2 variant in vivo suppresses metastasis via a reversible growth arrest of DCCs. This state does not require the dormancy-regulating transcription factors DEC2 and NR2F1; instead, transcriptomic analysis reveals that macroH2A2 overexpression inhibits cell cycle and oncogenic signaling programs, while up-regulating dormancy and senescence-associated inflammatory cytokines. We conclude that the macroH2A2-enforced dormant phenotype results from tapping into transcriptional programs of both quiescence and senescence to limit metastatic outgrowth.


Figures

Fig. 1.
Fig. 1.. MacroH2A1 expression in dormant versus proliferative HNSCC cells and DCCs.
(A and B) Representative images and quantification of T-HEp3 or D-HEp3 CAM tumors stained for macroH2A1 (green), vimentin (red), and 4′,6-diamidino-2-phenylindole (DAPI; blue). n > 100 cells per group were assessed, Mann-Whitney test. Scale bars, 50 μm. a.u., arbitrary units. (C) qPCR-measured mRNA levels in both D-HEp3 cells (blue bars) and in T-HEp3 cells (red bars). (D) D-HEp3 cells were treated with dimethyl sulfoxide (DMSO) or SB 203580 (5 μM, 48 hours) in serum-free medium in vitro. See fig. S1D for the drug efficacy. qPCR measured the relative mRNA level of macroH2A1 to DMSO. (E) qPCR-measured macroH2A1 mRNA levels in T-HEp3 CAM tumors treated with or without TGF-β2 (10 ng/ml) for 6 days. n = 4 tumors per group. All qPCR assays were in triplicate, means + SEM, two-tailed Student’s t test. (F and G) Images and quantification of T-HEp3 cells grown in 3D organoids and cells were treated with 0.2 μM C26 (NR2F1 agonist) or DMSO as indicated for 4 days in vitro and stained for macroH2A1 (green) and DAPI (blue). Scale bars, 25 μm. (H and I) Bar graph quantification of macroH2A1 MFI in T-HEp3 cells grown in CAM model (H) or DCCs found in mouse lungs (I). Mean + SEM, two-tailed Student’s t test. (J to L) Experimental metastasis assay. See fig. S1G for the schematic. n = 10 animals were assessed. (J) Quantification of macroH2A1 MFI per nucleus in either DCCs or metastatic lesions. Single cells and small clusters (<20 cells) were considered as DCC events. Mann-Whitney test. (K) IF representative images show the stain for macroH2A1 (green), human vimentin (red), and DAPI (blue). Scale bars, 50 μm. (L) Quantification of macroH2A1 MFI in DCC events found in dormancy phase or reactivation phase. n = 165 cells pooled from five animals at dormancy phase, n = 41 cells pooled from five animals at reactivation phase. Mean + SD. Unpaired Student’s t test. m2HA1, macroH2A1.
Fig. 2.
Fig. 2.. MacroH2A variants are enriched in solitary DCCs versus primary tumor and metastatic lesions in patients with HNSCC.
(A and B) Quantification of the percentage of macroH2A1- or macroH2A2-high cells in either primary tumors or LN metastases. Each paired primary tumor (MS-PT) tissue section (red) and LN metastatic lesion (MS-LN Met, green) were from the same patient. See fig. S2 for the detailed quantification method and representative images. n = 7 patients; each data point represents the mean percentage of macroH2AHIGH cells pooled from five to six fields of view. Paired Student’s t test. (C and D) Representative images of IF staining in primary tumor tissues or clinically negative LN tissues. macroH2A1 (C) or macroH2A2 (D) are in green; pan-cytokeratin is in red, and Histone H3 is in blue. Scale bar, 75 μm. (E and F) Measurement of relative macroH2A1 or macroH2A2 intensity (normalized to histone H3 intensity) in HNSCC primary tumors (red dots) or DCCs (blue dots) found in clinically negative patient LN tissues after the primary tumor removal, as well as paired PT section (red triangles) and MS-LN Met (green triangles).
Fig. 3.
Fig. 3.. MacroH2A overexpression induces a quiescent phenotype in malignant HNSCC cells.
(A) D-HEp3 tumor growth on CAM with nontargeting guide RNA (NT) and two different guide RNAs targeting macroH2A1 (#02 and #04). n = 6 (NT), 7 (#02), and 4 (#04). Unpaired Student’s t test. (B) Tumor growth on CAM of T-HEp3 cells expressing H2B-GFP (Ctrl) or macroH2A variants. T-HEp3 cells were inoculated onto CAM (1.5 × 10⁵ cells per animal) and transplanted into a new chicken embryo CAM for the second week (n = 3 to 4 tumors). (C) Quantification of percentage of histone H3–S10phos–positive cells on CAM tumors, normalized to H2B control tumors. n = 200 to 300 cells per tumor; n = 5 tumors per condition. One-way ANOVA test. (D) mRNA levels in the indicated 1-week CAM tumors measured by qPCR in triplicate; means + SEM. Multiple t tests with false discovery rate used. (E and F) Images and quantification of the indicated T-HEp3 CAM tumor sections stained for NR2F1 (green) and vimentin (red). Scale bar, 50 μm. (n > 100 cells assessed per tumor, n = 3 tumors per condition); One-way ANOVA test. (G to I) Quantification of IF MFI signal from repressive (H3K27me3 and H3K9me3) and active (H3K27ac) histone modification in the indicated T-HEp3 CAM tumors, n ≈ 200 cells assessed from three tumors per condition. (J) Cartoon of the experiment in (K) and (L). MacroH2A2-GFP expression was induced with DOX 48-hour treatment in vitro. T-HEp3 cells (2 × 10⁵) were inoculated on CAMs. Some CAM tumors were treated with DOX, while the others were treated with PBS for 7 days. (K) Quantification of cell number per tumor in tumors with (ON) or without (OFF) DOX as in (J). n = 5 to 6 tumors. Two-tailed unpaired t test. Red grid box indicates the range of tumor cell numbers detected per T-HEp3 tumor after 7-day incubation (3, 8). (L) Quantification of H3K9me3 MFI via IF in the indicated CAM tumors, n ≈ 200 cells assessed from three tumors per condition.
Fig. 4.
Fig. 4.. MacroH2A2-induced dormancy displays features of spontaneous dormancy and senescence.
(A) Volcano plot displays the DEGs detected by RNA-seq from T-HEp3 cells with mH2A2 versus H2B overexpression. Log2 fold change cutoff is 0.5; 861 up-regulated genes, 757 down-regulated genes. (B and C) Top negatively correlated Hallmark gene sets using RNA-seq data via GSEA. (D) Venn diagrams show the comparison of up-regulated and down-regulated genes in D-HEp3 with up- and down-regulated genes in macroH2A2 overexpressing cells. (E) Venn diagrams show the comparison of up- and down-regulated genes in oncogene-induced senescent fibroblasts (IMR90) with up- and down-regulated genes in macroH2A2 overexpressing T-HEp3 cells. (F and G) qPCR analysis of IL-6 and IL-1β transcript levels in T-HEp3 cells overexpressing individual macroH2A variants. PCR in triplicate, mean + SEM. P value is analyzed via one-way ANOVA. (H) qPCR analysis of dormancy and senescence gene mRNA levels in the indicated D-HEp3 cells with mH2A2 overexpression or H2B as control. PCR in triplicate, mean + SEM.
Fig. 5.
Fig. 5.. MacroH2A2 overexpression promotes the accumulation of quiescent DCCs to prevent metastatic growth.
(A) Experimental metastasis assay. T-HEp3 cells with mH2A2-GFP or H2B-GFP expression were tail vein–injected in nude mice. Three weeks later, the lungs were retrieved and processed for FFPE sections. n = 5 animals per condition. Representative IF images of single DCC, DCC cluster (<8 cells), micro-Met, and macro-Met were costained with GFP, human vimentin (red), and DAPI (blue). Scale bar, 50 μm. (B) Quantification of DCC, micro-Met, and large-Met event frequency in the freshly resected lungs in each animal. Single cells and small clusters (<8 cells) are all included as DCC events. Red dots annotate control animals with H2B expression; blue dots annotate experimental animals with mH2A2 overexpression. Mean ± SEM. Two-tailed unpaired t test. (C and D) Quantification of IF staining for NR2F1, H3S10phos phorylation (pH3+), and human vimentin in DCCs found in the lungs per condition. n = 80 fields of view pooled from five animals per condition. (E) Representative IF images of NR2F1 (green), human vimentin (red), and H3S10phos (gray) in lung DCCs. Green arrow, NR2F1-positive cell; white arrow, pH3-positive cell. Scale bar, 25 μm. (F) Schematic depicting the in vivo experimental metastasis assay timeline. (G) Representative images of each group showing metastatic lesions (arrowheads) in lungs stained with H&E. (H and I) Quantification of the percentage of metastatic area (H) and number of metastatic lesions per animal (I). Mann-Whitney test was used for statistical test. n = 7 per group.
Fig. 6.
Fig. 6.. Induction of macroH2A2 after tumor cell dissemination restricts proliferative metastasis.
(A) Scheme of spontaneous metastasis assay. Tet-ON–inducible macroH2A2-GFP T-HEp3 cells were subcutaneously injected in nude mice. Tumors were surgically removed when the size reached ~500 mm3; then, the mice were provided with oral treatment [DOX water (2 mg ml−1), replenished every 48 hours] to induce the expression of macroH2A2-GFP or regular water without DOX. Six weeks later, the lungs were retrieved and processed for FFPE sections. (B and C) Measurement of the primary tumor volumes after the orthotopic injection. Arrows indicate the primary tumor removal times. Red lines annotate animals with local tumor recurrence after the surgery. (D) Frequency measurement of lung DCC and metastasis events in each animal. Single cells and doublets are both considered as DCC events. Black dots represent animals without DOX treatment (DOX; n = 7), while green dots represent animals with oral DOX (DOX+; n = 9). (E and F) Representative H&E images of animal lungs with metastasis growth in DOX group and those with no evidence of metastasis in DOX+ group. Red rectangular areas are zoomed in. Scale bars, 5 mm, 2 mm, and 100 μm. (G) Counts of DCC events in each animal, 12 tissue sections pooled from each animal. (H) Quantification of IF staining for Ki67-positive solitary DCCs found in the lungs. Mann-Whitney test.

References

    1. Risson E., Nobre A. R., Maguer-Satta V., Aguirre-Ghiso J. A., The current paradigm and challenges ahead for the dormancy of disseminated tumor cells. Nat. Cancer 1, 672–680 (2020). - PMC - PubMed
    1. Phan T. G., Croucher P. I., The dormant cancer cell life cycle. Nat. Rev. Cancer 20, 398–411 (2020). - PubMed
    1. Aguirre Ghiso J. A., Kovalski K., Ossowski L., Tumor dormancy induced by downregulation of urokinase receptor in human carcinoma involves integrin and MAPK signaling. J. Cell Biol. 147, 89–104 (1999). - PMC - PubMed
    1. Crist S. B., Ghajar C. M., When a house is not a home: A survey of antimetastatic niches and potential mechanisms of disseminated tumor cell suppression. Annu. Rev. Pathol. 16, 409–432 (2021). - PubMed
    1. M. S. Sosa, E. Bernstein, J. A. Aguirre-Ghiso, Epigenetic regulation of cancer dormancy as a plasticity mechanism for metastasis initiation, in Tumor Dormancy and Recurrence. Y. Wang, F. Crea, Eds. (Springer International Publishing, 2017), pp. 1–16.