. 2022 Dec 2;8(48):eabq0898.
doi: 10.1126/sciadv.abq0898. Epub 2022 Dec 2.

Angiogenic adipokine C1q-TNF-related protein 9 ameliorates myocardial infarction via histone deacetylase 7-mediated MEF2 activation

Affiliations

Angiogenic adipokine C1q-TNF-related protein 9 ameliorates myocardial infarction via histone deacetylase 7-mediated MEF2 activation

Seung Min Lee et al. Sci Adv. .

Abstract

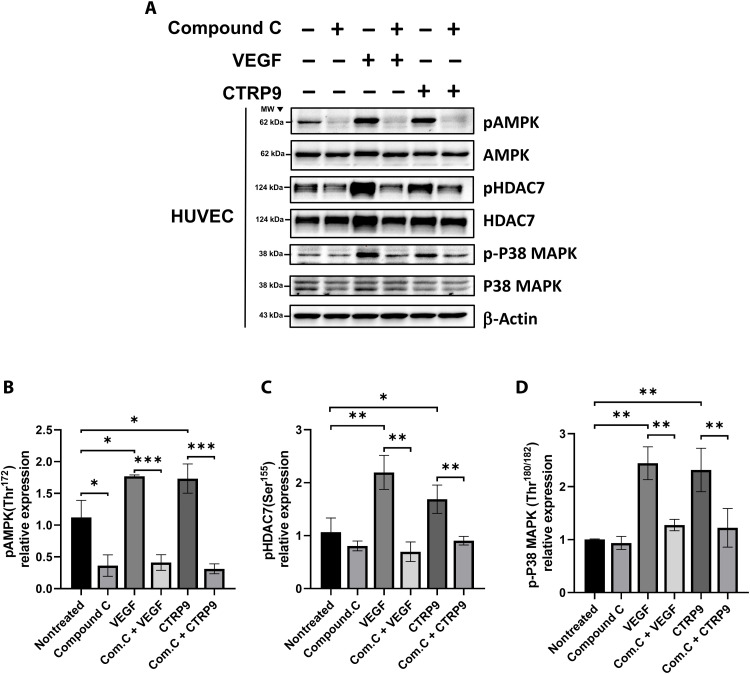
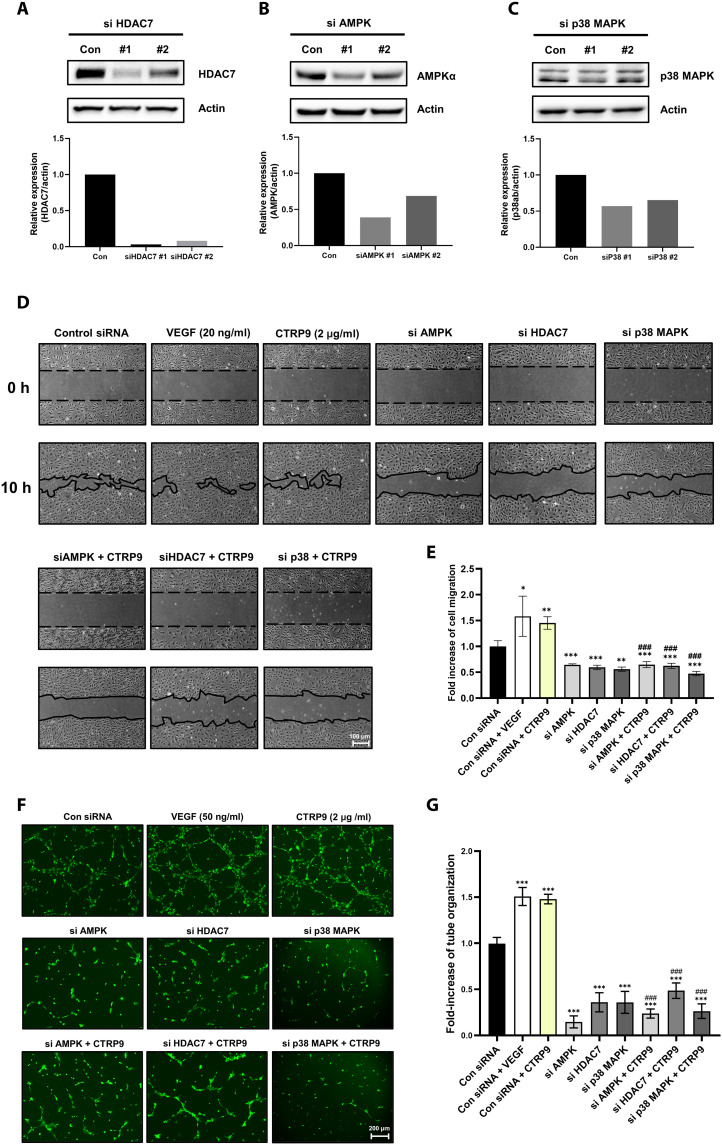
C1q/tumor necrosis factor-related protein 9 (CTRP9) is an adipokine and has high potential as a therapeutic target. However, the role of CTRP9 in cardiovascular disease pathogenesis remains unclear. We found CTRP9 to induce HDAC7 and p38 MAPK phosphorylation via tight regulation of AMPK in vascular endothelial cells, leading to angiogenesis through increased MEF2 activity. The expression of CTRP9 and atheroprotective MEF2 was decreased in plaque tissue of atherosclerotic patients and the ventricle of post-infarction mice. CTRP9 treatment inhibited the formation of atherosclerotic plaques in ApoE KO and CTRP9 KO mice. In addition, CTRP9 induced significant ischemic injury prevention in the post-MI mice. Clinically, serum CTRP9 levels were reduced in patients with MI compared with healthy controls. In summary, CTRP9 induces a vasoprotective response via the AMPK/HDAC7/p38 MAPK pathway in vascular endothelial cells, whereas its absence can contribute to atherosclerosis and MI. Hence, CTRP9 may represent a valuable therapeutic target and biomarker in cardiovascular diseases.


Figures

Fig. 1.
Fig. 1.. CTRP9 promotes HDAC7 phosphorylation by activating the upstream kinase AMPK.
HUVECs were incubated with increasing concentrations of VEGF and CTRP9, for increasing time periods, as indicated in the figures. (A and B) AMPK and (C and D) HDAC7 phosphorylation levels were evaluated by immunoblotting and quantified by densitometric analysis in relation to total AMPK and HDAC7 levels, respectively. Data are shown as means ± SEM of three independent experiments. *P < 0.05, **P < 0.01, and ***P < 0.001 versus control by Student’s t test.
Fig. 2.
Fig. 2.. HDAC7 phosphorylated by CTRP9 results in MEF2 activation via nuclear export.
(A) HUVECs were treated with CTRP9 (2 μg/ml), and time-dependent localization of endogenous HDAC7 was verified by immunofluorescence (N = 4). Blue: 4′,6-diamidino-2-phenylindole (DAPI) nuclear stain; red: endogenous HDAC7. Scale bar, 50 μm. (B) HUVECs were treated with CTRP9 (2 μg/ml); incubated for 2, 4, and 6 hours; and were then immunoprecipitated with anti-HDAC7 antibodies. Precipitated proteins were subjected to coimmunoprecipitation (co-IP) using an anti-MEF2C antibody and analyzed by immunoblotting. (C to E) BAECs were transfected with 3× MEF2C-Luc vector, and, 16 hours later, VEGF (20 ng/ml), CTRP9 (2 μg/ml), compound C (5 μM), and TMP269 (10 μM) were added to the culture medium. After incubation for 16 hours, firefly/renilla luciferase activity was measured and quantified. Data are shown as means ± SEM of three independent experiments. *P < 0.05 and **P < 0.01 versus control by Student’s t test.
Fig. 3.
Fig. 3.. Activation of AMPK by CTRP9 induces phosphorylation of p38 MAPK and regulates VEGF mRNA/secretion and MEF2 activity.
(A and B) HUVECs were exposed to increased doses of VEGF or CTRP9 and for different time periods, as indicated in the figures. p38 MAPK phosphorylation was evaluated by immunoblotting and quantified by densitometric analysis in relation to total p38 MAPK levels. (C) HUVECs were treated with CTRP9 (2 μg/ml) and cultured for 24 hours, and cellular VEGFA relative expression (normalized to GAPDH levels) was measured by qRT-PCR. (D) HUVECs were treated with CTRP9 (0.5 to 2 μg/ml), and secreted VEGF in the cultured medium was analyzed by ELISA. (E) BAECs were transfected with 3× MEF2C-Luc vector, and, 16 hours later, VEGF (20 ng/ml), CTRP9 (2 μg/ml), and SB203580 (10 μM) were added to the culture medium. After incubation for 16 hours, each firefly/renila luciferase activity was measured and quantified. Data are shown as means ± SEM of three independent experiments. *P < 0.05 and **P < 0.01 versus control by Student’s t test.
Fig. 4.
Fig. 4.. Phosphorylation of HDAC7 and p38 MAPK is regulated by the upstream AMPK.
(A) HUVECs were incubated with AMPK inhibitor (compound C, 5 μM), VEGF (20 ng/ml), and CTRP9 (2 μg/ml) for 30 min, and phosphorylation levels of of AMPK, HDAC7, and p38 MAPK were analyzed by immunoblotting. (B to D) Phosphorylation of each protein was normalized to the total levels of the respective protein. Data are shown as means ± SEM of three independent experiments. *P < 0.05, **P < 0.01, and ***P < 0.001 versus nontreated cells by Student’s t test.
Fig. 5.
Fig. 5.. CTRP9 increases angiogenesis in vascular endothelial cells.
(A and B) HUVECs were seeded in six-well plates, and after 24 hours, a physical gap was induced in the cell layer using a scratcher. VEGF (20 ng/ml) and CTRP9 (2 μg/ml) were added to the culture medium and incubated for 10 hours. Four physical gap areas were assessed per well. HUVEC migration was measured and quantified using ImageJ software. Scale bar, 100 μm. N = 3 each, data are shown as means ± SEM. *P < 0.05 and **P < 0.01 versus control by Student’s t test. (C and D) Growth factor–reduced Matrigel (100 μl) was placed on the bottom of the 24-well plates, HUVECs were seeded onto each well, and VEGF (50 ng/ml) and CTRP9 (2 μg/ml) was added to the culture medium. After 16 hours, the cells were stained with calcein-AM dye (1 μg/ml). Five locations of each well were randomly photographed, and the tube organization was measured and compared with that of the control condition. Cell culture dishes were performed in at least three separate experiments. Scale bar, 200 μm. Data are shown as means ± SEM. *P < 0.05, **P < 0.01, and ***P < 0.001 versus control by Student’s t test.
Fig. 6.
Fig. 6.. CTRP9-activated AMPK/HDAC7/p38 MAPK pathway regulates angiogenesis.
(A) siRNA #1 and #2 of AMPK, HDAC7, and p38 MAPK were transfected into HUVECs seeded in six-well plates at 30 pmol per well. After 24 hours of incubation, each protein was assessed by immunoblotting. (D and E) siRNA (30 pmol per well) of AMPK, HDAC7, and p38 MAPK was transfected into HUVECs and cultured for 24 hours. A physical gap was induced in the cell layer, and VEGF (20 ng/ml) and CTRP9 (2 μg/ml) were added to the culture medium. After 10 hours of incubation, the area with migrated cells was measured using ImageJ software. Scale bar, 100 μm. N = 3 each, data are shown as means ± SEM. *P < 0.05, **P < 0.01, and ***P < 0.001 versus con siRNA by Student’s t test, and #P < 0.05, ##P < 0.01, and ###P < 0.001 versus con siRNA + CTRP9 by Student’s t test. (F and G) Growth factor reduced-Matrigel (100 μl) was places on the bottom of 24-well plates. Transfected cells were seeded in each well and treated with VEGF (50 ng/ml) and CTRP9 (2 μg/ml). After 16 hours, the cells were stained with calcein-AM dye (1 μg/ml). Five locations of each well were randomly photographed, and the tube organization was measured and compared with that of the control condition. Scale bar, 200 μm. N = 3 each, data are shown as means ± SEM. *P < 0.05, **P < 0.01, and ***P < 0.001 versus con siRNA by Student’s t test; #P < 0.05, ##P < 0.01, and ###P < 0.001 versus con siRNA + CTRP9 by Student’s t test.
Fig. 7.
Fig. 7.. Reduced angiogenesis in CTRP9 deficiency mice was demonstrated through implanted matrigel plugs.
(A) Growth factor–reduced Matrigel (250 μl) with VEGF (50 ng/ml), bFGF (20 ng/ml), and heparin (30 U/ml) was subcutaneously injected into the flank of CTRP9 WT and KO mice. After 10 days, each mouse was euthanized, and the transplanted Matrigel plug was isolated. Scale bar, 5 mm. (B) Hemoglobin content (mg/g) was normalized by the weight of each plug. N = 5 each, data are shown as means ± SEM. *P < 0.05 versus WT by Student’s t test. (C and D) The isolated Matrigel plug was embedded in a paraffin block, and slices were cut and stained. Hematoxylin and eosin staining, and CD31 immunohistochemical analysis were performed. (E) CD31-stained CTRP9 WT and KO Matrigel plugs were randomly photographed at five locations, and CD31+ vessels were counted and compared. Scale bar, 100 μm. N = 5 each, data are shown as means ± SEM. *P < 0.05 versus WT by Student’s t test. (F) Before plug isolation, 200 μ of FITC-dextran (15 mg/ml) was injected into the tail vein of each mouse. (G) Five random pictures were collected, and the fluorescence intensity was analyzed using ImageJ. Scale bar, 200 μm. N = 5 each, data are shown as means ± SEM. *P < 0.05 and **P < 0.01 versus WT by Student’s t test.
Fig. 8.
Fig. 8.. CTRP9 deficiency causes an atheroprone response, and CTRP9 treatment inhibits atherosclerotic plaque formation.
(A) Log2-normalized MEF2C expression was analyzed in CTRP9 WT/KO aortic mRNA sequencing data. (B) MEF2C expression in intact tissue and atheroma plaques of 32 patients with atherosclerosis obtained from the publicly available GSE43292 dataset. Data are shown as means ± SEM. *P < 0.05 and **P < 0.01 versus WT and intact tissue by Student’s t test. (C) CTRP9 WT/KO aortic mRNA sequencing data were used, and the expression of 13 genes in mouse atherosclerosis PCR array gene set (Qiagen, PAMM-038ZA) was clustered as a heatmap and represented. (d) Gene Set Enrichment Analysis (GSEA) was performed using RNA-seq data. Statistically significant Hallmark_inflammatory response, Hallmark_hypoxia, and Reactome_smooth muscle contraction were shown by GSEA plots. (E and F) LCA partial ligation modeling was performed on CTRP9 WT and KO mice, and ligated LCA and sham RCA of each mouse were isolated (N = 5 per group). LCA and RCA were embedded in paraffin blocks, sectioned, and stained with hematoxylin and eosin E, as well as for endothelium marker CD31, smooth muscle cell marker α-SMA, and immune cell marker CD45. Scale bar, 50 μm. (G) The entire aortic arch including the carotid artery was isolated 3 weeks after induction of atherosclerosis due to LCA ligation surgery (white arrow: ligated LCA). (H) Aortas of each group were fixed with 4% paraformaldehyde (PFA), and plaques were stained with oil red O staining solution and photographed under a microscope. Scale bar, 1 mm (N = 5 per group). (I and J) The plaques in each ligated LCA and aorta were measured and quantified with ImageJ software. Data are shown as means ± SEM. *P < 0.05 and **P < 0.01 versus WT and ApoE KO and CTRP9 KO by Student’s t test.
Fig. 9.
Fig. 9.. Role and potential of CTRP9 in MI.
(A) Expression of CTRP9 and MEF2C in the left ventricle tissue of surgically induced MI mice obtained from the publicly available GSE6580 dataset. Gene expression at 3, 5, 7, and 14 days after infarction induction (N = 5 per group). (B) MEF2C expression in CD146+ circulating endothelial cells in 28 healthy controls and 28 patients with MI obtained from the publicly available GSE66360 dataset. (C and D) An MI induction model experiment was performed through mouse LAD ligation. After LAD ligation, CTRP9 (1 μg/g) was injected through the left jugular vein, and the heart was enucleated 24 hours later. Sham, MI, and MI + CTRP9 hearts were sliced 1 to 2 mm and stained with triphenyltetrazolium chloride (TTC). Scale bar, 1 mm. Graphic representation of the LV infarct size shown as a percentage of infarct area over total LV area individually in each group (each, n = 5 hearts/sham, MI, and MI + CTRP9 groups). Data are shown as means ± SEM. *P < 0.05 versus MI by Student’s t test. (E) Circulating CTRP9 levels in sham and MI groups were measured by mouse CTRP9 ELISA. Data are shown as means ± SEM. *P < 0.05 versus sham by Student’s t test. (F) Circulating CTRP9 in 30 healthy control and 30 potential CAD groups was measured by human CTRP9 ELISA. (G) Blood CTRP9 levels of 26 healthy controls and 32 patients with MI stage 1 and 21 patients with MI stage 2 were analyzed by ELISA. Data are shown as means ± SEM. *P < 0.05 and **P < 0.01 versus healthy controls by Student’s t test. (H and I) Area under curve (AUC) of the receiver operating characteristic obtained from blood CTRP9 levels of healthy controls and MI patients. (J) Schematic figure of CTRP9 role in cardiovascular disease.

Similar articles

Cited by

References

    1. GBD 2015 Risk Factors Collaborators , Global, regional, and national comparative risk assessment of 79 behavioural, environmental and occupational, and metabolic risks or clusters of risks, 1990-2015: A systematic analysis for the Global Burden of Disease Study 2015. Lancet 388, 1659–1724 (2016). - PMC - PubMed
    1. Ghaben A. L., Scherer P. E., Adipogenesis and metabolic health. Nat. Rev. Mol. Cell Biol. 20, 242–258 (2019). - PubMed
    1. Fuster J. J., Ouchi N., Gokce N., Walsh K., Obesity-induced changes in adipose tissue microenvironment and their impact on cardiovascular disease. Circ. Res. 118, 1786–1807 (2016). - PMC - PubMed
    1. Ohashi K., Shibata R., Murohara T., Ouchi N., Role of anti-inflammatory adipokines in obesity-related diseases. Trends Endocrinol. Metab. 25, 348–355 (2014). - PubMed
    1. Ouchi N., Parker J. L., Lugus J. J., Walsh K., Adipokines in inflammation and metabolic disease. Nat. Rev. Immunol. 11, 85–97 (2011). - PMC - PubMed