. 2023 Feb 3;83(3):441-455.
doi: 10.1158/0008-5472.CAN-22-3050.

Spatially Resolved Single-Cell Assessment of Pancreatic Cancer Expression Subtypes Reveals Co-expressor Phenotypes and Extensive Intratumoral Heterogeneity

Affiliations

Spatially Resolved Single-Cell Assessment of Pancreatic Cancer Expression Subtypes Reveals Co-expressor Phenotypes and Extensive Intratumoral Heterogeneity

Hannah L Williams et al. Cancer Res. .

Abstract

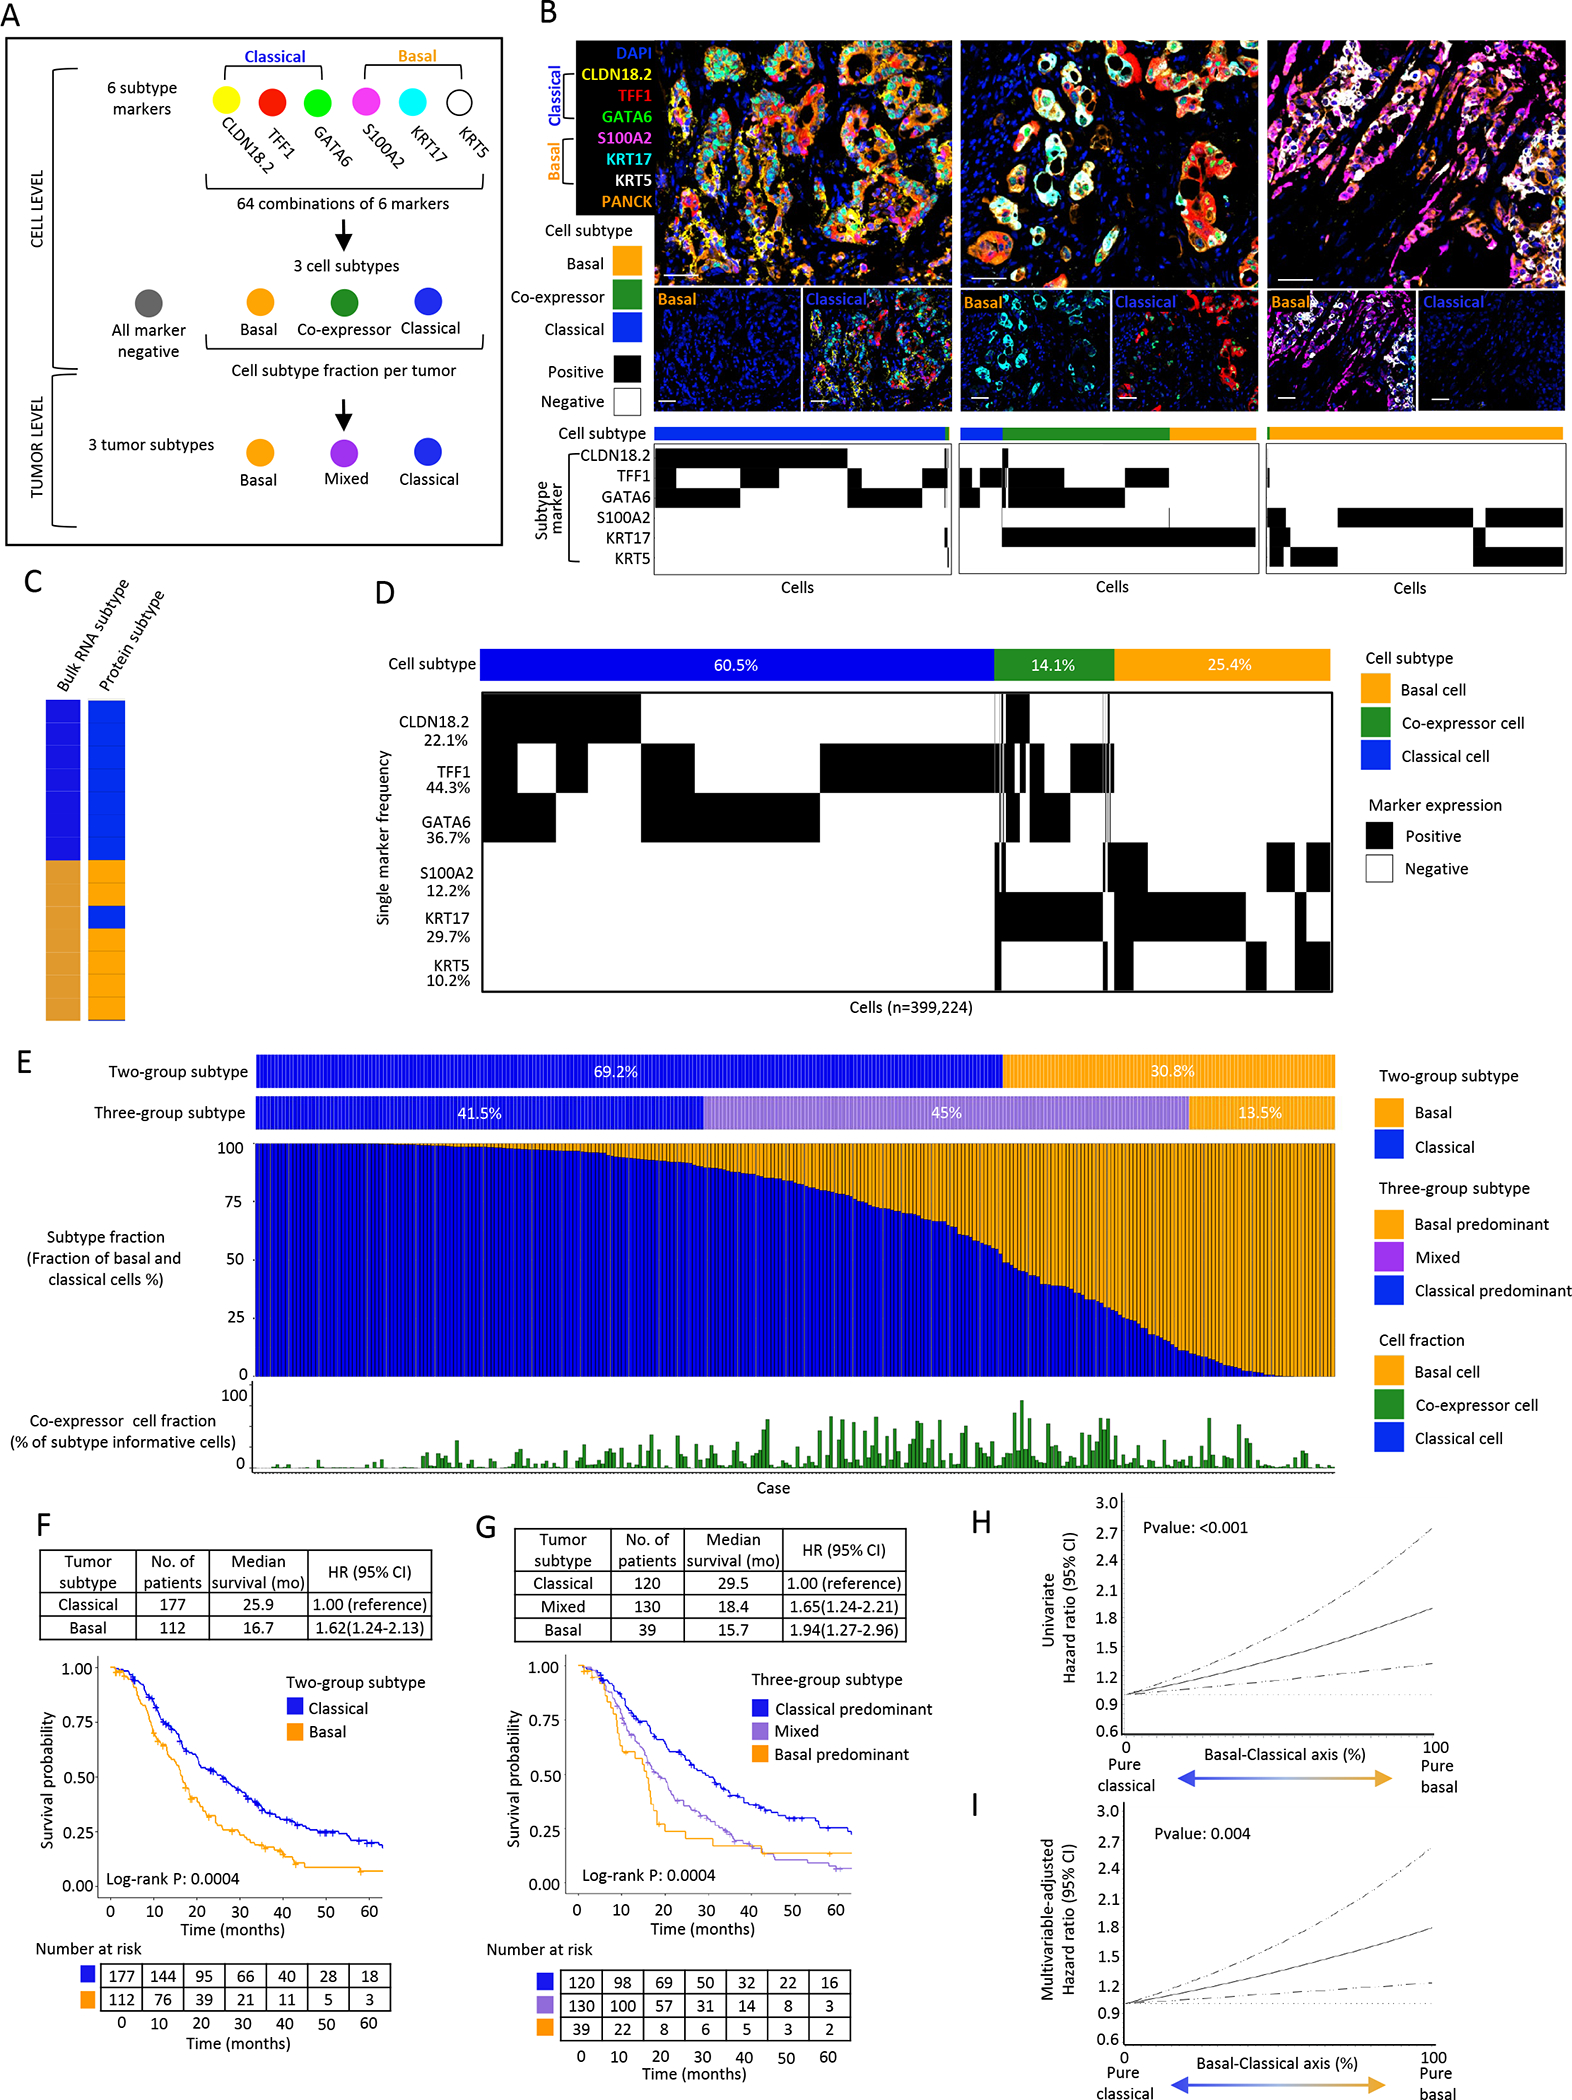
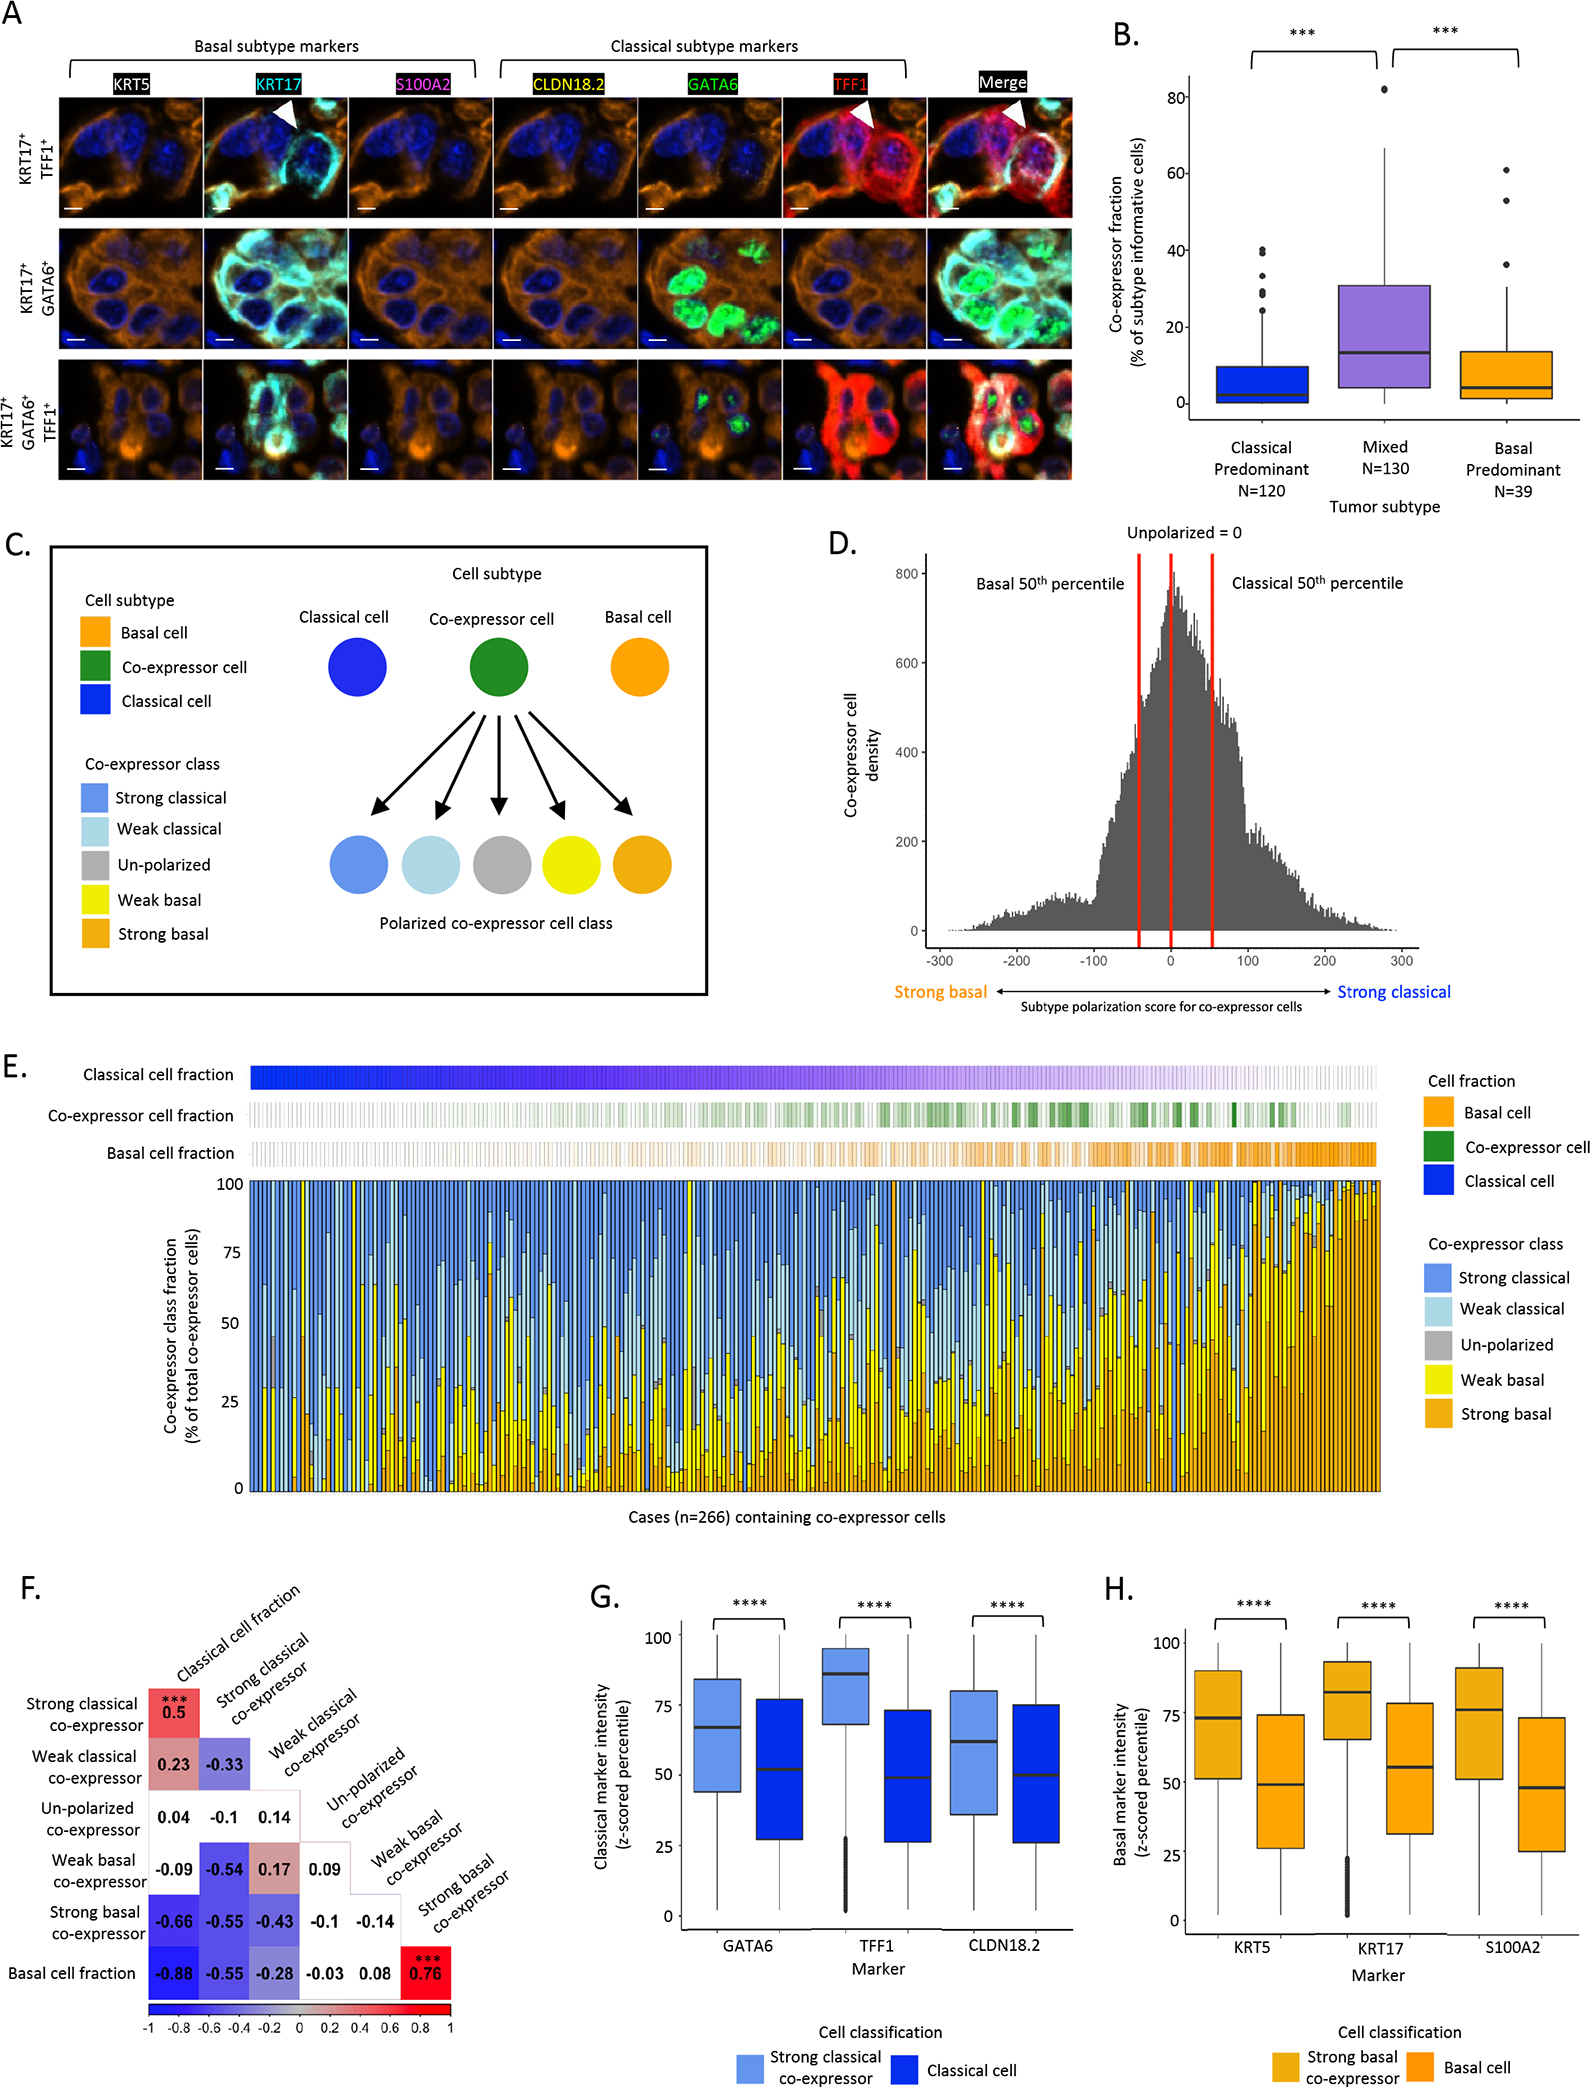
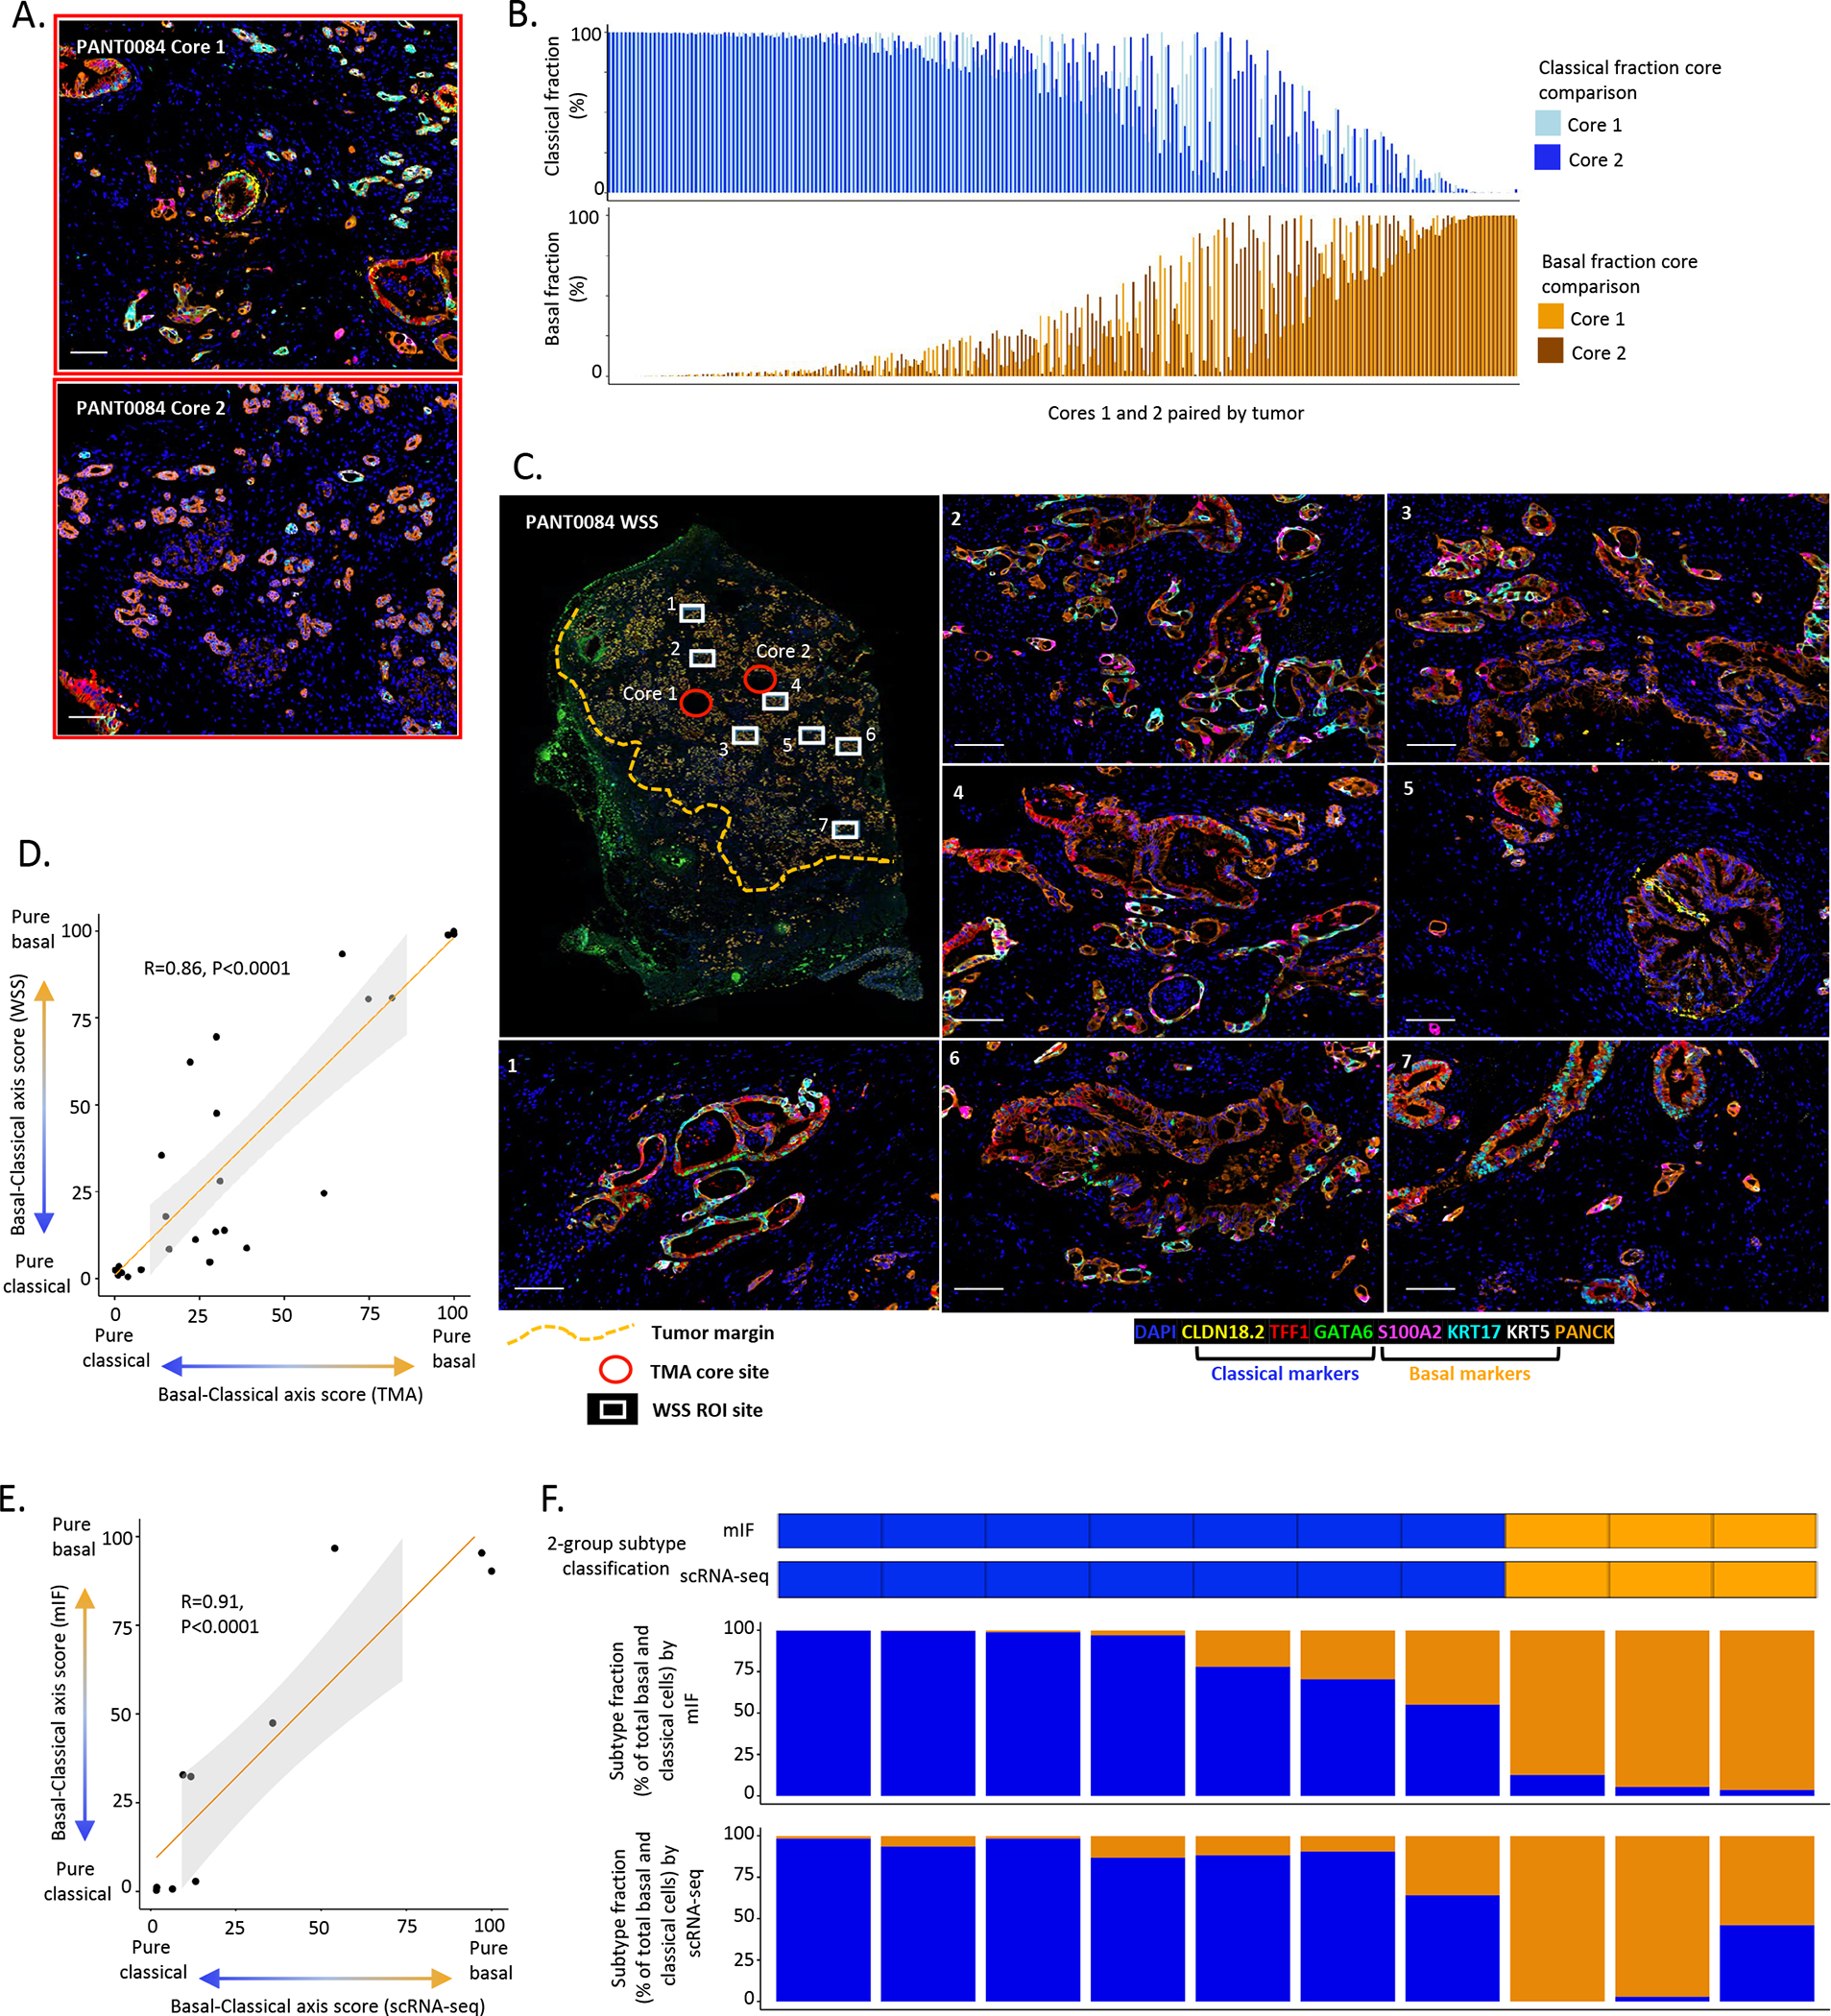
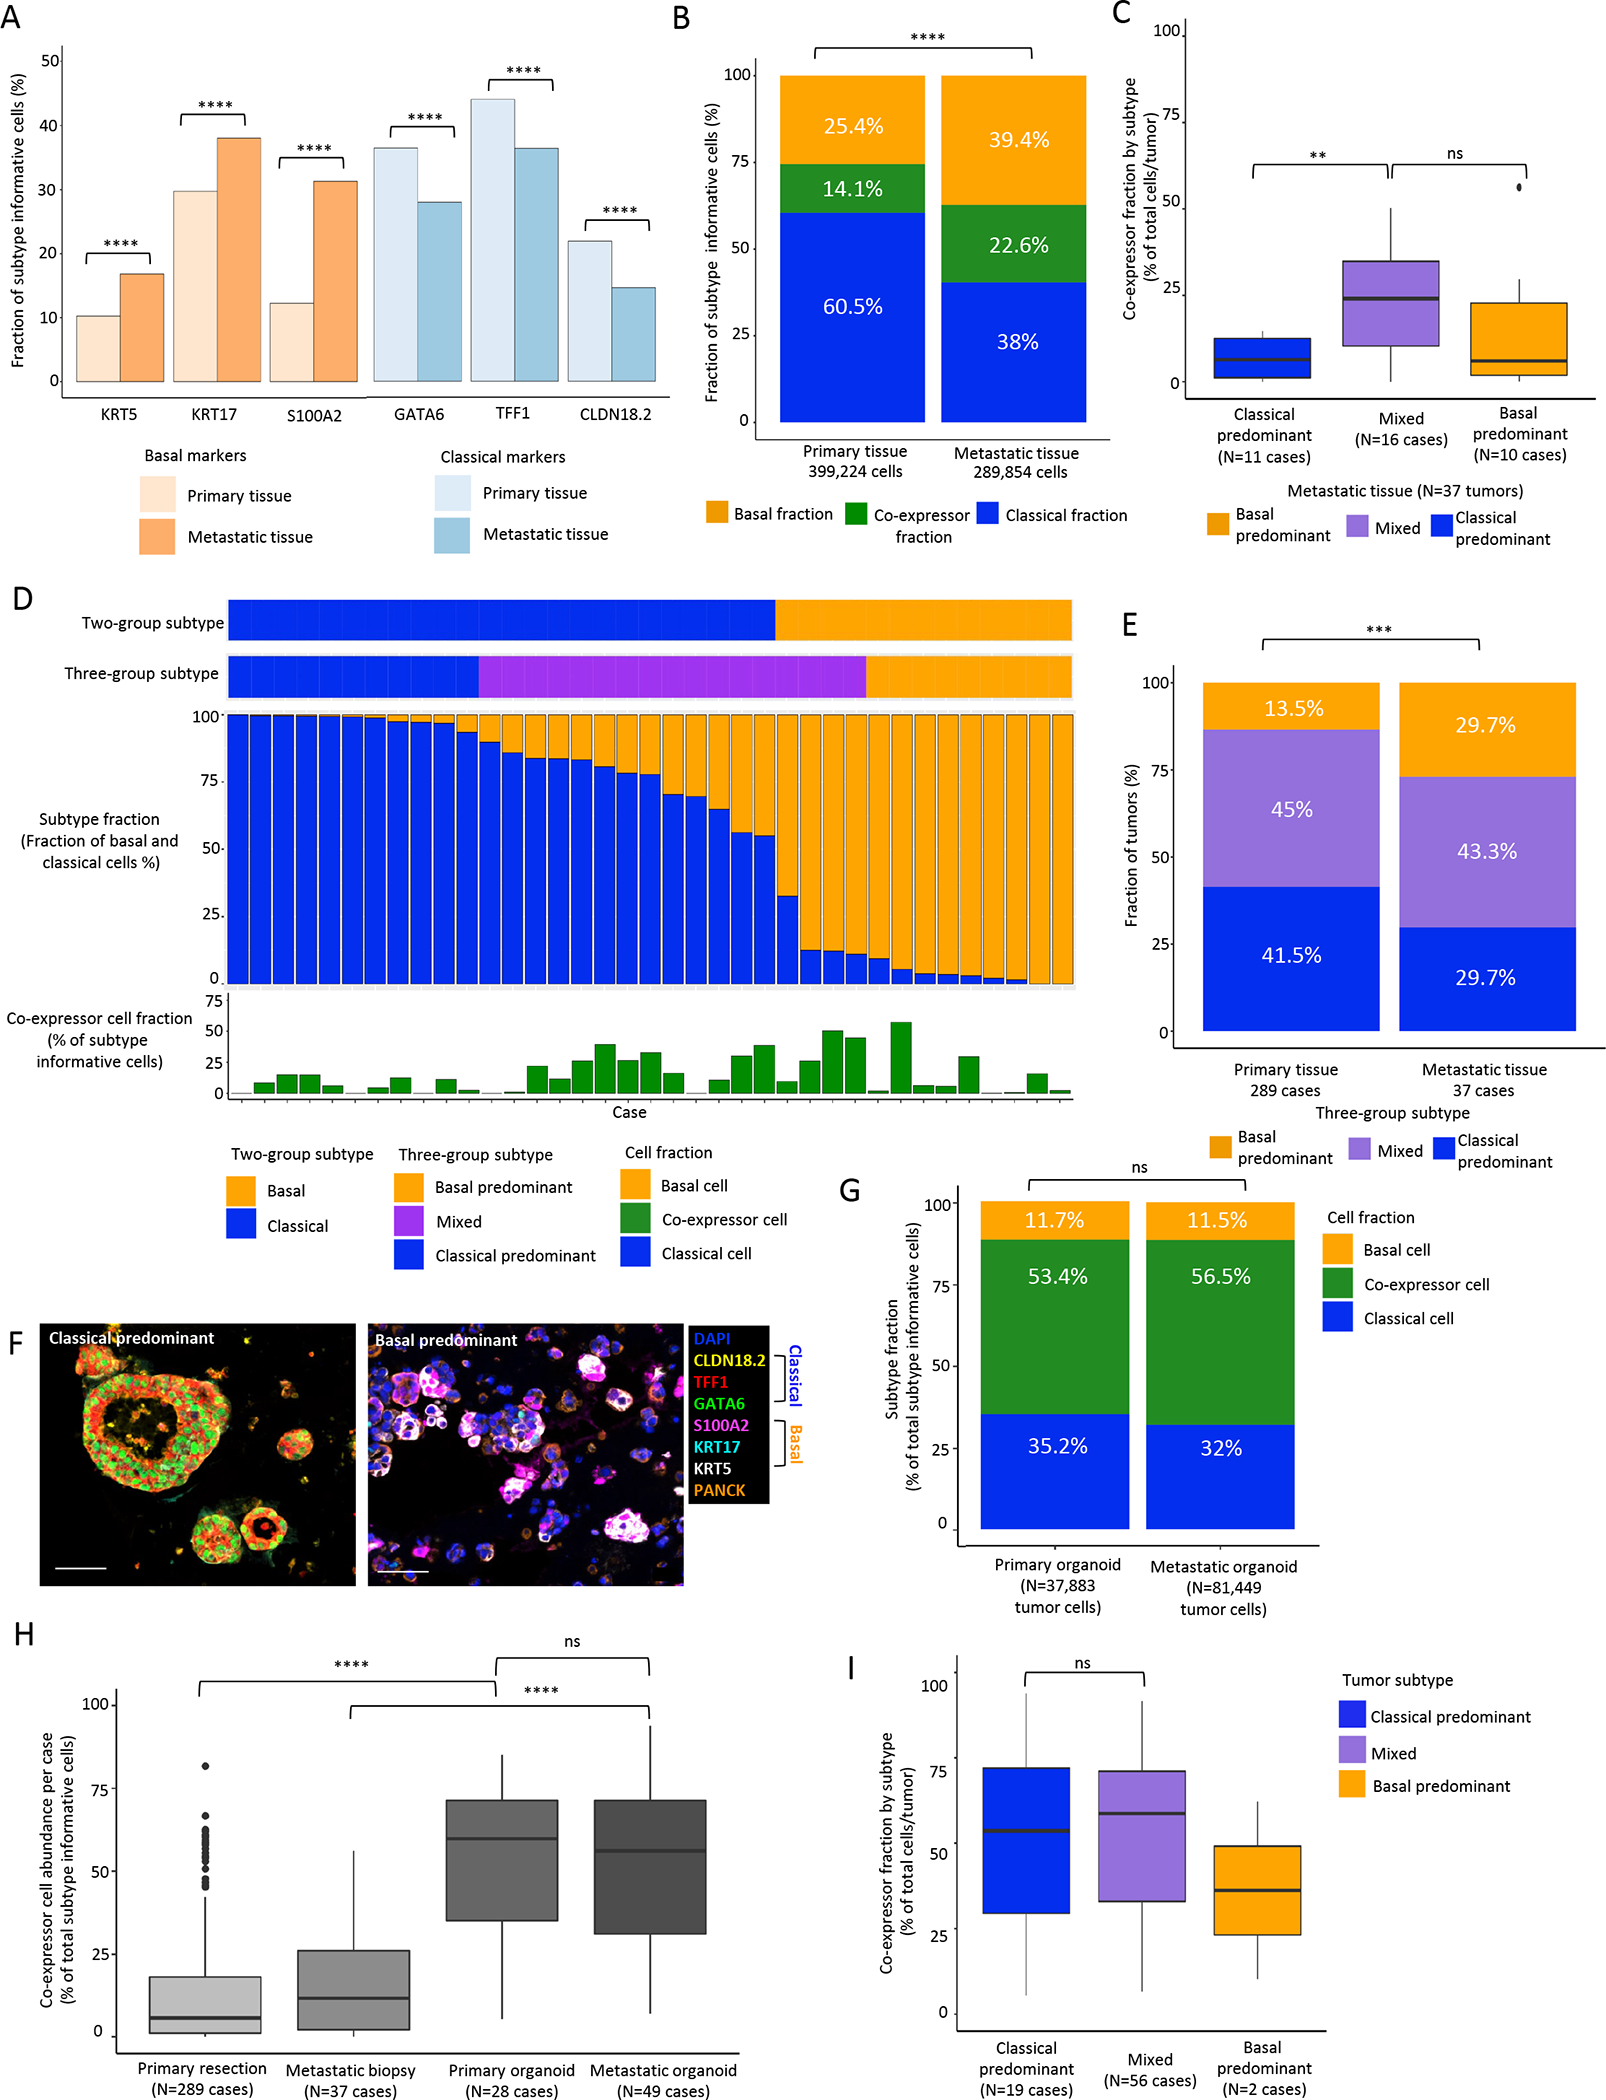
Pancreatic ductal adenocarcinoma (PDAC) has been classified into classical and basal-like transcriptional subtypes by bulk RNA measurements. However, recent work has uncovered greater complexity to transcriptional subtypes than was initially appreciated using bulk RNA expression profiling. To provide a deeper understanding of PDAC subtypes, we developed a multiplex immunofluorescence (mIF) pipeline that quantifies protein expression of six PDAC subtype markers (CLDN18.2, TFF1, GATA6, KRT17, KRT5, and S100A2) and permits spatially resolved, single-cell interrogation of pancreatic tumors from resection specimens and core needle biopsies. Both primary and metastatic tumors displayed striking intratumoral subtype heterogeneity that was associated with patient outcomes, existed at the scale of individual glands, and was significantly reduced in patient-derived organoid cultures. Tumor cells co-expressing classical and basal markers were present in > 90% of tumors, existed on a basal-classical polarization continuum, and were enriched in tumors containing a greater admixture of basal and classical cell populations. Cell-cell neighbor analyses within tumor glands further suggested that co-expressor cells may represent an intermediate state between expression subtype poles. The extensive intratumoral heterogeneity identified through this clinically applicable mIF pipeline may inform prognosis and treatment selection for patients with PDAC.

Significance: A high-throughput pipeline using multiplex immunofluorescence in pancreatic cancer reveals striking expression subtype intratumoral heterogeneity with implications for therapy selection and identifies co-expressor cells that may serve as intermediates during subtype switching.


Conflict of interest statement

Conflict of interest:

B.M.W. declares research funding from Celgene, Eli Lilly & Company, Novartis, and Revolution Medicine, and consulting for Celgene, GRAIL, and Mirati. J.A.N. declares research funding from NanoString, Illumina, and Akoya Biosciences. K.P. declares One-time Pancreatic Advisory Board fee for Celgene (5/2019). One-time HCC Advisory Board fee for Eisai (11/2019). One-time Cholangiocarcinoma Advisory Board for Helsinn/QED (5/2021). R.F.D. declares Advisory Board for Exelixis INC. and Helsinn Healthcare. All other authors declare no potential conflicts of interest.

Figures

Figure 1.
Figure 1.. Single cell, protein-based expression subtype assessment in a large cohort of resected primary pancreatic tumors reveals marked intratumor heterogeneity.
A: Schematic of multiplex immunofluorescence (mIF) panel analysis workflow to determine cell and tumor subtype. B: Representative mIF images of (left to right) classical, mixed and basal tumor expression subtypes. Plots depict single marker expression and subtype for individual epithelial cells in the corresponding tumor. Scale bar = 50μm. C: Bulk RNA-seq tumor subtype compared to protein tumor subtype in metastatic PDAC (n=14), with 13/14 assignments concordant. D: Cell subtype summary of 289 primary PDAC specimens. Cell subtype across 399,224 subtype informative tumor cells. Plot depicts cell level subtype marker combinations. Percentages represent overall cell positivity per marker. E: Tumor subtype summary across 289 primary PDAC specimens with each column representing a patient tumor. Tumors were classified using both two-group and three-group classification schemes. For each tumor, the fraction of basal and classical cells is shown, along with the fraction of co-expressor cells. F: Kaplan-Meier plot showing overall survival (OS) by tumor subtype using two-group classification. G: Kaplan-Meier plot showing OS by tumor subtype using three-group classification. H: Univariate restricted cubic spline regression curves for association of basal-classical axis score with OS (P:<0.001). I: Multivariable-adjusted restricted cubic spline regression curves for association of basal-classical axis score with OS (P:0.004). Spline regression curves adjusted for age, sex, pathologic N stage, tumor grade, lymphovascular invasion, and resection margin status.
Figure 2.
Figure 2.. Single cell, protein-based expression subtype assessment identifies co-expressor cells that express classical and basal markers within the same cells.
A: Representative mIF images of the top three most prevalent co-expressor cell phenotypes. Top: KRT17+TFF1+, Middle: KRT17+GATA6+, Bottom: KRT17+GATA6+TFF1+. Scale bar = 5μm. B: Higher co-expressor cell fraction in mixed compared to classical-predominant or basal-predominant tumors (Chi2 test). C: Schematic of co-expressor cell polarization. Basal marker and classical marker expression intensities assessed to calculate a subtype polarization score in co-expressor cells. D: Histogram of subtype polarization score for co-expressor cells with class cut-offs depicted. E: Across 266 resected tumors, co-expressor cell polarization was highly heterogeneous, with strong basal or strong classical marker polarization scores enriched in tumors with high fractions of pure basal or pure classical cell fractions, respectively. Each column represents one tumor. F: Correlations between co-expressor polarization classes and pure classical and basal cell fractions. Strong basal co-expressor cell abundance was positively correlated with pure basal fraction (Pearson correlation R=0.76, P<0.001, strong classical co-expressor cell abundance was positively correlated with pure classical cell fraction (Pearson correlation R=0.5, P<0.001). G: Classical marker expression intensity in strong classical co-expressor cells and pure classical cells (Mann-Whitney test). H: Basal marker expression intensity in strong basal co-expressor cells and pure basal cells (Mann-Whitney test). *** p value significant at <0.001, **** p value significant at <0.0001.
Figure 3.
Figure 3.. Pancreatic cancer expression subtype concordance across tissue areas.
A: Representative mIF images from tissue microarray (TMA) core analysis. Case: PANT0084. Top: Core 1. Bottom: Core 2. (Also areas with red border in Fig.3D), scale bar = 100μm. B: Pairwise comparison for basal-classical axis score from 2 cores per tumor (N=220 tumors, with vertical bars representing the 2 cores for each patient). Strong positive correlation in basal-classical axis score between cores (Pearson correlation R=0.67, P<0.0001). C. Representative mIF images from ROI analysis in WSS. Case: PANT0084. Whole slide image. White boxes denote ROI sample sites for WSS analysis (7 sites), red circles denote sample sites for TMA analysis (2 sites) and yellow dash line denotes tumor area. Images 1–7, scale bar = 100μm. D: Strong positive correlation between basal-classical axis score as determined by mIF in TMA cores and whole slide sections (N=25, Pearson correlation R=0.86, P<0.0001). E. Strong positive correlation in basal-classical axis score between 2 core needle biopsy specimens from the same metastatic lesion analyzed using mIF and scRNA-seq (N=10, Pearson correlation R=0.91, P<0.0001). F: Tumor-level correlation analysis for two needle biopsy cores from the same metastatic lesion. Categorical tumor subtype call (basal: >50% basal fraction, classical: >50% classical fraction) and subtype fraction comparison.
Figure 4.
Figure 4.. Comparison of single cell, protein-based expression subtype assessment between primary and metastatic pancreatic tumors and patient-derived organoids.
A: Positivity for classical and basal subtype markers within individual cells in primary and metastatic specimens. All classical markers are more commonly expressed in cells from primary tumors and all basal markers are more commonly expressed in cells from metastatic tumors (Mann-Whitney test). B: Comparison of aggregate cell subtype fractions in primary and metastatic tumors (Chi2 test). C: Co-expressor fraction among classical-predominant, mixed, and basal-predominant tumors. D: Tumor-level summary of tumor expression subtype and cell subtype fractions in metastatic PDAC (n=37). Top to bottom: tumor subtype using 2-group classification. Tumor subtype using 3-group classification. Cell subtype fraction per tumor. Co-expressor cell fraction per tumor. E: Tumor subtype distribution for primary and metastatic tumors (Chi2 test). *** P<0.001, **** P<0.0001. F: Representative mIF images of classical-predominant and basal-predominant organoids. Scale bar = 50μm. G: Cell subtype fraction between primary tissue, metastatic tissue, primary organoid and metastatic organoid specimens. Both organoid cohorts exhibited significantly higher co-expressor cell fractions than the corresponding primary resection and metastatic biopsy tissue cohorts (Mann-Whitney test). H: Co-expressor cell abundance in primary tissue, metastatic tissue, primary organoid and metastatic organoid specimens (Mann-Whitney test). I: Co-expressor fraction among classical-predominant, mixed, and basal-predominant tumors for patient-derived organoids. Co-expressor cell fraction is higher in mixed tumors from primary and metastatic sites (4C), but not in patient-derived organoids (4I) (Mann-Whitney test). Statistical testing was not performed between basal and mixed tumors for organoids due to insufficient cases for comparison. *** P<0.001, **** P <0.0001.
Figure 5.
Figure 5.. Tumor gland expression subtype composition and organization further suggest co-expressor cells as an intermediate state between pure classical and pure basal cells.
A: Schematic representing analysis workflow. Following gland-unit identification, cell order and subtype were determined. Gland composition identified, and direct neighbor and domain analysis conducted. B: Gland type distribution in primary tissue, metastatic tissue, primary organoid and metastatic organoid specimens. C: Distribution of gland composition for co-expressor containing and non-co-expressor containing glands by specimen type for gland units containing subtype informative cells, demonstrating gland units comprised of basal and classical cells rarely observed across cohorts and most gland units to be a mixture of expression subtypes. D: Direct neighbor analysis with comparison of expected and observed frequencies of subtypes by cell of reference and specimen type. Basal cells neighbor basal cells and classical cells neighbor classical cells more frequently than expected by chance. Difference between observed an expected frequencies per gland unit depicted (Mann-Whitney test between observed and expected frequencies) (Outliers removed from boxplots). E: Representative mIF images of gland-units by specimen type (top to bottom), scale bar = 10μm. Left to right: Gland-unit: DAPI and CKPAN, Classical markers: GATA6, CLDN18.2 and TFF1, Basal markers: KRT17, KRT5 and S100A2, Merge, Direct neighbor analysis schematic of cell subtypes in gland unit, Domain analysis schematic of concatenated domains of cell subtypes. E: Domain analysis of gland-units derived from primary resection, metastatic biopsy and patient-derived organoids. Domains of co-expressor cells are frequently flanked by domains of classical or basal cells, while domains of basal and classical cells are rarely directly adjacent. **** P<0.0001.

References

    1. American Cancer Society. 2020 Cancer Estimates [Internet]. 2020. Available from: https://cancerstatisticscenter.cancer.org/module/yg6E0ZLc
    1. Orth M, Metzger P, Gerum S, Mayerle J, Schneider G, Belka C, et al. Pancreatic ductal adenocarcinoma: biological hallmarks, current status, and future perspectives of combined modality treatment approaches. Radiation Oncology. 2019;14:141. - PMC - PubMed
    1. Adamska A, Domenichini A, Falasca M. Pancreatic Ductal Adenocarcinoma: Current and Evolving Therapies. Int J Mol Sci. MDPI; 2017;18:1338. - PMC - PubMed
    1. Aung KL, Fischer SE, Denroche RE, Jang G, Dodd A, Creighton S, et al. HHS Public Access Cancer : Early Results from the COMPASS Trial. 2019;24:1344–54. - PMC - PubMed
    1. Aung KL, Fischer SE, Denroche RE, Jang G-H, Dodd A, Creighton S, et al. Genomics-Driven Precision Medicine for Advanced Pancreatic Cancer: Early Results from the COMPASS Trial. Clin Cancer Res. United States; 2018;24:1344–54. - PMC - PubMed

Publication types