. 2022 Dec 1;29(12):1669-1684.e6.
doi: 10.1016/j.stem.2022.11.007.

A mineralizing pool of Gli1-expressing progenitors builds the tendon enthesis and demonstrates therapeutic potential

Affiliations

A mineralizing pool of Gli1-expressing progenitors builds the tendon enthesis and demonstrates therapeutic potential

Fei Fang et al. Cell Stem Cell. .

Abstract

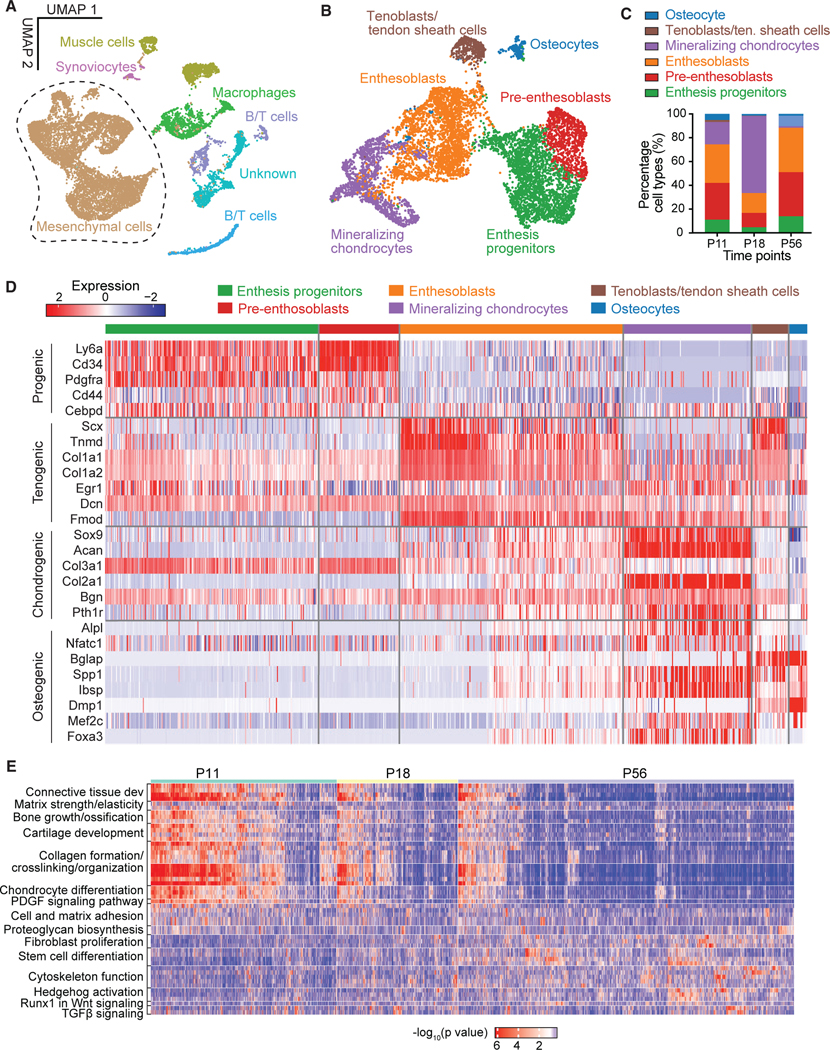
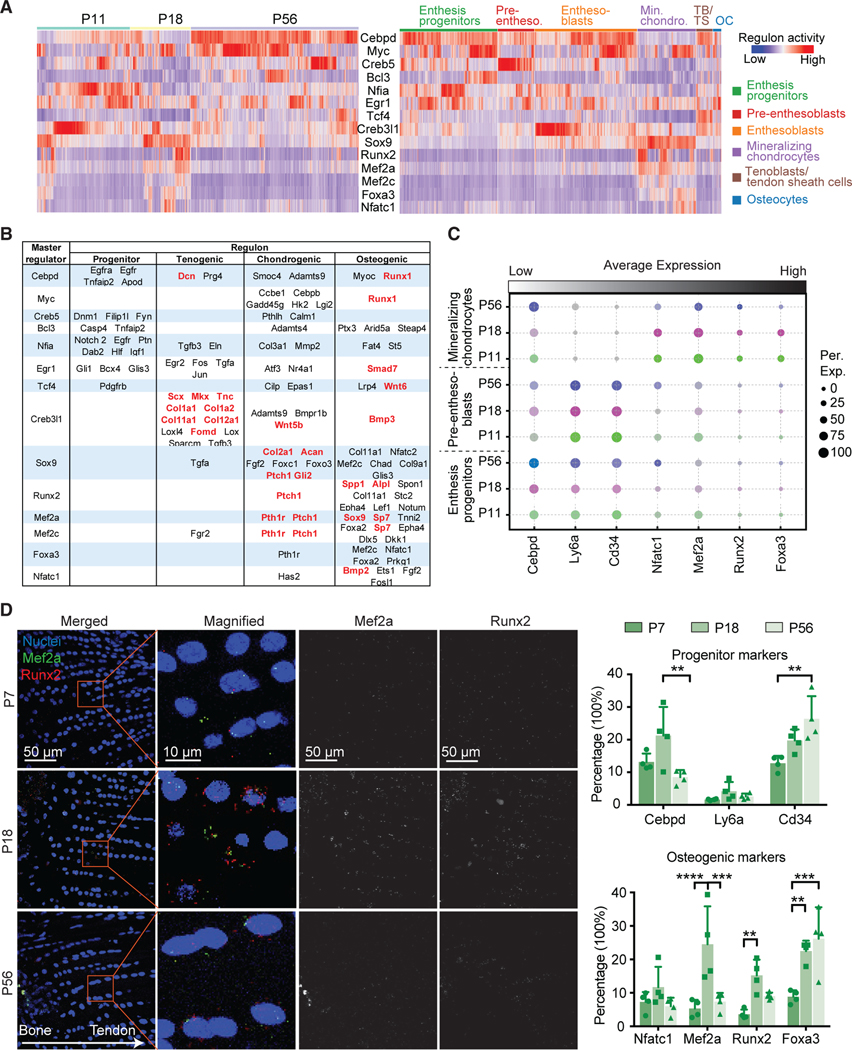
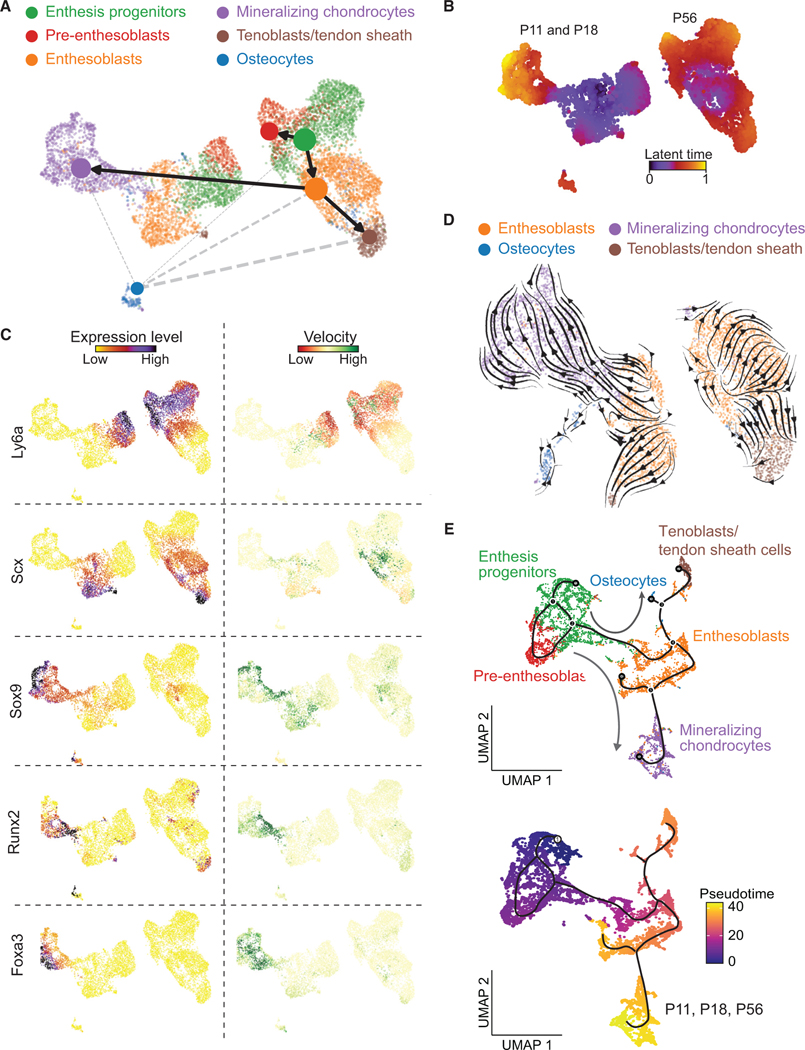
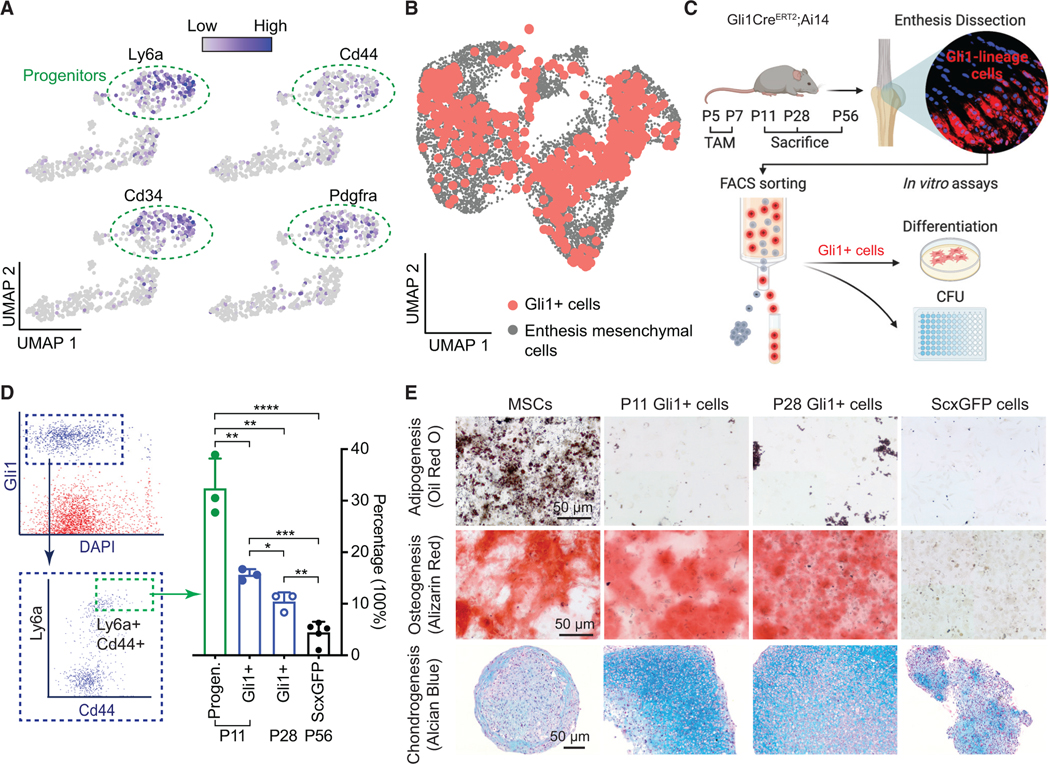
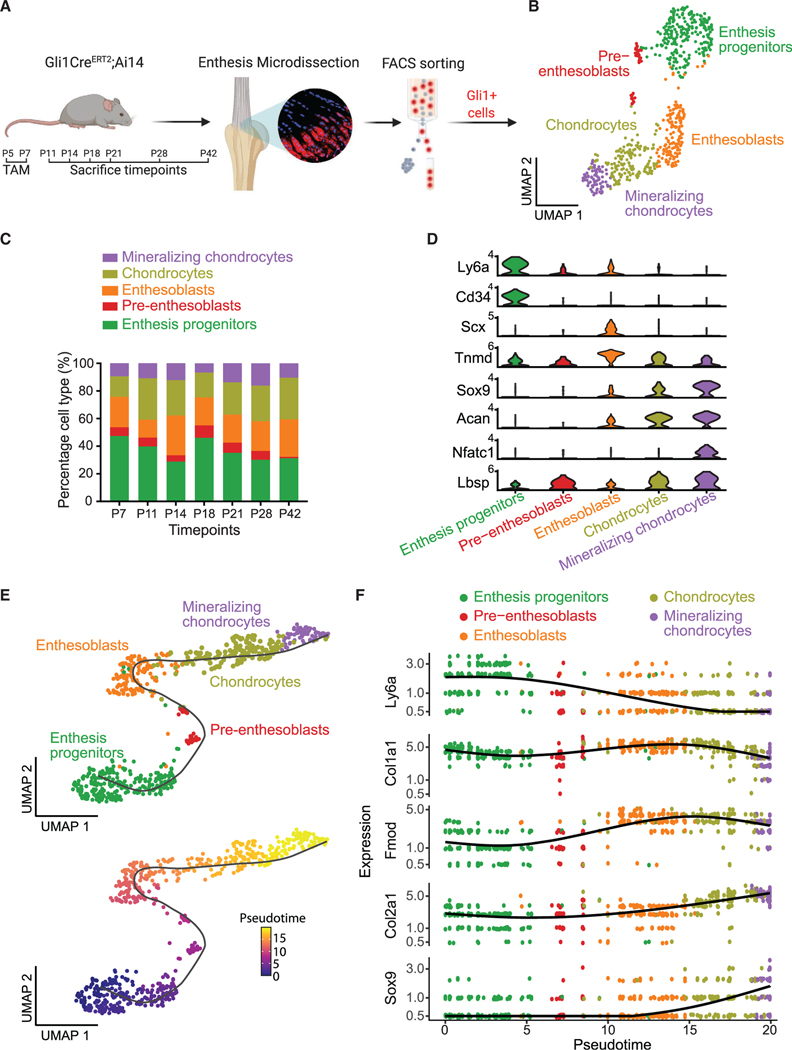
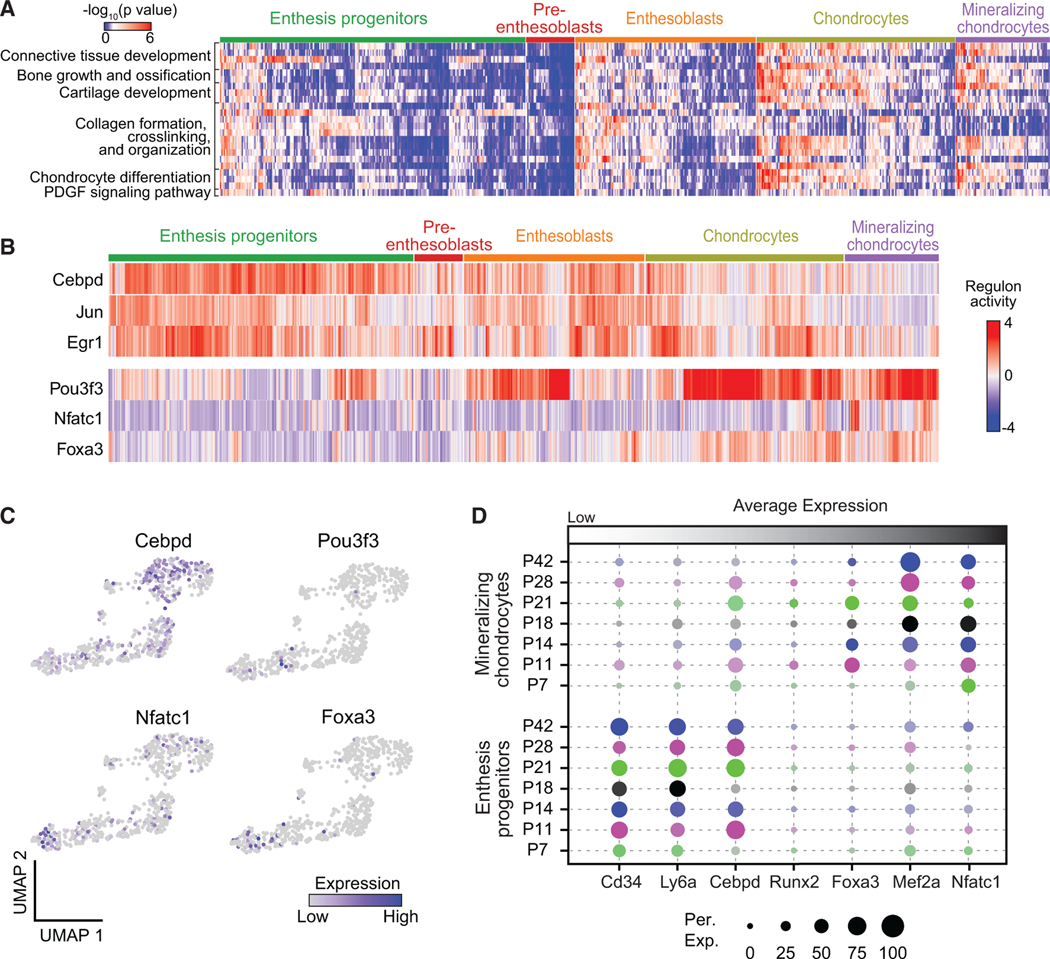
The enthesis, a fibrocartilaginous transition between tendon and bone, is necessary for force transfer from muscle to bone to produce joint motion. The enthesis is prone to injury due to mechanical demands, and it cannot regenerate. A better understanding of how the enthesis develops will lead to more effective therapies to prevent pathology and promote regeneration. Here, we used single-cell RNA sequencing to define the developmental transcriptome of the mouse entheses over postnatal stages. Six resident cell types, including enthesis progenitors and mineralizing chondrocytes, were identified along with their transcription factor regulons and temporal regulation. Following the prior discovery of the necessity of Gli1-lineage cells for mouse enthesis development and healing, we then examined their transcriptomes at single-cell resolution and demonstrated clonogenicity and multipotency of the Gli1-expressing progenitors. Transplantation of Gli1-lineage cells to mouse enthesis injuries improved healing, demonstrating their therapeutic potential for enthesis regeneration.

Keywords: Gli1; cell-based therapy; differentiation trajectory; enthesis development; enthesis injury; progenitor cells; scRNA-seq; tendon; transcription factors.


Conflict of interest statement

Declaration of interests The authors declare no competing interests.

Figures

Figure 1.
Figure 1.. Categorization and transcriptomes of SST enthesis cells by scRNA-seq
(A) UMAP plot of all cells integrated from tendon entheses at postnatal day 11 (P11), P18, and P56. (B) Subsetting and further clustering of enthesis mesenchymal cells indicated by dashed outline in (A). Only this subset of enthesis cells was used for the subsequent analyses. (C) Percentage of cell types for P11, P18, and P56. Tenoblasts/ten. sheath cells, tenoblasts/tendon sheath cells. (D) Heatmap of enthesis mesenchymal cells, integrated from P11, P18, and P56, with columns representing each cell subpopulation and rows representing established maker genes for the particular cell types indicated on the left. (E) Heatmap of biological processes at different time points.
Figure 2.
Figure 2.. Identification of candidate regulators for enthesis development and mineralization using single-cell network inference and FISH
(A) The activities of selected top regulons (rows) presented by time point (left) and cell type (right), as detected by SCENIC analysis. Pre-entheso., pre-enthesoblasts; Min. chondro., mineralizing chondrocytes; TB/TS, tenoblasts/tendon sheath cells; OC, osteocytes. (B) Summary of putative transcription factor regulons (rows) mediating progenitor function, tenogenesis, and chondrogenesis. (C) Average expression levels of transcription factors identified in (A) and (B) for enthesis progenitors, pre-enthesoblasts, and mineralizing chondrocytes at P11, P18, and P56. The color represents different time points; the brightness of each dot represents the average expression level from low (light) to high (dark), and the size of each dot represents the percentage of positive cells for each gene. (D) Representative FISH images (left) of transcription factors at the tendon enthesis identified at different time points and semi-quantitative histomorphometric analysis of expression of these transcription factors (percentage of cells with positive staining; right; n = 3/group). The panels in the second column (left) are magnified images corresponding to the red rectangles. *p < 0.05, **p < 0.01, ***p < 0.001. All data are presented as mean ± standard deviation.
Figure 3.
Figure 3.. Cell differentiation trajectories of tendon enthesis cells predicted by scVelo and Monocle
(A) Trajectory model of scVelo predicts cell-type transitions with single-cell embedding, colored by annotated cell types. Thicker and solid lines indicate stronger correlations between cell types; the size of nodes indicates the percentage of each cell type. (B) Latent time plot from scVelo analysis captures the temporal dynamics of enthesis transcriptional profiles at different time points. (C) Expression levels and velocities of representative gene markers, evaluated by scVelo. (D) RNA velocity stream of a subset of enthesis differentiated cells (i.e., enthesoblasts, mineralizing chondrocytes, tenoblasts/TS [tendon sheath] cells, and osteocytes) overlaid with UMAP embedding. Each arrow indicates the direction and speed of cell movement. (E) Differentiation trajectories of enthesis mesenchymal cells ordered along pseudotime using Monocle, colored by cell type (top) and pseudotime (bottom). The gray arrows show two main different differentiation paths.
Figure 4.
Figure 4.. Enthesis progenitors demonstrate clonogenicity and multipotency
(A) UMAP plots of expression levels of progenitor makers Ly6a, Cd34, Cd44, and Pdgfrα for enthesis Gli1-lineage (Gli1+) progenitor cells. (B) UMAP plot of Gli1+ cells from all experiments (Gli1+ cells from P11, P14, P18, P21, P28, and P42 and enthesis mesenchymal cells from P11, P18, and P56). (C) Study design for cell isolation and assays. (D) Gli1+ progenitors, labeled for progenitor markers Ly6a and Cd44 and subjected to FACS, had the highest clonogenicity (n = 3–5/group). Gli1+ cells as the total Gli1-lineage cells; *p < 0.05, **p < 0.01, ***p < 0.001, ****p < 0.0001. All data are presented as mean ± standard deviation. (E) Enthesis Gli1+ cells showed the capacity for osteogenesis and chondrogenesis, but not for adipogenesis (n = 3/group).
Figure 5.
Figure 5.. Enthesis Gli1+ cells demonstrate a linear differentiation trajectory
(A) Experimental design for scRNA-seq analysis of enthesis Gli1+ cells from P7, P11, P14, P18, P21, P28, and P42. (B) UMAP plot of Gli1+ cells from GliCreERT2;Ai14 mice colored by cell type. (C) Composition of each cell cluster of Gli1+ cells across different time points. (D) Violin plots of gene expression of established markers for annotating cell clusters. (E) A linear trajectory of enthesis Gli1+ cells along pseudotime was identified by Monocle, colored by cell type (top) and pseudotime (bottom). (F) Scatterplots of expression levels of representative genes ordered along pseudotime.
Figure 6.
Figure 6.. Transcriptional regulation of Gli1+ cells
(A) Heatmap of biological processes of Gli1+ cells grouped by cell clusters. (B) Activities of selected top regulons for Gli1+ cells organized by cell clusters, as identified by SCENIC analysis. (C) UMAP plots of expression levels of identified transcription factors for Gli1+ cells. (D) Average expression levels of representative gene makers for enthesis progenitors and mineralizing chondrocytes of Gli1+ cells at different time points. The color represents different time points; the brightness of each dot represents the average expression level from low (light) to high (dark); the size of each dot represents the percentage of positive cells.
Figure 7.
Figure 7.. Transplanted enthesis Gli1+ cells enhance enthesis healing
(A) Representative μCT sections (left) and histological images (right) of injured entheses at different post-operative days (POD, n = 6–8/group). The white rectangles in the μCT images identify the injured enthesis regions; the black and yellow rectangles in the histological images show injured and intact enthesis regions, respectively; the color bar shows bone density from low to high. The histology sections are stained with safranin O. Control, only collagen gel delivered; Gli1, Gli1+ cells delivered via collagen gel; POD7, post-operative day 7. (B) Representative 3D μCT images of the humeral head bone at POD28 (top), with the injured enthesis outlined with a dashed white circle (n = 6–8/group). The percentage of samples with ectopically calcified tissues near the enthesis, normalized by sample size of each group, is shown on the bottom. The white arrow points a region with HO (heterotopic ossification). “None” denotes no or negligible HO tissue formed close to enthesis; “Small” denotes relatively small HO tissue formed; “Large” denotes relatively large (length > 20 μm) HO tissue formed; Ctrl, control with no cell treatment. (C) Bone quality of the injured regions, including bone mineral density (BMD) and bone volume, quantified from μCT data (n = 6–8/group). #p < 0.10, *p < 0.05, **p < 0.01, ***p < 0.001, ****p < 0.0001. Control, no cell treatment; Enthesis Gli1, treatment with enthesis-derived Gli1+ cells; Bone Gli1, treatment with bone-derived Gli1+ cells. All data are presented as mean ± standard deviation. (D) Histological scoring, as determined from blinded evaluation of histological images (n = 6–8/group). (E) Immunohistochemical staining for collagen X and osterix at the healing enthesis at POD28 for control and enthesis-derived Gli1+ cell treatment (n = 6–8/group). (F) Biomechanical properties of healing enthesis at POD28 for control and enthesis-derived Gli1+ cell treatment (n = 7/group). (G) Density plots of expression levels of HO-related genes for all enthesis Gli1+ cells integrated from P7, P11, P14, P18, P21, P28, and P42.

Comment in

Similar articles

Cited by

References

    1. Lu HH, and Thomopoulos S. (2013). Functional attachment of soft tissues to bone: development, healing, and tissue engineering. Annu. Rev. Biomed. Eng 15, 201–226. 10.1146/annurev-bioeng-071910-124656. - DOI - PMC - PubMed
    1. Schett G, Lories RJ, D’Agostino MA, Elewaut D, Kirkham B, Soriano ER, and McGonagle D. (2017). Enthesitis: from pathophysiology to treatment. Nat. Rev. Rheumatol 13, 731–741. 10.1038/nrrheum.2017.188. - DOI - PubMed
    1. Derwin KA, Galatz LM, Ratcliffe A, and Thomopoulos S. (2018). Enthesis repair: challenges and opportunities for effective tendon-to-bone healing. The Journal of bone and joint surgery. J. Bone Joint Surg. Am 100, e109. 10.2106/jbjs.18.00200. - DOI - PMC - PubMed
    1. Thomopoulos S, Genin GM, and Galatz LM (2010). The development and morphogenesis of the tendon-to-bone insertion What development can teach us about healing. J. Musculoskelet. Neuronal Interact 10, 35–45. - PMC - PubMed
    1. Genin GM, Kent A, Birman V, Wopenka B, Pasteris JD, Marquez PJ, and Thomopoulos S. (2009). Functional grading of mineral and collagen in the attachment of tendon to bone. Biophys. J 97, 976–985. 10.1016/j.bpj.2009.05.043. - DOI - PMC - PubMed

Publication types

Substances

LinkOut - more resources