. 2022 Dec 1;109(12):2196-2209.
doi: 10.1016/j.ajhg.2022.11.004.

Functional characterization of 5p15.33 risk locus in uveal melanoma reveals rs452384 as a functional variant and NKX2.4 as an allele-specific interactor

Affiliations

Functional characterization of 5p15.33 risk locus in uveal melanoma reveals rs452384 as a functional variant and NKX2.4 as an allele-specific interactor

Anne-Céline Derrien et al. Am J Hum Genet. .

Abstract

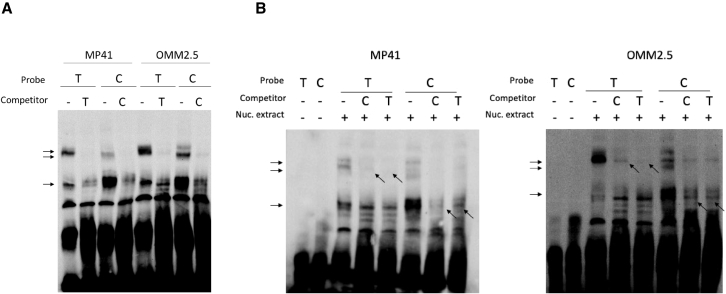
The TERT/CLPTM1L risk locus on chromosome 5p15.33 is a pleiotropic cancer risk locus in which multiple independent risk alleles have been identified, across well over ten cancer types. We previously conducted a genome-wide association study in uveal melanoma (UM), which uncovered a role for the TERT/CLPTM1L risk locus in this intraocular tumor and identified multiple highly correlated risk alleles. Aiming to unravel the biological mechanisms in UM of this locus, which contains a domain enriched in active chromatin marks and enhancer elements, we demonstrated the allele-specific enhancer activity of this risk region using reporter assays. In UM, we identified the functional variant rs452384, of which the C risk allele is associated with higher gene expression, increased CLPTM1L expression in UM tumors, and a longer telomere length in peripheral blood mononuclear cells. Electrophoretic mobility shift assays and quantitative mass spectrometry identified NKX2.4 as an rs452384-T-specific binding protein, whereas GATA4 preferentially interacted with rs452384-C. Knockdown of NKX2.4 but not GATA4 resulted in increased TERT and CLPTM1L expression. In summary, the UM risk conferred by the 5p locus is at least partly due to rs452384, for which NKX2.4 presents strong differential binding activity and regulates CLPTM1L and TERT expression. Altogether, our work unraveled some of the complex regulatory mechanisms at the 5p15.33 susceptibility region in UM, and this might also shed light on shared mechanisms with other tumor types affected by this susceptibility region.

Keywords: TERT/CLPTM1L; cancer genetics; functional genomics; uveal melanoma.


Conflict of interest statement

Declaration of interests The authors declare no competing interests.

Figures

None
Graphical abstract
Figure 1
Figure 1
Allele-specific regulatory activity conferred by rs452384 at the TERT/CLPTM1L chr5p15.33 uveal melanoma risk locus (A) A sub-region at the TERT/CLPTM1L risk locus is enriched in marks of open chromatin and behaves as an enhancer. Top panel: Map of the TERT/CLPTM1L genomic region along with highly correlated variants associated with risk of uveal melanoma (UM) identified in our initial GWAS study, aligned on hg19 genome. Chromosomal positions of TERT and CLPTM1L are shown, where vertical bars represent exons and arrows indicate transcriptional directionality. Significant UM risk SNPs are shown in red bars, and other SNPs appear in grey. LD pairwise correlation structure for SNPs in this region (zoom-in of CLPTM1L) is shown by shadings of grey according to r2 values. Layered ENCODE chromatin marks (H3K27ac, DNase I hypersensitivity sequencing, transcription factor ChIP-seq -TF - and DNA repeated regions) were downloaded from UCSC genome browser and were generated from ENCODE using sequencing data from all available cell lines (GM12878 in red, H1-hESC in yellow, HSMM in turquoise, HUVEC in light blue, K562 in blue, NHEK in violet, and NHLF in pink). Finally, genomic positions of amplicons used for ChIP experiments are shown by orange circles (ChIP-H3K27ac) and green squares (ChIP-NKX2.4 and GATA4). Bottom panel: Fragment deletion analysis strategy to narrow down the sub-region from the full haploblock tested (“full vector”; represented by a red rectangle), mediating the most differential luciferase activity between the high-risk (HR) and low-risk (LR) UM haplotypes. The full vector insert was trimmed from its 5' end or 3' end to generate smaller fragments A to G, represented by grey bars and subsequently used for luciferase assays (Figure 1C). UM risk variants within the region tested are shown in black and red. (B) Allele-specific luciferase activity of the HR and LR haploblocks of the CLPTM1L locus enriched in active histone marks (red fragment in Figure 1A) in two UM cell lines, MP41 (Figure 1) and OMM2.5 (Figure S2). The enhancer region (“full vector”) containing either protective or risk UM variants was cloned upstream of a pGL3-promoter reporter vector, followed by transfection and luciferase assay. Luciferase activity was normalized to Renilla luciferase levels and to empty vector (EV). Mean relative luciferase activity ± standard deviation (SD) is shown (left); experiments were performed in triplicate and repeated independently in n = 6 experiments. Mean HR/LR luciferase ratios ± SD are also shown (right); the hypothetical ratio of HR/LR = 1, representing equal luciferase activity between the two haplotypes, is indicated by a black dashed line. (C) Fragment deletion analysis by luciferase activity assay. Individual fragments A to G (Figure 1A) of both haplotypes (HR and LR) were tested for luciferase activity as described in 1B, in MP41 (Figure 1) and OMM2.5 (Figure S2). Graphs represent the differential luciferase ratio (HR/LR) observed in each fragment, compared with vector containing the full insert initially tested (“full vector”). Mean luciferase ratios ± SD are shown for n = 3 independent experiments. (D) Site-directed mutagenesis in reporter vectors harboring Fragment F (“Fragment F vector”) of rs452932, rs452384, and rs370348, the three variants associated with UM risk within the tested region, from their protective to risk allele in MP41 (Figure 1) and OMM2.5 (Figure S2). Resulting vectors were tested in luciferase activity assays and compared to vectors containing the full LR or HR haplotypes (i.e., Fragment F vector harboring all three variants with either their protective allele or risk allele). Mean luciferase ratios ± SD are shown for n = 3 independent experiments. (E) Double site-directed mutagenesis at rs452932 and rs452384 positions (both SNPs T>C) in MP41, compared with “single” mutants described in 1D by luciferase activity assays. The same process was subsequently repeated starting from the HR haplotype vector and mutating tested variants to their protective allele (C>T). Graphs represent mean ± SD for experiments carried out n = 3 independent times. Unpaired two-sided t test p values: ns for p > 0.05, for p < 0.05, ∗∗ for p < 0.005, and ∗∗∗ for p < 0.001.
Figure 2
Figure 2
Relative telomere length in peripheral blood mononuclear cells (PBMCs) of UM-affected individuals and controls according to rs452384 genotype Relative telomere length was measured by qPCR using primers for telomeric repeats and normalized to expression of a single copy gene, HMBS. Germline DNA samples (dots) from PBMCs of N = 208 male UM-affected individuals and N = 118 male healthy individuals from the GWAS cohort were used, stratified according to their rs452384 genotype. Number of individuals in each genotype group is indicated in brackets. Differences in telomere length were assessed using an age-adjusted generalized linear additive model (GLM) p value. Pairwise comparisons of telomere length (between two genotypes) are shown in Figure S4.
Figure 3
Figure 3
rs452384 preferentially binds nuclear proteins Electrophoretic mobility shift assays (EMSAs) using double-stranded biotinylated DNA oligonucleotides containing either rs452384-T (protective allele) or rs452384-C (risk allele) in the MP41 and OMM2.5 UM cell lines. (A) Nuclear complexes preferentially bind to the protective allele (T) or to the risk allele (C) (black arrows). Upon addition of specific unlabeled competitor probes of the same allele in 100X molar excess, these complexes disappear or are strongly attenuated. (B) Nuclear complex that is preferentially bound to C probe (bottom horizontal arrow) is more displaced with unlabeled C probe compared with unlabeled T probe added in 100X excess (bottom angled arrows), and vice versa for complex preferentially bound to T probe.
Figure 4
Figure 4
NKX2.4 is an allele-specific interactor of rs452384-T regulating TERT and CLPTM1L, whereas GATA4 is enriched in rs452384-C (A and B) Quantitative mass spectrometry analysis after DNA pulldown using either rs452384-T, rs452384-C, or negative control (NEG) biotinylated probes, showing enrichment of proteins with C or T alleles. Each condition was performed in n = 5 independent biological replicates, and proteins with at least three distinct peptides and a Benjamini-Hochberg adjusted p value of ≤ 0.05 (see Methods) were kept for analysis. (A) Volcano plot of all proteins enriched in rs452384-T or -C probes, denoted by arrows pointing left and right, respectively, represented as log2(fold change C/T) on the x-axis and –log10(p value) (y-axis). A horizontal red line represents the significant p value threshold of ≤ 0.05, whereas the vertical green lines indicate the absolute fold change threshold ≥ 1.5 of C/T and T/C enrichments. Enriched transcription factors are shown; only those written in bold are also significantly enriched against NEG probe. (B) Correlation plot comparing enrichment ratios T/NEG (y-axis) to C/NEG (x-axis) on a log2 scale. Green lines indicate an absolute fold change threshold of ≥1.5. Proteins that specifically bind to T or C alleles are found in the top left and bottom right squares, respectively, whereas those preferentially enriched in one allele (but still enriched in both alleles vs NEG) are found in the top right corner, where the black dashed diagonal deliminates the T (left)- or C (right)-enriched interactors. (C) Supershift EMSAs using rs452384-T or -C probes, nuclear extracts of MP41 cells transfected with either NKX2.4-flag-tag (left) or GATA4-flag-tag (right) expression vectors, and 2μg of anti-flag antibody (Ab) or negative anti-IgG control. Results show an allele-specific supershift (top arrows) of NKX2.4-flag with rs452384-T probe, whereas a preferential supershift in rs452384-C probe compared with -T is seen with GATA4-flag. Both complexes without addition of antibody (bottom arrows) disappear or greatly diminish upon addition of 100X excess of unlabeled competitor C and T probes. (D) rs452384T>C on chr5p15.33 disrupts a predicted DNA binding motif for NKX2.4 (JASPAR database), whereas the rs452384 C allele favors GATA4 binding compared with rs452384 T (the core binding motif itself remains unaltered, but C is preferred over T at the 10th position). (E and F) Chromatin immunoprecipitation (ChIP) experiments of Mel202 (E) and MP41 cells (F) using an anti-HA antibody (after transfection with NKX2.4-HA expression vector) or an anti-GATA4 antibody. In (E) enrichment at the rs452384 genomic position was measured by qPCR, compared with two other regions within CLPTM1L exons 3 and intron 4 (green squares in Figure 1A and Table S2) and compared with IP with empty vector (EV) (for NKX2.4-HA) or IgG (for GATA4). Graphs represent mean ± SD for a representative experiment (n = 3 independent experiments in total). In (F), allele-specific enrichment of MP41 immunoprecipitated DNA at rs452384 was measured by ddPCR, relative to input DNA allelic ratio. Graph represents T/C allelic ratios ± 68% Poisson confidence intervals for n = 3 independent experiments; an unpaired two-sided t test was used to compare allelic enrichment in each group compared with the hypothetical ratio of 1 (dashed line) representing equal enrichment of C and T alleles. (G) siRNA-mediated knockdown of NKX2.4 and GATA4. The Mel202 UM cell line homozygous for rs452384 protective T allele was transfected with siRNAs targeting either NKX2.4 or GATA4, or with a negative siRNA control (siCTRL). Knockdown efficiencies of both genes are shown in Figure S11A. Resulting expression of TERT and CLPTM1L relative to that of the GUSB housekeeping gene was measured by ddPCR using Taqman gene expression assays and compared with siCTRL. Independent experiments were performed n = 5 times for siNKX2.4 and n = 3 times for siGATA4. Graphs represent relative gene expression ± 68% Poisson confidence intervals for each biological replicate. Unpaired two-sided t tests were used to compare expression levels between conditions. P values: ns for p > 0.05, for p < 0.05, ∗∗ for p < 0.005, and ∗∗∗ for p < 0.001.

References

    1. Singh M., Durairaj P., Yeung J. Uveal melanoma: a review of the literature. Oncol. Ther. 2018;6:87–104. - PMC - PubMed
    1. Jager M.J., Shields C.L., Cebulla C.M., Abdel-Rahman M.H., Grossniklaus H.E., Stern M.H., Carvajal R.D., Belfort R.N., Jia R., Shields J.A., Damato B.E. Uveal melanoma. Nat. Rev. Dis. Primers. 2020;6:24. - PubMed
    1. Van Raamsdonk C.D., Bezrookove V., Green G., Bauer J., Gaugler L., O'Brien J.M., Simpson E.M., Barsh G.S., Bastian B.C. Frequent somatic mutations of GNAQ in uveal melanoma and blue naevi. Nature. 2009;457:599–602. - PMC - PubMed
    1. Johansson P., Aoude L.G., Wadt K., Glasson W.J., Warrier S.K., Hewitt A.W., Kiilgaard J.F., Heegaard S., Isaacs T., Franchina M., et al. Deep sequencing of uveal melanoma identifies a recurrent mutation in PLCB4. Oncotarget. 2016;7:4624–4631. - PMC - PubMed
    1. Harbour J.W., Onken M.D., Roberson E.D.O., Duan S., Cao L., Worley L.A., Council M.L., Matatall K.A., Helms C., Bowcock A.M. Frequent mutation of BAP1 in metastasizing uveal melanomas. Science. 2010;330:1410–1413. - PMC - PubMed

Publication types

LinkOut - more resources