. 2022 Dec 20;3(12):100833.
doi: 10.1016/j.xcrm.2022.100833. Epub 2022 Nov 15.

Loss of GM-CSF-dependent instruction of alveolar macrophages in COVID-19 provides a rationale for inhaled GM-CSF treatment

Affiliations

Loss of GM-CSF-dependent instruction of alveolar macrophages in COVID-19 provides a rationale for inhaled GM-CSF treatment

Cedric Bosteels et al. Cell Rep Med. .

Abstract

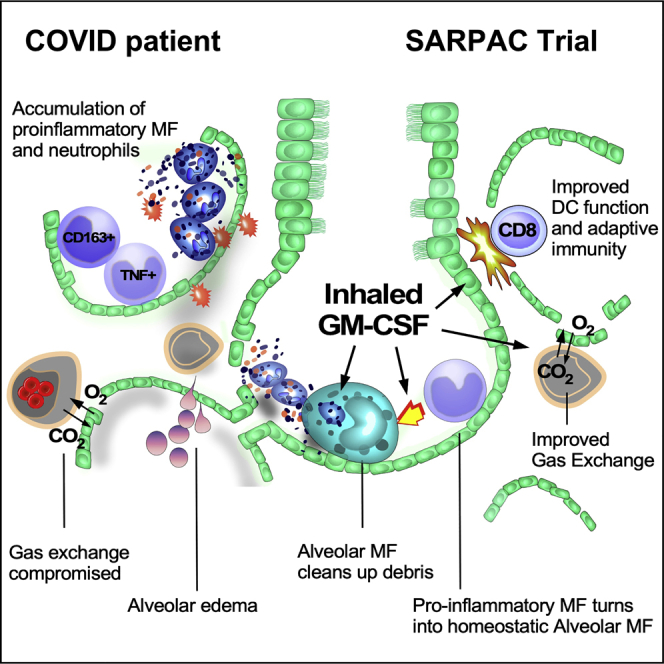
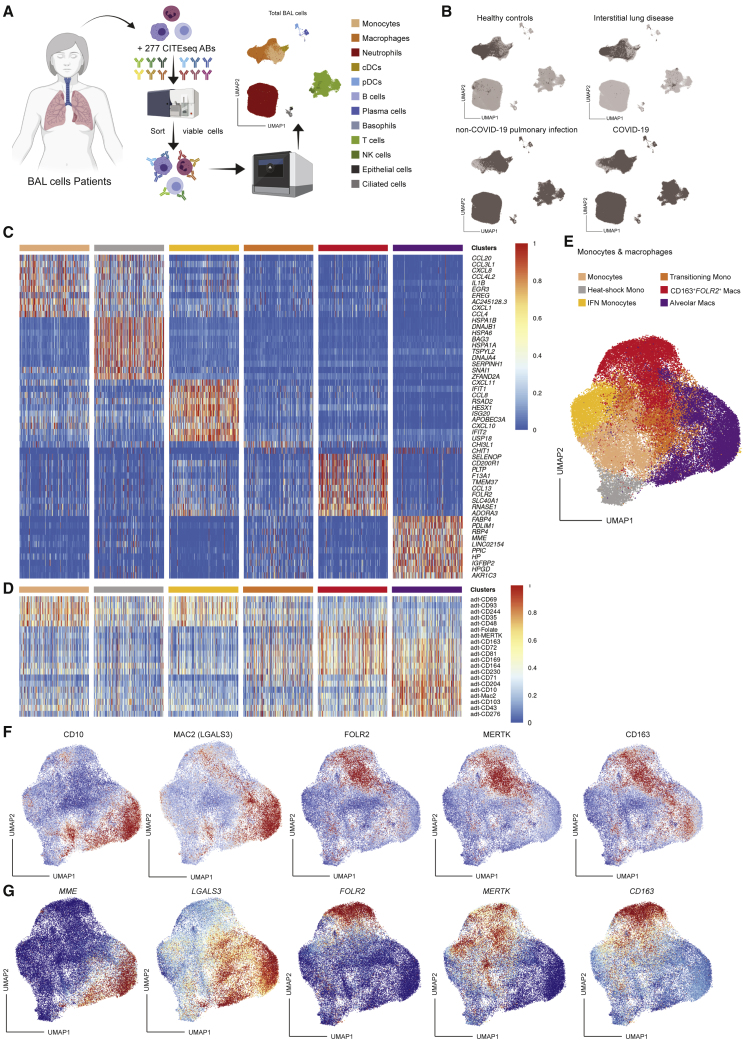
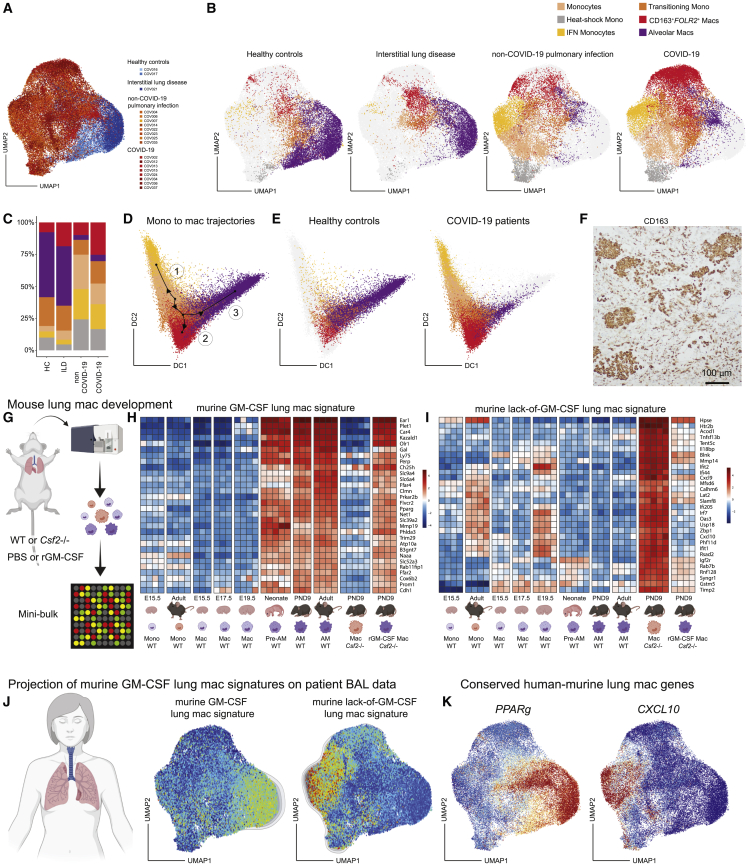
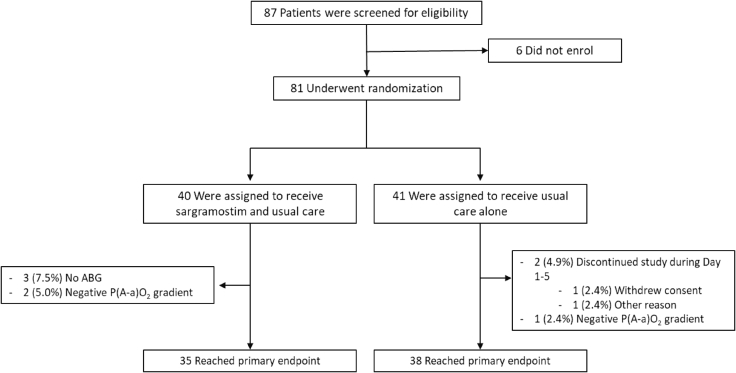
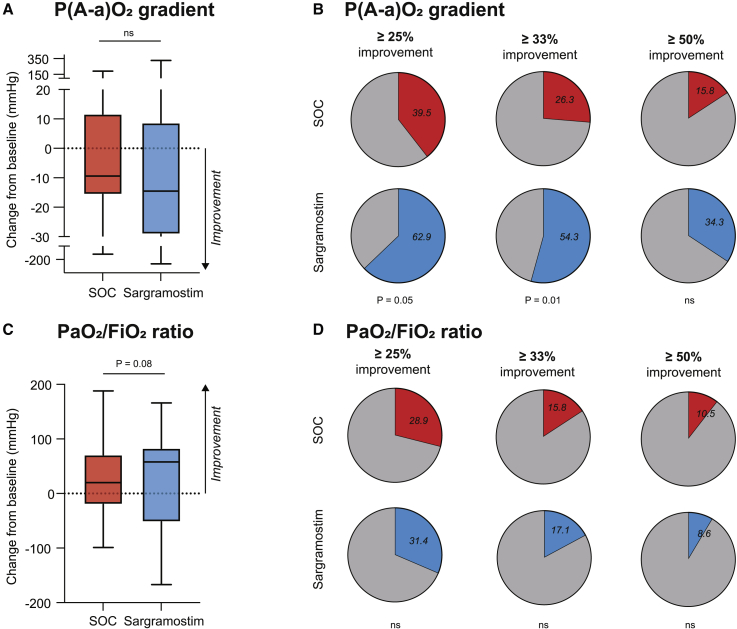
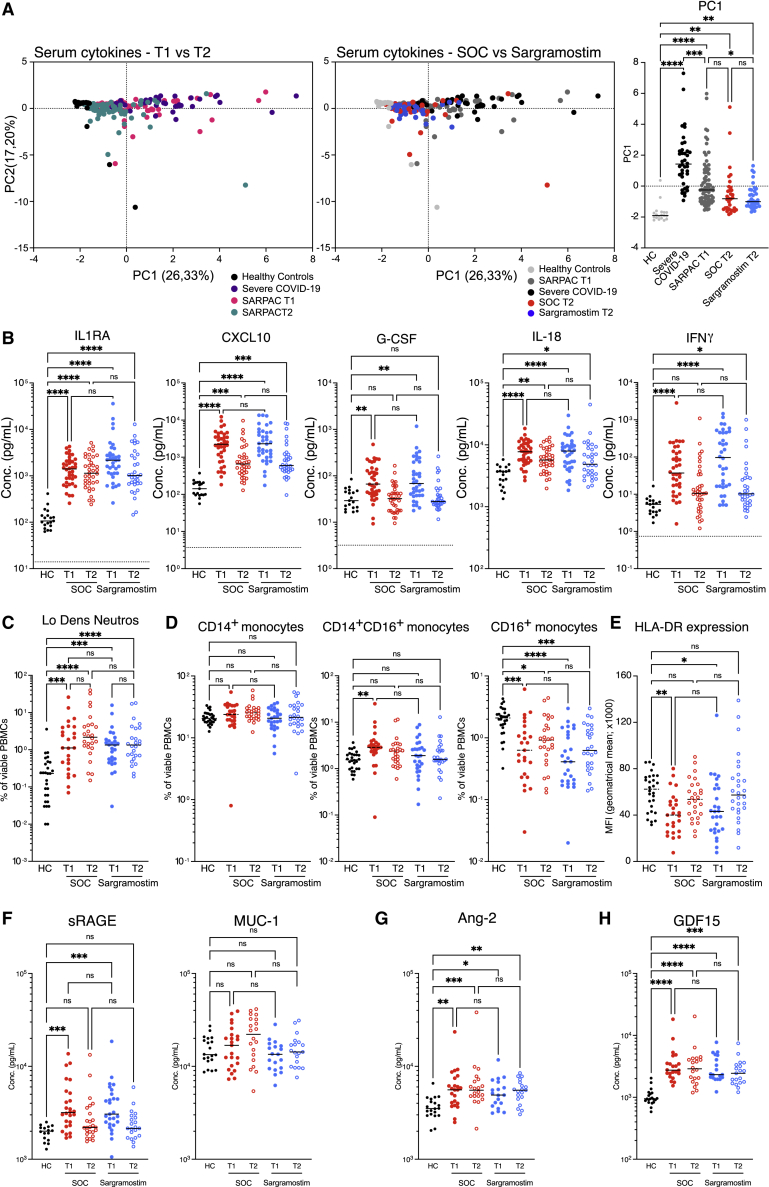
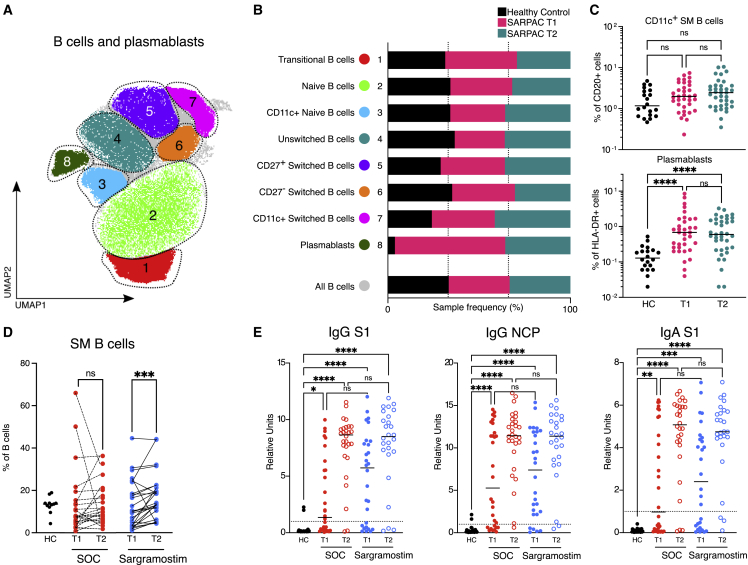
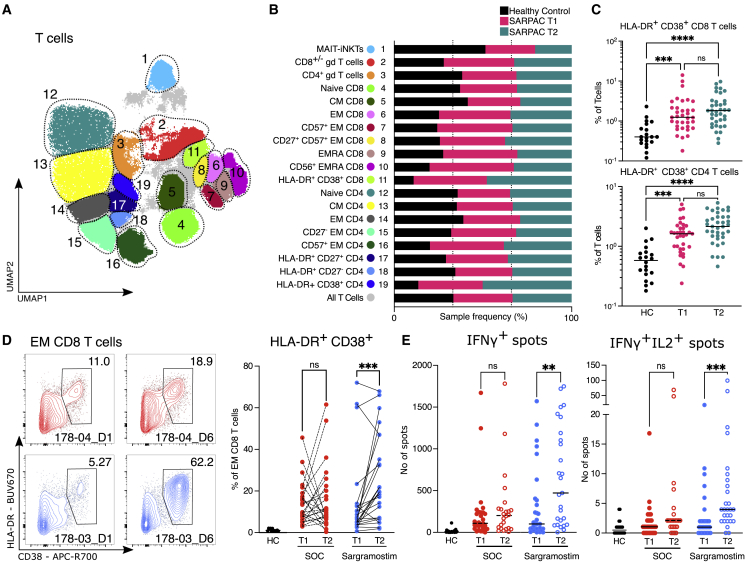
GM-CSF promotes myelopoiesis and inflammation, and GM-CSF blockade is being evaluated as a treatment for COVID-19-associated hyperinflammation. Alveolar GM-CSF is, however, required for monocytes to differentiate into alveolar macrophages (AMs) that control alveolar homeostasis. By mapping cross-species AM development to clinical lung samples, we discovered that COVID-19 is marked by defective GM-CSF-dependent AM instruction and accumulation of pro-inflammatory macrophages. In a multi-center, open-label RCT in 81 non-ventilated COVID-19 patients with respiratory failure, we found that inhalation of rhu-GM-CSF did not improve mean oxygenation parameters compared with standard treatment. However, more patients on GM-CSF had a clinical response, and GM-CSF inhalation induced higher numbers of virus-specific CD8 effector lymphocytes and class-switched B cells, without exacerbating systemic hyperinflammation. This translational proof-of-concept study provides a rationale for further testing of inhaled GM-CSF as a non-invasive treatment to improve alveolar gas exchange and simultaneously boost antiviral immunity in COVID-19. This study is registered at ClinicalTrials.gov (NCT04326920) and EudraCT (2020-001254-22).

Keywords: CITE-seq; COVID-19; GM-CSF; RCT; SARPAC; alveolar macrophage; leukine; oxygenation; sargramostim; virus.


Conflict of interest statement

Declaration of interests A.S. is a consultant for Gritstone bio, Flow Pharma, Arcturus, Immunoscape, CellCarta, Oxford Immunotec, and Avalia. L.J.I. has filed for patent protection for various aspects of T cell epitope and vaccine design work. D.F.R. is an employee of and has stock options in Partner Therapeutics.

Figures

None
Graphical abstract
Figure 1
Figure 1
Profiling of BAL monocyte and macrophage clusters (A) Schematic overview of the CITE-seq pipeline on BAL cells and UMAP of the proteome- and transcriptome-based clustering. (B) UMAPs of the annotated BAL monocyte and macrophage clusters in the healthy control group (n = 2; top left), patient with interstitial lung disease (n = 1; top right), patients with non-COVID-19 pulmonary infection (n = 8; bottom left), and COVID-19 patients (n = 8; bottom right). (C and D) Heatmaps showing the top differentially expressed genes (C) and surface proteins (D) between BAL monocyte and macrophage clusters based on LogFC per cluster. Heatmaps were created by comparing the transcriptome or proteome of each annotated cluster. (E) UMAP of the annotated BAL monocyte and macrophage clusters. (F and G) UMAPs representing relative expression of key surface protein (F) and gene (G) annotation markers through CITE-seq on monocyte and macrophage subgroups (blue, low expression; red, high expression). BAL, bronchoalveolar lavage; cDCs, conventional dendritic cells; pDCs, plasmacytoid dendritic cells; NK cells, natural killer cells; UMAP, uniform manifold approximation and projection; CITE-seq, cellular indexing of transcriptomes and epitopes by sequencing.
Figure 2
Figure 2
Lack of alveolar macrophages and GM-CSF signature in COVID-19 patients (A) UMAP of BAL monocytes and macrophages originating from healthy control (light blue; n = 2), patient with interstitial lung disease (dark blue; n = 1), patients with non-COVID-19 pulmonary infection (orange; n = 8), or COVID-19 patients (red; n = 8). (B) UMAPs of the annotated BAL monocyte and macrophage clusters per patient group. (C) Relative abundance of monocyte and macrophage clusters per patient group. (D) Diffusion map and slingshot-mediated trajectory inference starting from monocytes bifurcating either to IFN-stimulated monocytes (1) or via a transitional monocyte state to either CD163+FOLR2+ interstitial macrophages (2) or alveolar macrophages (3). (E) Diffusion map of the annotated BAL monocytes and macrophages from the healthy control group (left) versus COVID-19 patient group (right). (F) Immunohistochemistry analysis of CD163 expression on lung section of a patient who succumbed to severe COVID-19. (G) Schematic overview of mini-bulk microarray setup used on monocytes and macrophages isolated from lungs of WT or Csf2−/− mice after PBS or rGM-CSF treatment. (H and I) Heatmaps showing the relative expression of the top genes present in the murine GM-CSF-dependent lung macrophage signature (H) and the murine lack-of-GM-CSF lung macrophage signature (I). In the last two columns of each panel, the relative expression of these genes by macrophages sorted from lungs of PND9 Csf2−/− mice treated with PBS (left) or rGM-CSF (right) is shown. (J) Projection of the murine GM-CSF lung macrophage signature on patient BAL CITE-seq data. (K) UMAPs representing the expression of two conserved genes between human and mouse that represent a GM-CSF gene signature (PPARg, left UMAP) or a lack-of-GM-CSF gene signature (CXCL10, right UMAP). DC, diffusion component; ILD, interstitial lung disease; rGM-CSF, recombinant granulocyte-macrophage colony-stimulating factor; PBS, phosphate-buffered saline; WT, wild type; PND9, post-natal day 9; TEAEs, treatment emergent adverse events.
Figure 3
Figure 3
Study flowchart ABG, arterial blood gas
Figure 4
Figure 4
Primary endpoint (A) Absolute change from baseline of P(A-a)O2 gradient (mm Hg) on day 6. (B) Responder rate of patients with at least 25%, 33%, or 50% improvement in P(A-a)O2 gradient (mm Hg) on day 6 compared with baseline. (C) Absolute change from baseline of PaO2/FiO2 ratio (mm Hg) on day 6. (D) Responder rate of patients with at least 25%, 33%, or 50% improvement in PaO2/FiO2 ratio (mm Hg) on day 6 compared with baseline.
Figure 5
Figure 5
Effect of sargramostim on hyperinflammation and end-organ damage (A) PC analysis of pro-inflammatory cytokines measured in serum of healthy controls (HC; n = 19), patients with severe COVID-19 (n = 39), and patients included in SARPAC at baseline (T1; n = 73) and after 5 days of treatment (T2) with either standard of care (SOC; n = 34) or sargramostim (n = 39). (B) Cytokines measured in serum of HC (n = 19), SOC (n[T1] = 36; n[T2] = 34), and sargramostim groups (n[T1] = 37; n[T2] = 39) at baseline (T1) and after 5 days of treatment (T2). (C and D) Percentages of low-density neutrophils (C) and CD14+CD16 monocytes, CD14+CD16+ monocytes, and CD14CD16+ monocytes (D) in the PBMC fraction at baseline (T1) and after 5 days of treatment (T2). (E) Surface expression of HLA-DR (MFI) on inflammatory monocytes in the PBMC fraction at baseline (T1) and after 5 days of treatment (T2). (F–H) Serum levels of sRAGE and MUC1 (F), Ang-2 (G), and GDF15 (H) in HC (n = 16), SOC (n[T1] = 26; n[T2] = 25), and sargramostim groups at baseline (T1; n = 27) and after 5 days of treatment (T2; n = 21). Statistical testing was performed using Kruskal Wallis test with Dunn’s test to correct for multiple comparisons (A–H). Statistical differences are noted as ∗p < 0.05, ∗∗p < 0.01, ∗∗∗p < 0.001, and ∗∗∗∗p < 0.0001.
Figure 6
Figure 6
Effect of sargramostim on the circulating B cell compartment (A) UMAP plot of CD20+ PBMCs depicting manual annotation of B cell clusters obtained from HCs (n = 20) and SARPAC study patients at baseline (T1; n = 35) and after 5 days of treatment (T2; n = 37). (B) Relative proportions that contribute to each B cell cluster in HC or SARPAC patients at baseline and after 5 days of treatment. (C) Relative proportions of CD11c+ switched memory B cells (top) and plasmablasts (bottom) in HCs (n = 20) and SARPAC patients at baseline (T1; n = 35) and after 5 days of treatment (T2; n = 37). (D) Percentage of switched memory B cells in PBMC fraction of HC (n = 11), SOC (n[T1] = 25; n[T2] = 25), and sargramostim group (n[T1] = 26; n[T2] = 26) at baseline (T1) and after 5 days of treatment (T2). (E) IgG and IgA antibodies against SARS-CoV-2 Spike protein 1 (S1) and nucleocapsid protein (NCP)-specific IgG antibodies in HC (n = 23), SOC (n[T1] = 30; n[T2] = 27), and sargramostim group (n[T1] = 28; n[T2] = 26) at baseline (T1) and after 5 days of treatment (T2). Statistical testing was performed using the Kruskal Wallis test with Dunn’s correction for multiple comparisons for (C) and (E) and the Wilcoxon test for (D). The line in (C) and (E) indicates the median. Statistical differences are noted as ∗p < 0.05, ∗∗p < 0.01, ∗∗∗p < 0.001, and ∗∗∗∗p < 0.0001.
Figure 7
Figure 7
Effect of sargramostim on the T cell compartment (A) UMAP plot of CD3e+ PBMCs depicting manual annotation of T cell clusters obtained from HC (n = 20) and SARPAC study patients at baseline (T1; n = 35) and after 5 days of treatment (T2; n = 37). (B) Relative proportions that contribute to each T cell cluster in HC or SARPAC patients at baseline and after 5 days of treatment. (C) Relative proportions of HLA-DR+CD38+ effector memory CD8 (top) and CD4 (bottom) T cells in HC (n = 20) and SARPAC patients at baseline (T1; n = 35) and after 5 days of treatment (T2; n = 37). (D) Flow cytometry plots pre-gated on viable effector CD8 T cells and gated on the HLA-DR+CD38+ fraction in representative samples of standard of care (SOC) and sargramostim groups at baseline (T1) and after 5 days of treatment (T2). The percentage of activated (HLA-DR+CD38+) CD8 T cells in the PBMC fraction of HC (n = 11), SOC (n[T1] = 25; n[T2] = 25), and sargramostim groups (n[T1] = 26; n[T2] = 26) at baseline (T1) and after 5 days of treatment (T2) is shown. (E) Absolute numbers of IFNγ+ (left) or IFNγ+IL-2+ (right) spots detected by ELISpot after CD8 T cell stimulation with SARS-CoV-2 peptide pools in HC (n = 22), SOC (n[T1] = 29; n[T2] = 24), and sargramostim groups (n[T1] = 30; n[T2] = 27) at baseline (T1) and after 5 days of treatment (T2). Statistical testing was performed using the Kruskal Wallis test with Dunn’s correction for multiple comparisons for (C), the Wilcoxon test for (D), and the Mann Whitney test for (E). The line in (C) and (E) indicates the median. Statistical differences are noted as ∗∗p < 0.01, ∗∗∗p < 0.001, and ∗∗∗∗p < 0.0001.

References

    1. Aegerter H., Lambrecht B.N., Jakubzick C.V. Biology of lung macrophages in health and disease. Immunity. 2022;55:1564–1580. doi: 10.1016/j.immuni.2022.08.010. - DOI - PMC - PubMed
    1. Westphalen K., Gusarova G.A., Islam M.N., Subramanian M., Cohen T.S., Prince A.S., Bhattacharya J. Sessile alveolar macrophages communicate with alveolar epithelium to modulate immunity. Nature. 2014;506:503–506. doi: 10.1038/nature12902. - DOI - PMC - PubMed
    1. Neupane A.S., Willson M., Chojnacki A.K., Vargas E Silva Castanheira F., Morehouse C., Carestia A., Keller A.E., Peiseler M., DiGiandomenico A., Kelly M.M., et al. Patrolling alveolar macrophages conceal bacteria from the immune system to maintain homeostasis. Cell. 2020;183:110–125.e11. doi: 10.1016/j.cell.2020.08.020. - DOI - PubMed
    1. Gschwend J., Sherman S.P.M., Ridder F., Feng X., Liang H.E., Locksley R.M., Becher B., Schneider C. Alveolar macrophages rely on GM-CSF from alveolar epithelial type 2 cells before and after birth. J. Exp. Med. 2021;218:e20210745. doi: 10.1084/jem.20210745. - DOI - PMC - PubMed
    1. Guilliams M., De Kleer I., Henri S., Post S., Vanhoutte L., De Prijck S., Deswarte K., Malissen B., Hammad H., Lambrecht B.N. Alveolar macrophages develop from fetal monocytes that differentiate into long-lived cells in the first week of life via GM-CSF. J. Exp. Med. 2013;210:1977–1992. doi: 10.1084/jem.20131199. - DOI - PMC - PubMed

Publication types

Substances

Associated data