Review
. 2023 Jan 18;111(2):150-175.
doi: 10.1016/j.neuron.2022.11.006. Epub 2022 Dec 1.

Rethinking retrosplenial cortex: Perspectives and predictions

Affiliations
Review

Rethinking retrosplenial cortex: Perspectives and predictions

Andrew S Alexander et al. Neuron. .

Abstract

The last decade has produced exciting new ideas about retrosplenial cortex (RSC) and its role in integrating diverse inputs. Here, we review the diversity in forms of spatial and directional tuning of RSC activity, temporal organization of RSC activity, and features of RSC interconnectivity with other brain structures. We find that RSC anatomy and dynamics are more consistent with roles in multiple sensorimotor and cognitive processes than with any isolated function. However, two more generalized categories of function may best characterize roles for RSC in complex cognitive processes: (1) shifting and relating perspectives for spatial cognition and (2) prediction and error correction for current sensory states with internal representations of the environment. Both functions likely take advantage of RSC's capacity to encode conjunctions among sensory, motor, and spatial mapping information streams. Together, these functions provide the scaffold for intelligent actions, such as navigation, perspective taking, interaction with others, and error detection.

Keywords: allocentric; egocentric; episodic memory; navigation; network oscillations; orientation; perspective taking; predictive coding; spatial transformation; temporal sequence.


Conflict of interest statement

Declaration of interests The authors declare no competing interests.

Figures

Figure 1.
Figure 1.. Summary of the computations and functions of RSC.
Those with stars * have limited experimental evidence, but we propose these based on the outcomes from the literature and describe in detail in the text. Topological mappings include routes, trajectories, and graph-based spatial knowledge. Prospective coding includes predicting the upcoming changes in perceptual input and comparing the current input to those predictions. The two broad computations provide testable hypotheses about reference frame translation and comparator models of RSC function. Ultimately, they both allow for intelligent actions, such as navigation and interacting with others, as well as detecting changes in the environment and errors in our expectations of those changes.
Figure 2.
Figure 2.. Theoretical extremes of RSC interconnectivity.
RSC, as a whole, is home to a diverse and extensive set of afferents and efferents, yet the cellular-level structuring of these inputs and outputs remains to be determined. Here, two extremes of connectivity structure are considered. In the ‘mixed’ configuration, RSC functions to fully integrate all afferent sources through convergence of afferents onto individual cells and through strong intra-RSC connectivity (bold black arrow). Here, a fixed relationship between specific RSC inputs and outputs is absent. Below, two hypothetical circuits reflect an alternative ‘discrete’ anatomical configuration. In this scheme, RSC is composed of sets of heterogeneous semi-independent circuits wherein different, weakly-interconnected sub-populations of its neurons are biased with respect to specific sets of inputs and outputs. In the mixed model, homogenous connectivity distributions may maximize encoding of highly complex forms of context through conjunctive encoding or mixed selectivity of place, orientation, environmental structure, visual stimuli, and actions. Under the discrete model, heterogeneous, semi-independent circuits may allow RSC to play multiple specific roles in spatial cognition and memory that vary across time. These independent circuits may nevertheless share reliance on one or more specific forms of information such as head orientation.
Figure 3.
Figure 3.. Differing ways to define the anatomy and connectivity of human RSC.
A) Anatomical definition of RSC based on locations of gyri and sulci. Shown in green is the cingulate isthmus, typically considered part of RSC. Shown in purple is the remainder of anatomical RSC, with the posterior border at the POS. Together these form the anatomically-defined RSC. Note that these regions do not have a clearly-defined cutoff on the superior border or anterior extent. B) Flat map of the histology of the posterior medial parietal cortex and posterior cingulate (modified from). Retrosplenial cortex defined by BA 29/30 is highlighted in orange. Note that RSC is actually on the ventral surface of the cingulate cortex, in the callosal sulcus. C) The functionally defined retrosplenial complex from a recent study, based on scene-sensitive localizers, highlighted in magenta (modified from). Comparing B and C, there is very little overlap between the two regions. For illustration purposes, we have included the portion of the functional definition that is located in posterior cingulate into panel B, although the functional region extends into the POS and the occipital lobe. We have also added the approximate location of the histological definition in panel C. Comparing A, B, and C, there is overlap between the purple region of A and portions of C, and some but not total overlap between the green region in A and the histological definition in B. D) Differences in functional connectivity across the RSC region (modified from). Seed regions (listed along the bottom with left or right hemisphere, e.g. POS LH) were grouped into three clusters based on their resting state functional connectivity profiles with canonical networks. Approximate locations of the seeds are shown to the right, although there is some variability and overlap. Locations of seeds in Cluster 1 were broadly located in the POS and into occipital lobe, those in Cluster 2 were broadly located in the anterior bank of POS, and those in Cluster 3 were broadly located in in parietal cortex around posterior cingulate and histological RSC. Vis = visual network; SoMo= sensory-motor network; DAN = dorsal attention network; VAN = ventral attention network; LIMB = limbic network; CCN = cognitive control network; DMN = default mode network; TP = temporal-parietal network, POS = parieto-occipital sulcus.
Figure 4.
Figure 4.. Egocentric, allocentric, and route-centered activity correlates of retrosplenial cortex.
a-c. The egocentric reference frame. Landmarks and boundaries have distinct egocentric relationships relative to the agent as it moves through space. While paused, the “Cheerio” sign is to the left of the rat and the boundary is in front of the animal. As the animal moves along its future path (gray dashed line), the sign will move behind the animal and the boundary will be to its left. b. Egocentric self-motion sensitivity in RSC,,. Left, schematic of change in angular heading (ΔΘ) and distance (Δd) as the agent moves along a trajectory through space (gray line). Displacement is egocentric because it is measured as the difference in these variables between self-position 2 and self-position 1 (pink and blue dots). Right top, a schematic neuron with a linear relationship between firing rate and speed. Right bottom, a schematic neuron with a linear relationship between firing rate and both clockwise and counterclockwise angular speed. c. Egocentric boundary coding of RSC,. Top left, in background, trajectory plot with locations of spikes for a single neuron color coded by the rat’s head direction according to the legend on left. For a single spike in the foreground (enlarged in orange), the boundaries are mapped relative to the animal’s current heading (single and multiple spikes are top right and bottom left, respectively). Bottom right, an egocentric boundary ratemap for this RSC neuron shows it is activated when any environmental boundary is to the right of the animal and slightly ahead of it. d-f. The allocentric reference frame. The agent has a distinct spatial position (blue circle) and heading (black arrow) relative to the landmarks and boundaries that define the external environment. e. Two RSC neurons (rows) with significant allocentric head direction modulation,,. Left plots depict polar tuning plots. Right plots are the trajectory of the animal (gray) and with positions at the time of spikes indicated by colored circles. Colors correspond to the head direction of the animal at the time of the spike colored according to the legend above. The bottom neuron is sensitive to both the egocentric position of boundaries (see trajectory plot) and the allocentric heading of the animal simultaneously. f. Activation of three RSC neurons (rows) during open field exploration is spatially reliable but does not resemble HPC place cells,. Left column, ratemap for the full session. Middle and right column, first and second half of the session, respectively. g-i. The route-centric reference frame. g. Animal position is considered relative to the space within a route, regardless of the route’s position in the external world. h. Mean firing rates of two RSC neurons that exhibit complex firing patterns within a plus-shaped route schematized on bottom left. Each activation pattern possesses repetitive firing peaks (fit in pink line) that map onto the same track segments within a local topology (in 4g the bottom right graded pink schematic) and an overarching gain modulation (fit in blue line) that simultaneously tracks position within the full track space reflecting the global topology (in 4g the bottom left graded blue schematic). i. RSC (top left) and HPC (top right) putative principal neurons possess spatially reliable firing patterns during track running that can be used to decode spatial position within a route,,. In freely moving animals, RSC neurons exhibit non-zero firing patterns along the majority of the full track space, while HPC neurons tend to exhibit singular activity peaks with negligible activity in all other locations.
Figure 5.
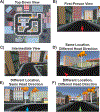
Figure 5.. The viewpoint and reference frame problem.
There are many features that could be informative to navigating in a complex environment, and multiple frames of reference that navigators can shift between. A) The top-down (largely allocentric) view of locations as marked at the ends of the colored arrows. B) The first-person (largely egocentric) view from one location and head direction (red arrow). C) An intermediate view between the top-down view in A and first-person view in B (red arrow). D) The same location as B and C but a different head direction. E) A different location (blue arrow) but same head direction as the red arrow in A. F) A different location and different head direction (green arrow), although the original location (red arrow) is visible. As a navigator moves through the environment, predictive coding provides information about what they will see at different locations and headings, with the potential to compare the prediction with the visual stimulus. Landmarks of various sizes and permanence are seen throughout the environment, with varying egocentric distances and directions. We note that all views of an environment are technically egocentric, even top-down views. However, those such as in panel A will facilitate building an allocentric representation, whereas first-person views tend to facilitate egocentric representations.
Figure 6.
Figure 6.. Predictive sequence correlates hypothesized from known spatial reference frame responses.
A. Top: A continuous trajectory running task, requires rats to learn spatial routes with repetitive egocentrically defined (left vs right) movement sequences(inspired by Alexander et al., 20178). Middle: There are known RSC and HPC neuron responses to spatial trajectory running. Three example types of RSC neurons modulated by allocentric, egocentric, and route reference frames. RSC 1 changes response amplitude to each movement position throughout the route’s progression. RSC 2 simply responds to all rightward turns. RSC 3 contains a conjunctive response to conjunctions of route progress and turn type sequences, firing for left-right turn combinations with amplitude modulations to route progress (i.e. increased amplitude at second placement of left-right transition). Bottom: Different CA1 place cells respond to each position along the route. B. Top: A discrete object sequence task (inspired by Powell et al., 2017) requires the rat to sample same-object pairs in a sequence, making arbitrary left/right ‘choices’ at each stage. For simplicity here, the depicted rat uses sequentially structured movements for each sample trial, consisting of leftward glances (gray, upward dashes) and rightward movement selections (red, downward arrows). Discrete event responses for RSC and HPC neurons. Middle: Hypothesized object-sequence responses for RSC neurons following properties observed from the corresponding spatial reference frame representation. RSC 1 changes response amplitude to each event within the sequence reflecting the temporal progression of object encounters. RSC 2 responds to egocentric rightward movements or possibly the second of two movement directions within a trial sequence, since rightward selections follow leftward glances for each trial depicted here. RSC 3 responds to right turn responses that follow leftward glances and increases response amplitude to repeated occurrences of left-right trial structure within the overall sequence of object pair presentations. We note that RSC might also conjunctively encode the identity of each object based on inputs from the visual cortex. Bottom: Inspired by HPC responses to sequences of odors, here different HPC neurons respond to each object within the sequence. RSC = retrosplenial cortex, HPC = hippocampus.
Figure 7.
Figure 7.. Hypothetical example of how consolidation might alter the role of RSC in a predictive coding hierarchy.
A) Prior to consolidation, RSC is insufficient for a functioning predictive coding hierarchy, necessitating HPC involvement for high resolution binding of stimulus and event features (left); eventually, reliable representations of stimulus sequences encoded in RSC may be sufficient to reactivate transient representations represented by neuronal populations in early sensory regions (right). B) An example of an experimental task to elicit (A); stimuli are displayed in sequence while participants make perceptual judgments (“Indoor/Outdoor?”) unrelated to the underlying temporal structure (left). Pairs of stimuli that are always shown one after the other in a fixed order are stored and consolidated over a period of time after encoding (middle). During a two-alternative forced choice recollection task, seeing one member of a pair is sufficient to predict what one of the alternatives will be (“Which pet?”) and prepare for a behavior response. Together, this figure illustrates how RSC might serve as a high-level prediction node for well-established memories. HPC = hippocampus, RSC = retrosplenial cortex.
Figure 8.
Figure 8.. Theta-phase coordination between Hippocampus and Retrosplenial cortex.
A. Two consecutive theta-cycles (light gray) are depicted for RSC (top), SUB (middle) and CA1 (bottom), which align across all three regions. Gamma rhythm patterning and peak spike probabilities in RSC follow corresponding CA1 dynamics. In RSC (top), distinct theta locations for peak low and high gamma amplitudes are found at ascending and descending phases respectively, which follows similar CA1 (bottom) peak low-to-high gamma transitions found at theta troughs. Peak SUB (purple bars; middle) and HPC spiking (blue bars; bottom) occurs at theta-troughs, whereas peak RSC spiking follows, at ascending theta,. Counter to the predicted theta-phase from general spiking, RSC egocentric boundary cells (yellow bars, top), SUB object vector trace cells (green bars, middle), and CA1 odor-selective cells are found to shift spiking to descending early phases during specific behavioral conditions,,. B. Spike sequences within individual theta phases start with SUB and RSC responses that are linked to the objects and structures within an environment. Peak SUB and HPC spike probabilities follow, and general RSC spike probabilities conclude the sequence. RSC = retrosplenial cortex, SUB = subiculum, EBC = egocentric boundary cell, VTC = vector trace cell, OSC = object-selective cell.

References

    1. Sporns O, Honey CJ & Kötter R. Identification and Classification of Hubs in Brain Networks. PLOS ONE 2, e1049 (2007). - PMC - PubMed
    1. Sugar J, Witter MP, van Strien NM & Cappaert NLM The retrosplenial cortex: intrinsic connectivity and connections with the (para)hippocampal region in the rat. An interactive connectome. Front. Neuroinformatics 5, 7 (2011). - PMC - PubMed
    1. van Groen T. & Michael Wyss J. Connections of the retrosplenial granular a cortex in the rat. J. Comp. Neurol 300, 593–606 (1990). - PubMed
    1. Van Groen T. & Wyss JM Connections of the retrosplenial granular b cortex in the rat. J. Comp. Neurol 463, 249–263 (2003). - PubMed
    1. Wyass JM & Van Groen T. Connections between the retrosplenial cortex and the hippocampal formation in the rat: A review. Hippocampus 2, 1–11 (1992). - PubMed

Publication types