. 2023 Apr 25;100(17):e1737-e1749.
doi: 10.1212/WNL.0000000000201670. Epub 2022 Dec 2.

Interrater Reliability of Expert Electroencephalographers Identifying Seizures and Rhythmic and Periodic Patterns in EEGs

Affiliations

Interrater Reliability of Expert Electroencephalographers Identifying Seizures and Rhythmic and Periodic Patterns in EEGs

Jin Jing et al. Neurology. .

Abstract

Background and objectives: The validity of brain monitoring using electroencephalography (EEG), particularly to guide care in patients with acute or critical illness, requires that experts can reliably identify seizures and other potentially harmful rhythmic and periodic brain activity, collectively referred to as "ictal-interictal-injury continuum" (IIIC). Previous interrater reliability (IRR) studies are limited by small samples and selection bias. This study was conducted to assess the reliability of experts in identifying IIIC.

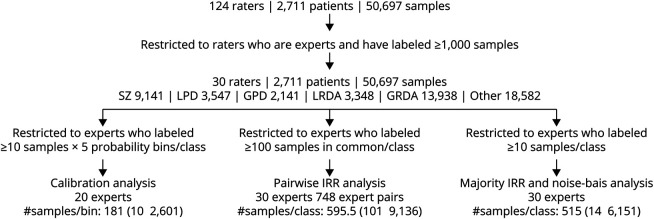
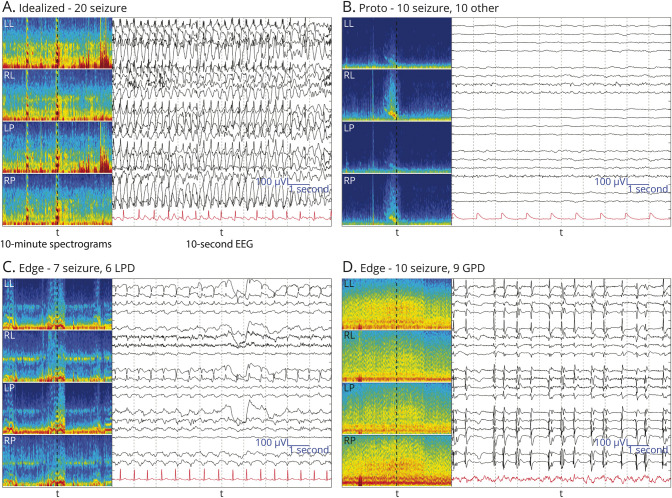
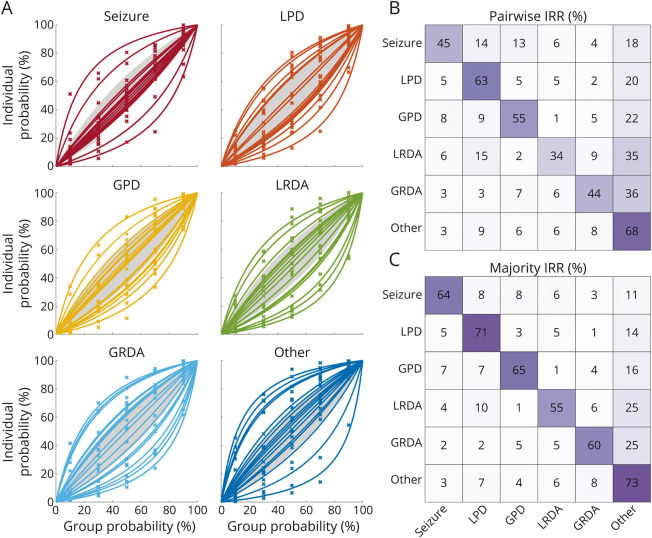
Methods: This prospective analysis included 30 experts with subspecialty clinical neurophysiology training from 18 institutions. Experts independently scored varying numbers of ten-second EEG segments as "seizure (SZ)," "lateralized periodic discharges (LPDs)," "generalized periodic discharges (GPDs)," "lateralized rhythmic delta activity (LRDA)," "generalized rhythmic delta activity (GRDA)," or "other." EEGs were performed for clinical indications at Massachusetts General Hospital between 2006 and 2020. Primary outcome measures were pairwise IRR (average percent agreement [PA] between pairs of experts) and majority IRR (average PA with group consensus) for each class and beyond chance agreement (κ). Secondary outcomes were calibration of expert scoring to group consensus, and latent trait analysis to investigate contributions of bias and noise to scoring variability.

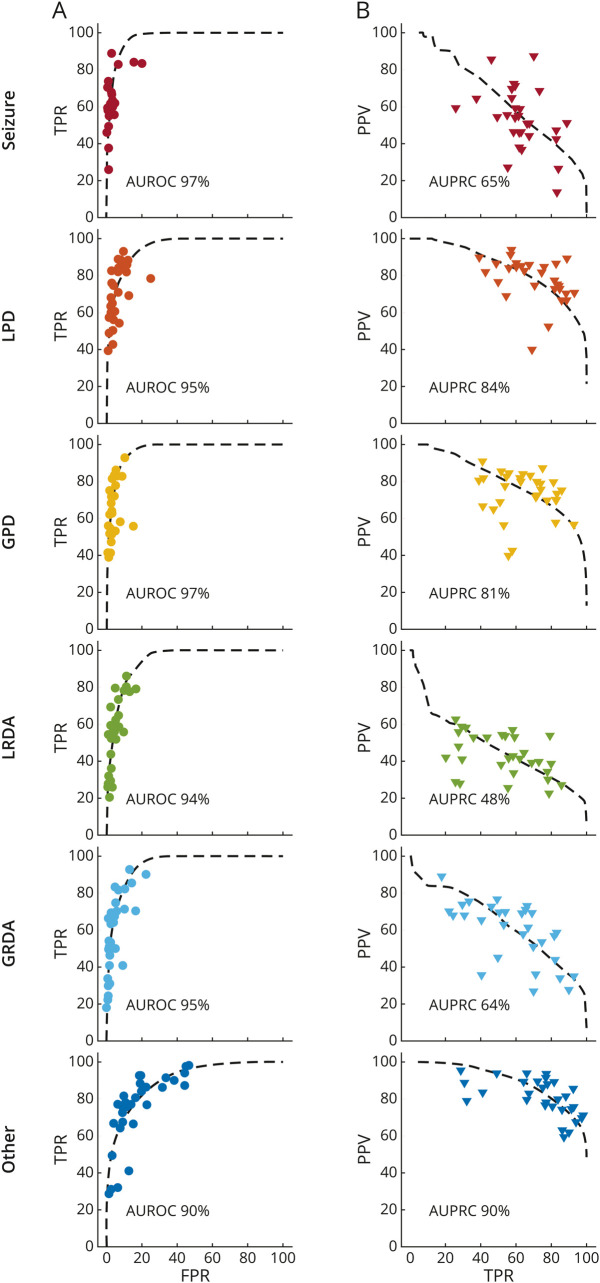
Results: Among 2,711 EEGs, 49% were from women, and the median (IQR) age was 55 (41) years. In total, experts scored 50,697 EEG segments; the median [range] number scored by each expert was 6,287.5 [1,002, 45,267]. Overall pairwise IRR was moderate (PA 52%, κ 42%), and majority IRR was substantial (PA 65%, κ 61%). Noise-bias analysis demonstrated that a single underlying receiver operating curve can account for most variation in experts' false-positive vs true-positive characteristics (median [range] of variance explained ([Formula: see text]): 95 [93, 98]%) and for most variation in experts' precision vs sensitivity characteristics ([Formula: see text]: 75 [59, 89]%). Thus, variation between experts is mostly attributable not to differences in expertise but rather to variation in decision thresholds.

Discussion: Our results provide precise estimates of expert reliability from a large and diverse sample and a parsimonious theory to explain the origin of disagreements between experts. The results also establish a standard for how well an automated IIIC classifier must perform to match experts.

Classification of evidence: This study provides Class II evidence that an independent expert review reliably identifies ictal-interictal injury continuum patterns on EEG compared with expert consensus.


Conflict of interest statement

The authors report no disclosures relevant to the manuscript. Go to Neurology.org/N for full disclosures.

Figures

Figure 1
Figure 1. Scoring Flowchart
In total, 124 raters (30 experts and 94 technicians or trainees) scored 50,697 segments from 2,711 patients' EEG recordings. The number of segments among these with consensus labels of seizure (SZ), lateralized or generalized periodic discharges (LPDs, GPDs), lateralized or generalized rhythmic delta activity (LRDA, GRDA), or none of those patterns (“other”) are indicated. Constraints applied to ensure statistical stability for calibration analysis, pairwise interrater reliability (IRR) analysis, and majority IRR analysis are shown, together with the resulting number of experts' data, and the number of segments is shown. For calibration analysis, the number of segments available is expressed as the median [minimum, maximum] number of segments per probability bin. For pairwise and majority IRR, the number of segments is given as the median [minimum, maximum] number of segments per pattern class. For pairwise IRR analysis, the number of expert pairs among the 30 experts with sufficient jointly scored data for analysis is also shown.
Figure 2
Figure 2. Selected EEG Examples for Class Seizure
(A) Example of idealized form of seizure (SZ) with uniform expert agreement. (B) Protopattern or partially formed pattern. About half of raters labeled these SZ and the other half labeled “other.” (C, D) are edge cases (about half of raters labeled these SZ and half labeled them another IIIC pattern). For (B), there is rhythmic delta activity with some admixed sharp discharges within the 10-second raw EEG, and the spectrogram shows that this segment may belong to the tail end of a SZ; thus, disagreement between SZ and “other” makes sense. (C) 2 Hz lateralized periodic discharges (LPDs) showing an evolution with increasing amplitude evolving underlying rhythmic activity, a pattern between LPDs and the beginning of a SZ, an edge case. Panel D shows abundant generalized periodic discharges (GPDs) on top of a suppressed background with a frequency of 1–2 Hz. The average over the 10 seconds is close to 1.5 Hz, suggesting a SZ, another edge case.
Figure 3
Figure 3. Interrater Reliability Analysis
(A) Calibration curves: segments were binned for each of the 6 classes according to the percentage of experts who classified them as that class. Bins were chosen to be 0%–20%, 20%–40%, 40%–60%, 60%–80%, and 80%–100%. Calibration curves were calculated for each expert, and each pattern class based on the percentage of segments within each bin that the expert classified as belonging to that class, producing a set of 5 percentages (one for each bin). A single parameter curve (see eAppendix 5 in the Supplement, links.lww.com/WNL/C519) was fit to these percentages to characterize the experts' tendency to overcall and undercall. Experts with calibration curves >20% above the diagonal (above the shaded region) are considered overcallers. Experts with calibration curves >20% below the diagonal (below the shaded region) are considered undercallers. (B) and (C) Confusion matrices: these heatmaps show a pattern of disagreement between experts for IIIC (and “other”) classes. These are presented as conditional probabilities (between 0% and 100%). For the pairwise IRR confusion matrix (panel B), the number in each square is the average (across pairs of experts) probability that a rater labels a pattern A1 (the x-axis) if another rater had labeled it pattern A2 (the y-axis). The sum of values within each row is 100%. The matrices are not symmetric, because P(A1| A2) does not equal the P(A2| A1), because there are differences in the underlying prevalence of the patterns. The diagonal is the “pattern” pairwise agreement shown in eTable 4 in the Supplement, links.lww.com/WNL/C519. For the majority IRR confusion matrix (panel C), the numbers are the average (across experts) probability that a rater labels a segment pattern A1 (x-axis) if the majority label for that segment is A2. GPD = generalized periodic discharges; GRDA = generalized rhythmic delta activity; IRR = interrater reliability; LPD = lateralized periodic discharges; LRDA = lateralized rhythmic delta activity.
Figure 4
Figure 4. Bias vs Noise Analysis
We calculated 3 performance metrics for each expert based on the agreement of their scores with the consensus score for each EEG segment: The false-positive rate (FPR): the percentage of segments that do not belong to a given class that an expert incorrectly scores as belonging to the class; true-positive rate (TPR; aka sensitivity), the percentage of segments within a class that the expert correctly scores as belonging to the class; and the positive predictive value (PPV; aka precision), the percentage of segments scored by an expert as belonging to a given class that do in fact belong to that class. In (A), we plot TPR vs FPR. A receiver operating characteristic (ROC) curve from the SSIT (similar expertise, individualized thresholds) model is fit to experts' data for each IIIC category, shown as a dashed black line. The area under the ROC is shown in each plot. In (B), we plot the PPV vs TPR. A precision recall curve (PRC) is fit to experts' data for each IIIC category. The area under the PRC is shown in each plot. The goodness of fit for ROC and PRC curves is calculated using R2 values (see text).

Comment in

References

    1. Hill CE, Blank LJ, Thibault D, et al. . Continuous EEG is associated with favorable hospitalization outcomes for critically ill patients. Neurology 2019;92(1):e9–e18. doi: 10.1212/WNL.0000000000006689 - DOI - PMC - PubMed
    1. Westover MB, Gururangan K, Markert MS, et al. . Diagnostic value of electroencephalography with ten electrodes in critically ill patients. Neurocrit Care 2020;33(2):479-490. doi: 10.1007/s12028-019-00911-4 - DOI - PMC - PubMed
    1. Zafar SF, Subramaniam T, Osman G, Herlopian A, Struck AF. Electrographic seizures and ictal-interictal continuum (IIC) patterns in critically ill patients. Epilepsy Behav EB 2020;106:107037. doi: 10.1016/j.yebeh.2020.107037 - DOI - PubMed
    1. Westover MB, Shafi MM, Bianchi MT, et al. . The probability of seizures during EEG monitoring in critically ill adults. Clin Neurophysiol Off J Int Fed Clin Neurophysiol. 2015;126(3):463-471. doi: 10.1016/j.clinph.2014.05.037 - DOI - PMC - PubMed
    1. Claassen J, Jetté N, Chum F, et al. . Electrographic seizures and periodic discharges after intracerebral hemorrhage. Neurology 2007;69(13):1356-1365. doi: 10.1212/01.wnl.0000281664.02615.6c - DOI - PubMed

Publication types