. 2022 Dec 2;13(1):7428.
doi: 10.1038/s41467-022-34055-5.

Dynamic spatiotemporal determinants modulate GPCR:G protein coupling selectivity and promiscuity

Affiliations

Dynamic spatiotemporal determinants modulate GPCR:G protein coupling selectivity and promiscuity

Manbir Sandhu et al. Nat Commun. .

Abstract

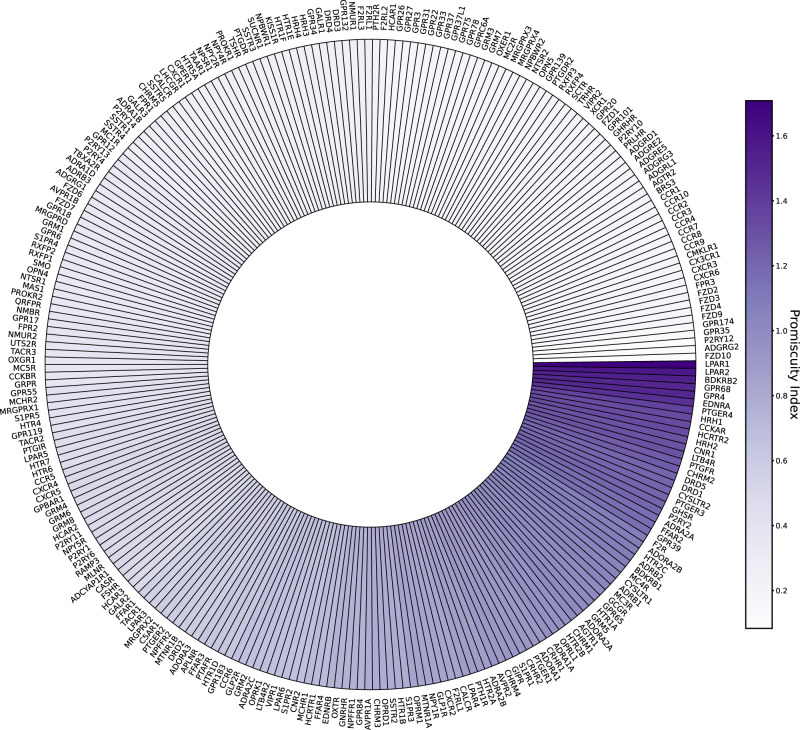
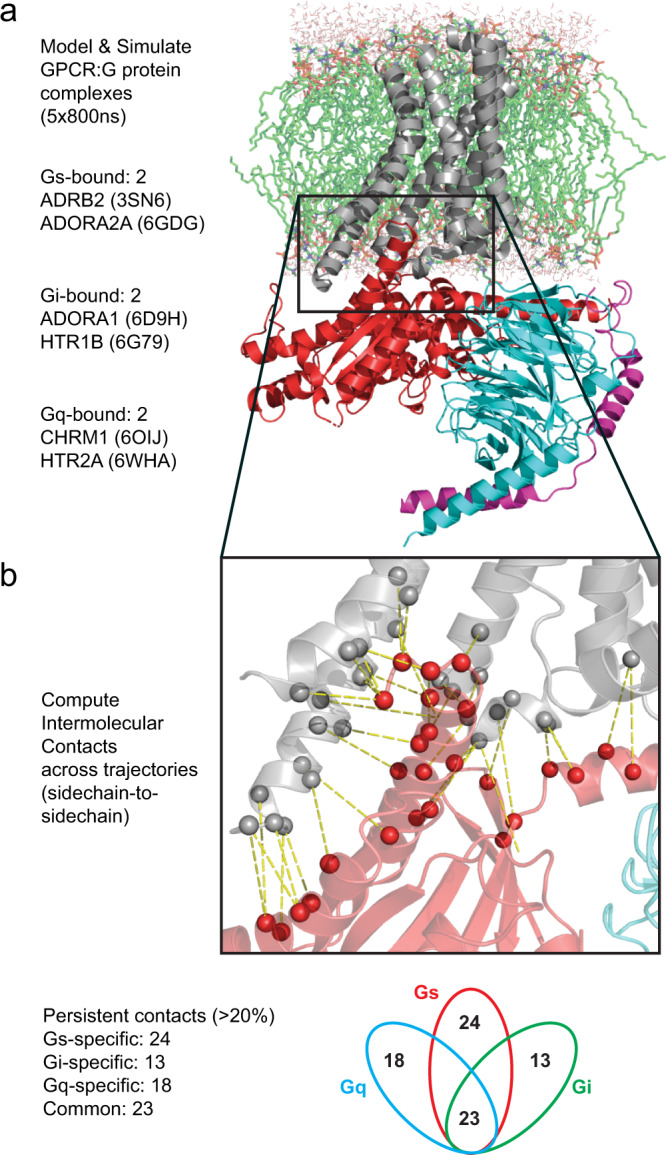
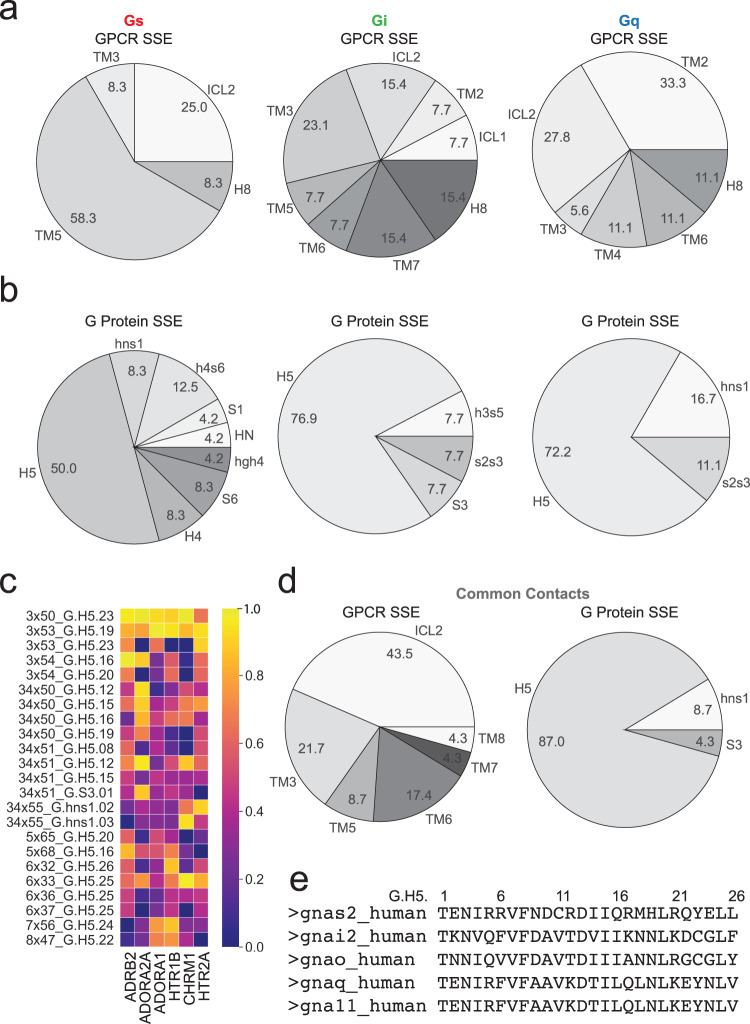
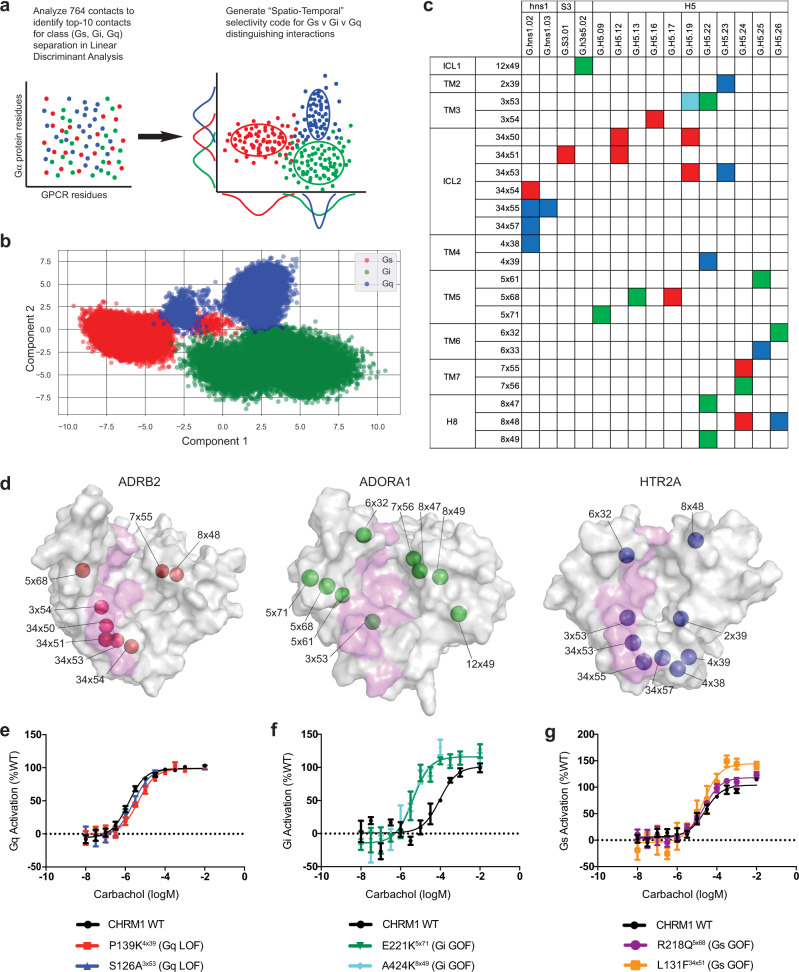
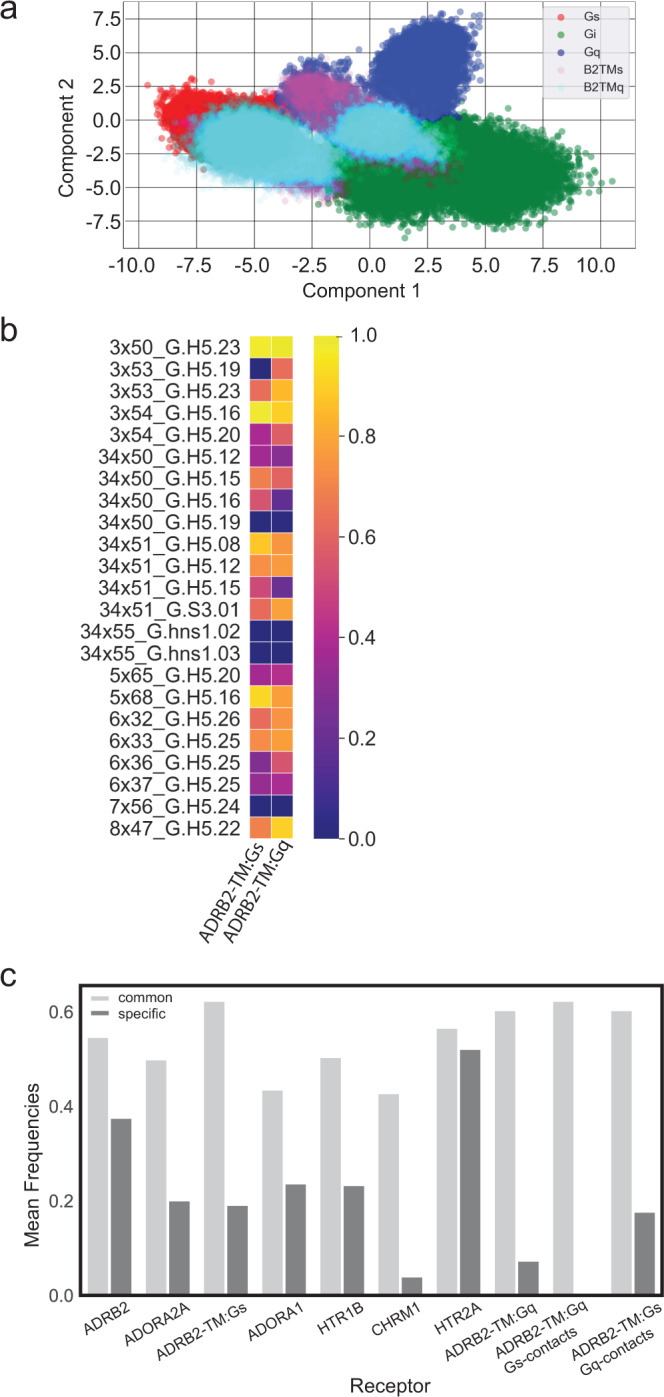
Recent studies have shown that G protein coupled receptors (GPCRs) show selective and promiscuous coupling to different Gα protein subfamilies and yet the mechanisms of the range of coupling preferences remain unclear. Here, we use Molecular Dynamics (MD) simulations on ten GPCR:G protein complexes and show that the location (spatial) and duration (temporal) of intermolecular contacts at the GPCR:Gα protein interface play a critical role in how GPCRs selectively interact with G proteins. We identify that some GPCR:G protein interface contacts are common across Gα subfamilies and others specific to Gα subfamilies. Using large scale data analysis techniques on the MD simulation snapshots we derive a spatio-temporal code for contacts that confer G protein selective coupling and validated these contacts using G protein activation BRET assays. Our results demonstrate that promiscuous GPCRs show persistent sampling of the common contacts more than G protein specific contacts. These findings suggest that GPCRs maintain contact with G proteins through a common central interface, while the selectivity comes from G protein specific contacts at the periphery of the interface.


Conflict of interest statement

The authors declare no competing interests.

Figures

Fig. 1
Fig. 1. GPCRs exhibit a spectrum of coupling strength to G-proteins; from selective interaction with a single G protein to promiscuous coupling across G protein subfamilies.
GPCRs studied in Inoue et al. and Avet et al. along with those annotated in the IUPHAR database were compared to assess GPCR coupling selectivity across major G protein subfamilies. We calculated a “promiscuity index” and ranked GPCRs based on this index, taking into consideration the strength of evidence for coupling based on the type of assay or reporting used. The circularized bar plot displays the spectrum of promiscuity as denoted by the color heatmap at the right of the figure. Source data are provided as Supplementary Data 1.
Fig. 2
Fig. 2. Workflow for extracting the spatiotemporal heat map for the residue contacts in GPCR:G protein interface.
a We used six crystal and cryo-EM structures of GPCR:G protein complexes to model the interactions of two Gs-coupled, two Gi-coupled, and two Gq-coupled GPCR:G protein pairs. Atomistic MD simulations were performed as five replicates, each replicate extended to >800 ns of simulation time for each of these GPCR:G protein complexes. The last 200 ns window of each replicate was combined into a 1 μs ensemble trajectory used for further analysis. Source data are hosted at GPCRmd.org. b The sidechain-to-sidechain intermolecular contacts between GPCR and Gα proteins were computed for each of the six complexes using the get_contacts.py method. We obtained 764 contacts for analysis and identified “persistent contacts” as those sampled for >20% frequency in one or both systems representing each class (Gs, Gi, Gq). Among these persistent contacts, we identified a subset that appear uniquely in interactions of one Gα protein family (“specific contacts”) and those which are found across all of the Gα protein subfamilies (Gs, Gi, and Gq; “common contacts”).
Fig. 3
Fig. 3. Unique signatures of GPCR and G protein structural regions involved in contacts from different G protein families.
The location of the G protein family “specific contacts” mapped to the various GPCR and G protein secondary structural elements (SSE). Source data for all plots are provided as Supplementary Data 2. a The percentage of GPCR:G protein contacts specific to the Gs (left), Gi (center), and Gq (right) interaction arising from each SSE of the GPCR is shown. b Similar pie chart displaying the percentage of contacts from specific SSEs of the G proteins. The residue numbering system used is from the “common G protein numbering” scheme developed by Flock et al.. c The temporal frequency of each GPCR:G protein “common contact” is displayed, indicating the frequency of each contact for each GPCR system. d The amino acids found among “common contacts” are shown in the pie charts, labeled by the SSE in which they are found. e FASTA sequence alignment of G protein C-terminal H5 helix for G proteins used in MD simulations.
Fig. 4
Fig. 4. Identifying G protein selectivity determinants using linear discriminant analysis of spatiotemporally resolved GPCR:G protein contacts.
a GPCR:Gα protein contacts from each frame of the MD simulations were one-hot encoded into a binarized interaction fingerprint and used to train a linear discriminant classifier and identify features (intermolecular contact pairs) that distinguish Gs, Gi, and Gq interactions. b The projection of each frame of the MD simulations, colored by G protein interaction (red, Gs; green, Gi; blue, Gq) are shown projected into the two-dimensional deconvoluted space (Component 1, Component 2) determined by the linear discriminant analysis. Source data are provided as Supplementary Data 4. c The top ten pairwise contacts which contribute highly to the interaction signature of each G protein family are displayed in the spatio-temporal barcode as the GPCR (rows) and G protein (columns) residues that are found in the distinguishing pairwise contacts for each G protein interaction (red, Gs; green, Gi; blue, Gq). One contact (‘3×53:G.H5.19’) is shared among Gi and Gq type interactions, and is colored in “cyan.” d GPCR residues involved in G protein selectivity are displayed on the intracellular surface of a Gs (ADRB2, red spheres, left), Gi (ADORA1, green spheres, center), and Gq-coupled (HTR2A, blue spheres, right) GPCR. Residues that are found in “common contacts” across G protein subfamilies are shown as a magenta-colored surface. e BRET-based Gq-activation sensor was used to measure CHRM1 (WT, P139K and S126A mutants) activation of Gq heterotrimers in the presence of carbachol (n = 3 biologically independent samples, data are presented as mean ± SD for each concentration). f BRET-based Gi-activation sensor was used to measure CHRM1 (WT, E221K, and A424K mutants) activation of Gi heterotrimers in the presence of carbachol (n = 3 biologically independent samples, data are presented as mean  ± SD for each concentration). g BRET-based EPAC sensor was used to measure CHRM1 (WT, P139K and S126A mutants) activation of Gs signaling and cAMP accumulation in the presence of carbachol and 500 nM of Gq-protein inhibitor YM-254890 (n = 3 biologically independent samples, data are presented as mean ± SD for each concentration).
Fig. 5
Fig. 5. The GPCR:G protein contact landscape of promiscuous GPCRs.
a Analysis of promiscuous GPCRs in the framework of the LDA model trained on data from the original six structurally resolved GPCR:G protein complexes. The promiscuous GPCR:G protein interactions are plotted using the feature weightings used to compute Component 1 and Component 2 from the LDA analysis performed in Fig. 4. The promiscuous GPCRs are distinguished by color and denoted in the legend: ADRB2-TM with Gs (“B2TMs”, magenta), ADRB2-TM with Gq (“B2TMq”, cyan). The plotting of these promiscuous receptor interactions lie predominantly in the common space of the LDA model, suggesting the promiscuous receptor interactions with G proteins are represented by mostly non-distinguishing contacts. b Heatmap of contact frequencies for “common contacts” sampled in the promiscuous ADRB2-TM receptor. Source data are provided as Supplementary Data 3. c The promiscuous GPCRs studied here show stronger sampling (measured by mean frequency per residue) within the subspace of “common contacts” pairs (light gray), and less frequent sampling of G protein family “specific contact” pairs sampled within the G protein family to which they are coupled (medium gray). For the promiscuous ADRB2-TM, we calculated the mean frequency of subfamily specific contacts for the G protein-coupled within the simulation (ADRB2-TM:Gq, ADRB2-TM:Gs), and the mean frequency of subfamily specific contacts for the opposite G protein family, while coupled to one of the G proteins (ADRB2-TM:Gq with Gs-contacts, ADRB2-TM:Gs with Gq-contacts).

References

    1. Armstrong JF, et al. The IUPHAR/BPS Guide to PHARMACOLOGY in 2020: extending immunopharmacology content and introducing the IUPHAR/MMV Guide to MALARIA PHARMACOLOGY. Nucleic Acids Res. 2019;48:D1006–D1021. - PMC - PubMed
    1. Masuho I, et al. Distinct profiles of functional discrimination among G proteins determine the actions of G protein-coupled receptors. Sci. Signal. 2015;8:ra123. doi: 10.1126/scisignal.aab4068. - DOI - PMC - PubMed
    1. Wenzel-Seifert K, Seifert R. Molecular analysis of beta(2)-adrenoceptor coupling to G(s)-, G(i)-, and G(q)-proteins. Mol. Pharm. 2000;58:954–66. doi: 10.1124/mol.58.5.954. - DOI - PubMed
    1. Stallaert W, Dorn JF, van der Westhuizen E, Audet M, Bouvier M. Impedance responses reveal β2-adrenergic receptor signaling pluridimensionality and allow classification of ligands with distinct signaling profiles. PLoS ONE. 2012;7:e29420. doi: 10.1371/journal.pone.0029420. - DOI - PMC - PubMed
    1. Malik RU, et al. Detection of G protein-selective G protein-coupled receptor (GPCR) conformations in live cells. J. Biol. Chem. 2013;288:17167–78. doi: 10.1074/jbc.M113.464065. - DOI - PMC - PubMed

Publication types