. 2022 Dec 2;13(1):7442.
doi: 10.1038/s41467-022-35047-1.

Near-critical spreading of droplets

Affiliations

Near-critical spreading of droplets

Raphael Saiseau et al. Nat Commun. .

Abstract

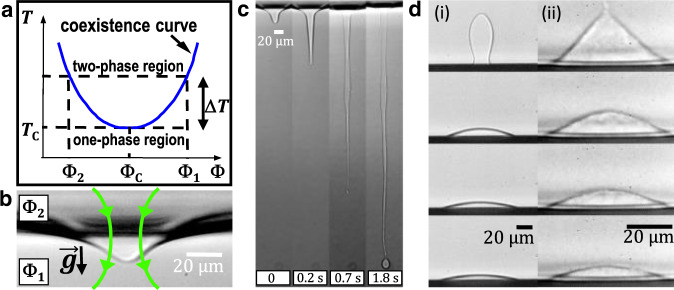
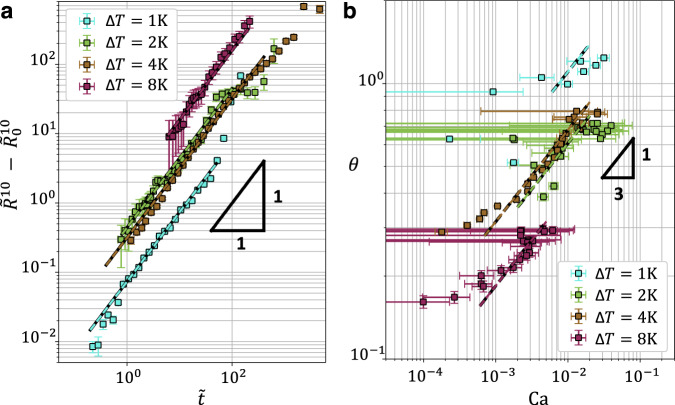
We study the spreading of droplets in a near-critical phase-separated liquid mixture, using a combination of experiments, lubrication theory and finite-element numerical simulations. The classical Tanner's law describing the spreading of viscous droplets is robustly verified when the critical temperature is neared. Furthermore, the microscopic cut-off length scale emerging in this law is obtained as a single free parameter for each given temperature. In total-wetting conditions, this length is interpreted as the thickness of the thin precursor film present ahead of the apparent contact line. The collapse of the different evolutions onto a single Tanner-like master curve demonstrates the universality of viscous spreading before entering in the fluctuation-dominated regime. Finally, our results reveal a counter-intuitive and sharp thinning of the precursor film when approaching the critical temperature, which is attributed to the vanishing spreading parameter at the critical point.


Conflict of interest statement

The authors declare no competing interests.

Figures

Fig. 1
Fig. 1. Experimental system.
a Schematic phase diagram of the used binary liquid mixture (i.e., a micellar phase of the microemulsion, see Supplementary Method 1), where T is the temperature, Φ the micelle concentration, and Tc and Φc the coordinates of the critical point. b Radiation pressure-induced optical bending of the interface separating the two coexisting phases at T > Tc, where the downward laser beam is represented by the arrows. c Image sequence of the optical jetting instability with drop formation at the tip. d Image sequences of a less-dense-phase droplet of concentration Φ2 coalescing and spreading over a borosilicate substrate placed at the bottom of the cell, when surrounded by the denser phase of concentration Φ1. The temperature distances to the critical point Tc, the initial droplet volumes, and the time intervals between images are: (i) ΔT = 8 K, Vini = 30.3 pL, dt = 3 s; (ii) ΔT = 1 K, Vini = 21.5 pL, dt = 20 s.
Fig. 2
Fig. 2. Raw data: profiles and main observables.
a Rescaled droplet volume V/V0 as a function of the rescaled time 1 − t/tf, with V0 the initial volumes and tf the evaporation times of all droplets, for four different distances to the critical temperature ΔT. The dashed line indicates the empirical power law (1t/tf)1.77. Inset: corresponding raw data. b Contact radius, divided by its initial value R0, as a function of time for the same temperatures. The 1/10 power-law exponent of Tanner’s law is indicated with a slope triangle. Inset: corresponding raw data. Error bars on droplet volume are derived from the errors on droplet height and contact radius, which are described in Supplementary Method 2. c, d Droplet profiles at different times obtained from experiments (symbols) and compared to the numerical solutions of Eq. (1) (dashed/dotted lines) for ΔT = 8 K (c) and ΔT = 4 K (d). Source data are provided as a Source Data file.
Fig. 3
Fig. 3. Rescaled data: Tanner and Cox–Voinov laws.
a Rescaled contact radius R~10R0~10 as a function of rescaled time t~, for various temperatures ΔT as indicated. The dashed lines indicate fits Eq. (4), with as a free parameter for each temperature. b Contact angle θ as a function of capillary number Ca, for various temperatures ΔT as indicated. The dashed lines indicate the predictions of Eq. (2), using the values obtained from the fits in a. Error bars on rescaled radius and contact angle are obtained using the errors on droplet height and contact radius described in Supplementary Method 2. Source data are provided as a Source Data file.
Fig. 4
Fig. 4. Near-critical Tanner masterplot and precursor-film thickness.
a Dimensionless Tanner master curve, including the experiments at all temperatures. The dashed line corresponds to Eq. (4). The values of the logarithmic factor were first obtained by fitting the individual experimental data in Fig. 3a to Eq. (4). Error bars on rescaled radius are obtained using the errors on droplet height (through volume derivation) and contact radius described in Supplementary Method 2. b Extracted precursor-film thickness ϵ as a function of the temperature distance ΔT to the critical point, as obtained by fitting individual experimental profiles to numerical solutions of Eq. (1) (see Fig. 2c and d). The dashed line indicates the empirical power law ϵ=aΔT/Tc2.69 with a = 5.54 mm. Error bars on precursor-film thickness correspond to the maximum acceptable values to fit numerical profiles with the experimental ones. Source data are provided as a Source Data file.

References

    1. De Gennes PG. Wetting: statics and dynamics. Rev. Mod. Phys. 1985;57:827. doi: 10.1103/RevModPhys.57.827. - DOI
    1. Oron A, Davis SH, Bankoff SG. Long-scale evolution of thin liquid films. Rev. Mod. Phys. 1997;69:931. doi: 10.1103/RevModPhys.69.931. - DOI
    1. Bonn D, Eggers J, Indekeu J, Meunier J, Rolley E. Wetting and spreading. Rev. Mod. Phys. 2009;81:739. doi: 10.1103/RevModPhys.81.739. - DOI
    1. Tanner, L. The spreading of silicone oil drops on horizontal surfaces. J. Phys. D12, 1473 (1979).
    1. Huh C, Scriven LE. Hydrodynamic model of steady movement of a solid/liquid/fluid contact line. J. Colloid Interface Sci. 1971;35:85–101. doi: 10.1016/0021-9797(71)90188-3. - DOI