. 2022 Dec 2;13(1):7446.
doi: 10.1038/s41467-022-35093-9.

Discrete LAT condensates encode antigen information from single pMHC:TCR binding events

Affiliations

Discrete LAT condensates encode antigen information from single pMHC:TCR binding events

Darren B McAffee et al. Nat Commun. .

Abstract

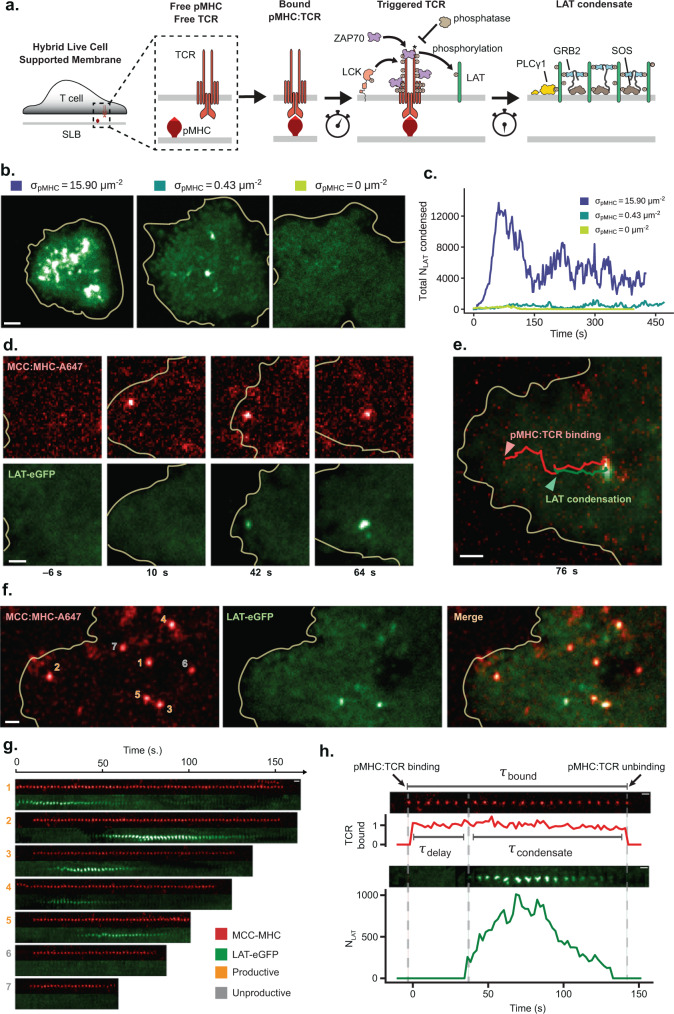
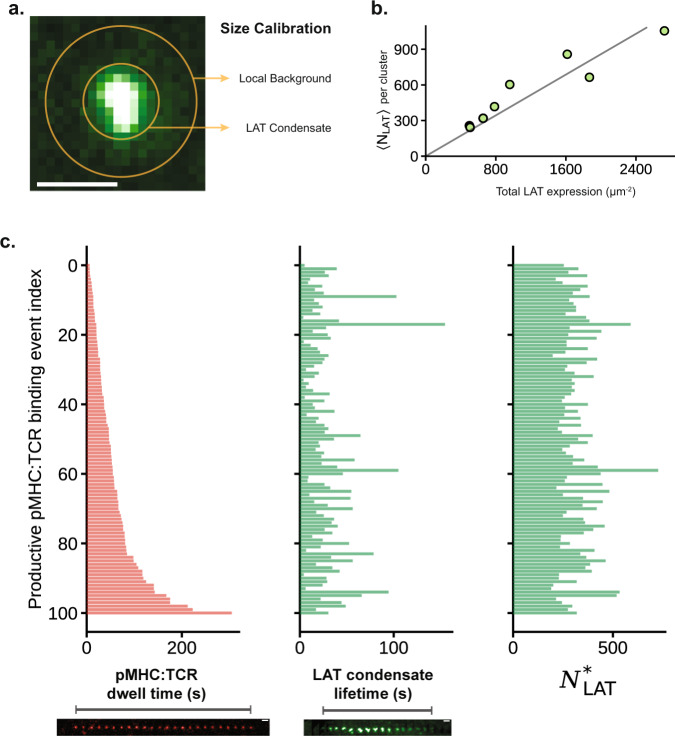
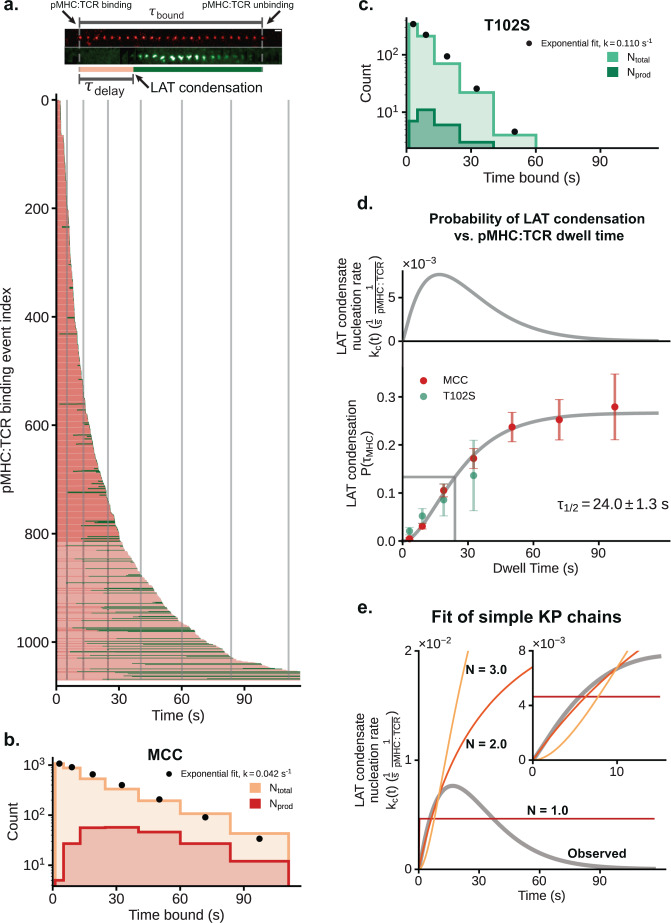
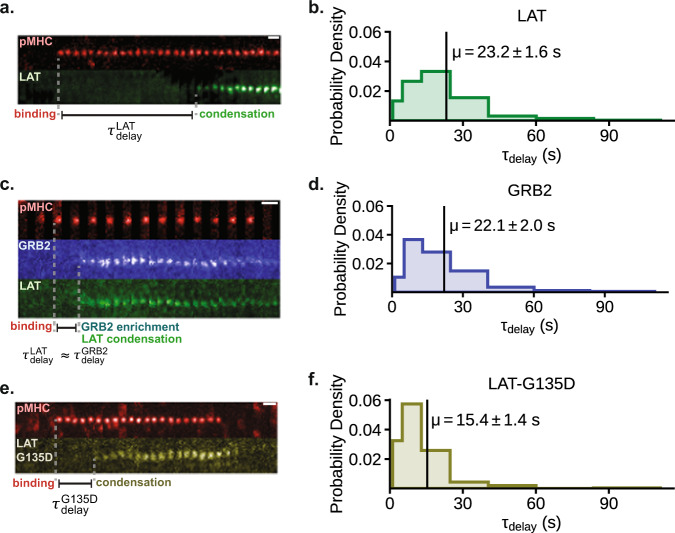
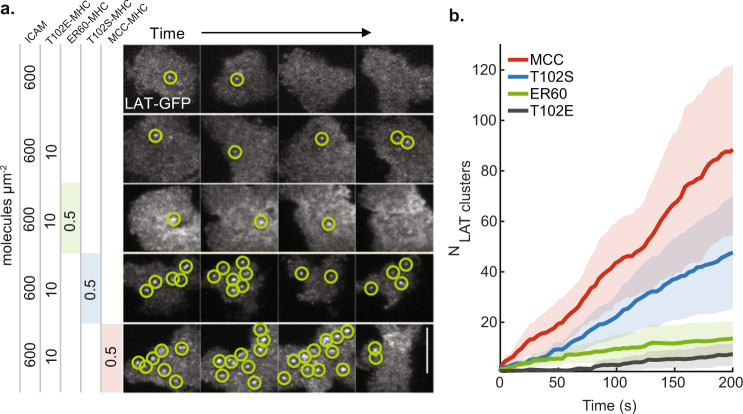
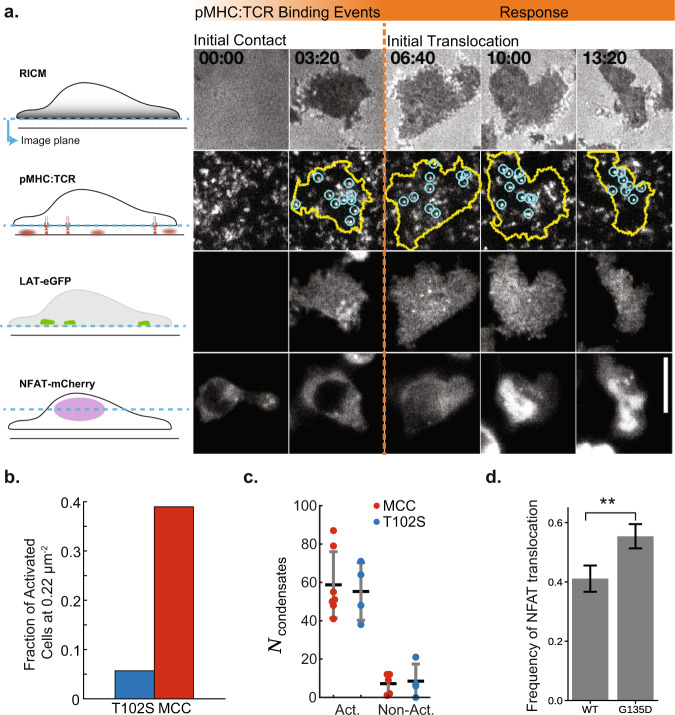
LAT assembly into a two-dimensional protein condensate is a prominent feature of antigen discrimination by T cells. Here, we use single-molecule imaging techniques to resolve the spatial position and temporal duration of each pMHC:TCR molecular binding event while simultaneously monitoring LAT condensation at the membrane. An individual binding event is sufficient to trigger a LAT condensate, which is self-limiting, and neither its size nor lifetime is correlated with the duration of the originating pMHC:TCR binding event. Only the probability of the LAT condensate forming is related to the pMHC:TCR binding dwell time. LAT condenses abruptly, but after an extended delay from the originating binding event. A LAT mutation that facilitates phosphorylation at the PLC-γ1 recruitment site shortens the delay time to LAT condensation and alters T cell antigen specificity. These results identify a function for the LAT protein condensation phase transition in setting antigen discrimination thresholds in T cells.


Conflict of interest statement

The authors declare no competing interests.

Figures

Fig. 1
Fig. 1. Single pMHC:TCR binding events trigger discrete LAT condensates.
The representative microscopy images in this figure were reproducible across 8 separate experiments/mice. a Schematic of T cell signaling that occurs downstream of pMHC:TCR binding after the plasma membrane of the T cell interfaces with the supported lipid bilayer (SLB). b Representative TIRF images of primary mouse CD4+ T cells expressing AND TCR and LAT-eGFP deposited onto SLBs with varying densities of MCC(Atto647) pMHC. c The amount of condensed LAT through time for cells in panel b. and was calculated by dividing the intensity of the total condensed area (as determined by simple thresholding) by the intensity of single LAT-eGFP molecules, see “Methods” for more detail. d Time series images of a spatially isolated pMHC:TCR binding event that produces a highly localized LAT condensate within 50 nm at onset of condensation. Time stamps are relative to the moment of pMHC:TCR binding. e Overlay of MCC(Atto647) pMHC and LAT-eGFP channels showing the co-localized trajectories of the pMHC:TCR binding event and its associated LAT condensate, as well as their centripetal motion towards the center of the cell. f A wider view of the T cell shows a constellation of binding events spread out in space. Separate binding events are enumerated. g Temporal sequence of images for the binding events in panel f. Binding events visible in the first frame of the data acquisition are not considered for subsequent analyses. Some binding events are productive (numbered in gold), while others fail to produce a localized LAT condensate (numbered in gray). h Intensity traces of productive binding events have several quantities—the number of condensed LAT produced (NLAT), the delay time until LAT condensation (τdelay), as well as the lifetime of the LAT condensate (τcondensate). The scale bar in b is 2 μm, while all other scale bars are 1 μm. Related data are in Supplementary Fig. 1. Source data are provided as a Source data file.
Fig. 2
Fig. 2. Physical properties of the LAT condensate.
a An annulus around the LAT condensate is used to sample the local background. The intensity of the condensate is calculated as the midpoint of the net intensity and total intensity, since the extent of background LAT clustering is unknown. Scale bar is 1 μm. b Scatter plot of the average number of LAT within condensates, NLAT, as a function of the total LAT expression level (endogenous LAT + exogenous LAT-eGFP). Each point is a cell average over condensates observed within the first 5 min of cell landing. The fitted line has the equation y=0.43x, which was constrained to have 0 intercept. All cells were from the same mouse. Cells from two other mice yielded similar fits, y=0.51x and y=0.48x. c Three bar plots showing the lack of correlation between pMHC:TCR dwell time (left) with either the LAT condensate lifetime (middle) or the number of LAT within its associated condensate (right). Each red bar is a pMHC:TCR binding event, data is pooled from the 8 cells in panel b. The relative size of the LAT condensate is calculated as RS=TotalIntensity+NetIntensity2(1μm2ofBackgroundIntensity). NLAT* is the relative size (RS) of the condensate rescaled using an estimated physiological (zero exogenous) LAT density of 601±150(SD)μm2. This normalizes LAT cluster size to LAT expression level for cell-to-cell comparisons. Related data are in Supplementary Fig. 2. Source data are provided as a Source data file.
Fig. 3
Fig. 3. pMHC:TCR binding dwell time modulates probability of LAT condensate formation.
a Top: time series images illustrating the temporal partitioning of the total pMHC:TCR dwell time into a delay time (pink) and a remaining productive dwell time (green). Bottom: A bar plot of a collection of 1071 pMHC:TCR binding events from 12 cells across 3 mice. Each bar represents a fully tracked pMHC:TCR binding event. The moment of condensation (if any) is indicated by the bar transitioning from pink (unproductive dwell time) to green (productive dwell time). The gray lines demarcate the bins used in the histograms for panels b and c. For b and c: Linearly increasing bin widths were used to improve the sampling rate of rare long-binding events. b MCC pMHC dwell time segments were aggregated according to the indicated bin widths. The number of productive dwell time segments (red) for a particular time bin was the number of binding events within that dwell time window which had at some prior time produced a LAT condensate. The total population of dwell time segments (orange) was fit with an exponential decay rate of kobs=koff+kbleach=123.8s. The fit distribution was integrated for each bin and plotted as a black circle. c T102S pMHC dwell time segments were aggregated according to the indicated bin widths. The number of productive dwell time segments (green) for a particular time bin was the of number binding events within that dwell time window which had at some prior time produced a LAT condensate. The total population of dwell time segments (aquamarine) was fit with an exponential decay rate of kobs=koff+kbleach=19.1s. The fit distribution was integrated for each bin and plotted as a black circle. d Bottom: The probability of a pMHC:TCR binding event producing a localized LAT condensate as a function of dwell time. For each bin of the histograms in panels b and c, the fraction of dwell time segments that were productive is plotted as a point. The error bars were computed as the standard error of the mean for a binomial variable (n, the total number of binding events in the bin, and p the productive fraction). The interpolating gray line was a fitted regularized gamma function with a maximal amplitude parameter. Top: The effective rate of LAT production kct, which is derived from the gray interpolating line in the bottom panel, is plotted along the same time axis. e Nucleation rates for various hypothetical simple kinetic proofreading schemes (N = 1, 2, or 3 steps) are plotted to illustrate key differences compared with the observed effective nucleation rate (see “kc(t) as a propensity function” in Methods for more details). Source data are provided as a Source data file.
Fig. 4
Fig. 4. LAT condensation occurs after an extended delay.
Primary mouse T cells expressing different constructs were deposited onto bilayers with 0.1–0.2 molecules μm−2 of MCC(Atto647) pMHC. For the histograms, linearly increasing bin widths were used to improve the sampling rate of rare long-delay events. Scale bars are 1 μm. a TIRF images of LAT-eGFP condensation within T cells in response to a single pMHC:TCR binding event. LAT condensation occurs near the binding event after a long delay, τdelayLAT, measured relative to the moment of pMHC:TCR binding. b Histogram of an ensemble LAT condensate delay times (115 binding events, from 18 cells across 4 mice). c TIRF images of LAT-mScarleti and mNeonGreen-GRB2 clustering within T cells in response to a single pMHC:TCR binding event. Delay times of LAT clustering, τdelayLAT, and GRB2 clustering, τdelayGRB2, relative to binding were equivalent within the resolution of this experiment (<2 s). d Histogram of an ensemble GRB2 clustering delay times from T cells expressing only mNeonGreen-GRB2 (75 binding events, from 21 cells across 4 mice). e TIRF images of LAT(G135D)-eGFP condensation within T cells in response to a single pMHC:TCR binding event. f Histogram of an ensemble of delay times between pMHC:TCR binding and LAT(G135D) condensation (102 binding events, from 17 cells across 3 mice). Related data are in Supplementary Fig. 4. Source data are provided as a Source data file.
Fig. 5
Fig. 5. The number of LAT condensates correlates with ligand potency.
a TIRF images over time of primary mouse T cells deposited onto supported membranes containing 600 molecules μm−2 ICAM-1 and one of four distinct peptides at the indicated concentrations: MCC(Atto647), T102S(Atto647), ER60(Atto647), or T102E. b cumulative time-series for the number of distinct LAT condensates observed over a sample of cells. From most productive to least: MCC (red), T102S (blue), ER60 (green), and lastly T102E (gray). Compare to Supplementary Fig. 2g. The mean was plotted as a solid dark line, while the lighter-colored error bands were derived from ±1 standard deviation. Scale bar is 5 μm. Source data are provided as a Source data file.
Fig. 6
Fig. 6. Modulating LAT condensate delay time alters antigen discrimination thresholds.
a Images of key molecular steps leading to NFAT translocation through time within primary T cells. The cells were deposited onto supported membranes containing ICAM-1 and MCC(Atto647) pMHC. First row, RICM detects cell spreading and ensures the T cell has good contact with the supported membrane. Second row, TIRF images of individual pMHC:TCR binding events (blue) are recorded within the cell perimeter (yellow). Third row, TIRF images of LAT-eGFP is monitored for condensation events. Fourth row, epifluorescence images of NFAT to track moment of translocation. Scale bar is 5μm. b Bar plot showing the frequency of T cells that undergo NFAT translocation for either T102S (ncells=27) or MCC (ncells=24) at a fixed peptide-MHC density of 0.22moleculesμm2. c Plot showing the number of distinct LAT condensates formed prior to NFAT translocation when exposed to different peptides. For n=12 cells exposed to MCC functionalized bilayers, 7 activated with μ=59±19 SEM distinct LAT condensates, while 5 failed to activate after 300 s with μ=8±5 SEM. Similarly, for n=8 cells exposed to T102S functionalized bilayers, 4 activated cells had μ=56±18 SEM distinct LAT condensates, while 4 that failed to activate after 300 s had μ=10±9 SEM. d Bar plot showing the frequency of NFAT translocation for T cells on T102S-MHC bilayers (at 1.1moleculesμm2) after 30 min for WT LAT (ncells=124,μ=0.41±0.04 SEM) or LAT-G135D (ncells=148,μ=0.55±0.04 SEM). The p-value was 0.02 as determined by a two-sided t-test. Source data are provided as a Source data file.

References

    1. Daniels MA, et al. Thymic selection threshold defined by compartmentalization of Ras/MAPK signalling. Nature. 2006;444:724–729. doi: 10.1038/nature05269. - DOI - PubMed
    1. Matsui K, Boniface JJ, Steffner P, Reay PA, Davis MM. Kinetics of T-cell receptor binding to peptide/I-Ek complexes: correlation of the dissociation rate with T-cell responsiveness. Proc. Natl Acad. Sci. USA. 1994;91:12862–12866. doi: 10.1073/pnas.91.26.12862. - DOI - PMC - PubMed
    1. Corr M, et al. T cell receptor-MHC class I peptide interactions: affinity, kinetics, and specificity. Science. 1994;265:946–949. doi: 10.1126/science.8052850. - DOI - PubMed
    1. Au-Yeung BB, et al. A sharp T-cell antigen receptor signaling threshold for T-cell proliferation. Proc. Natl Acad. Sci. USA. 2014;111:E3679–E3688. doi: 10.1073/pnas.1413726111. - DOI - PMC - PubMed
    1. François P, Altan-Bonnet G. The case for absolute ligand discrimination: modeling information processing and decision by immune T Cells. J. Stat. Phys. 2016;162:1130–1152. doi: 10.1007/s10955-015-1444-1. - DOI

Publication types

MeSH terms

Substances