. 2022 Dec 2;13(1):7444.
doi: 10.1038/s41467-022-35070-2.

DOT1L regulates chamber-specific transcriptional networks during cardiogenesis and mediates postnatal cell cycle withdrawal

Affiliations

DOT1L regulates chamber-specific transcriptional networks during cardiogenesis and mediates postnatal cell cycle withdrawal

Paola Cattaneo et al. Nat Commun. .

Abstract

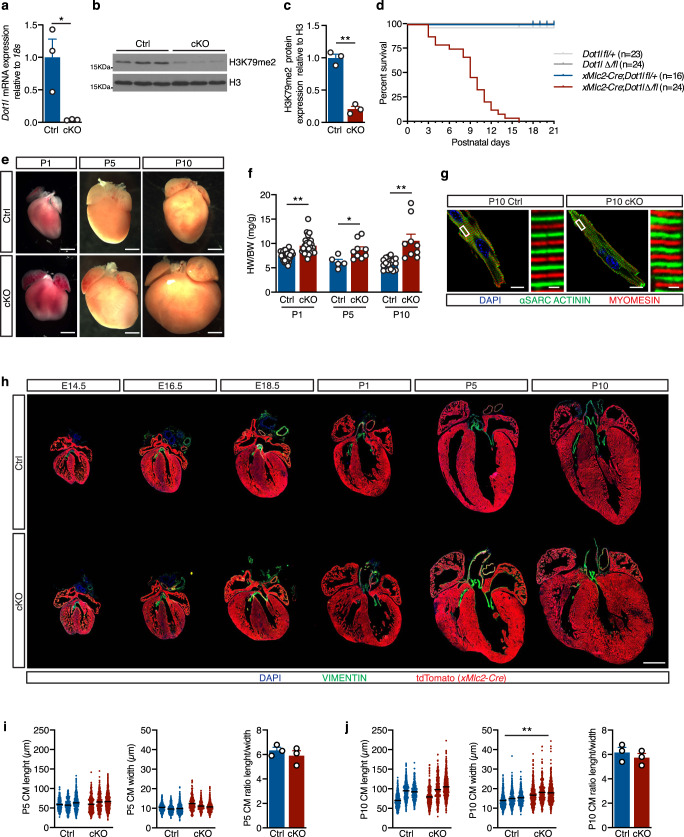
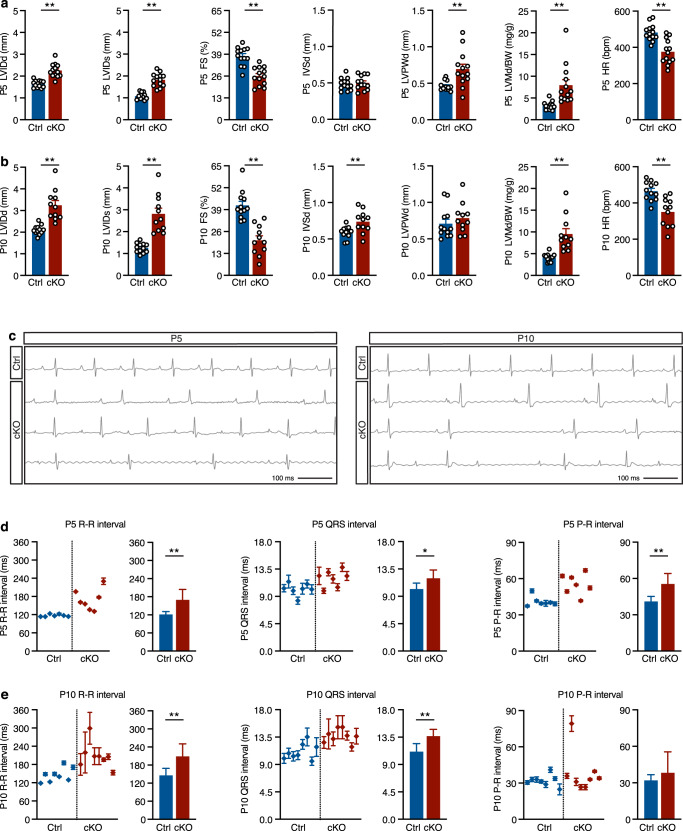
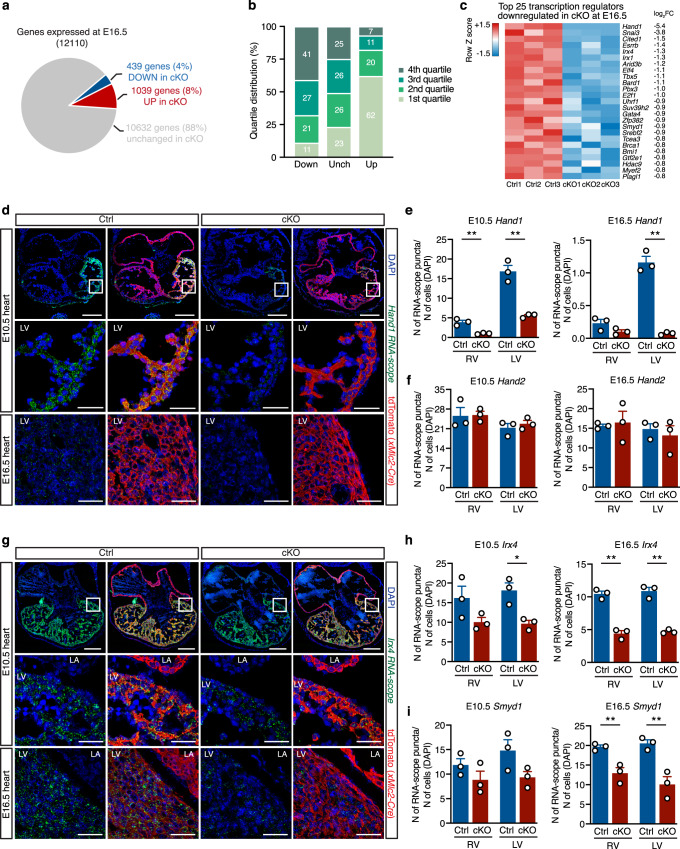
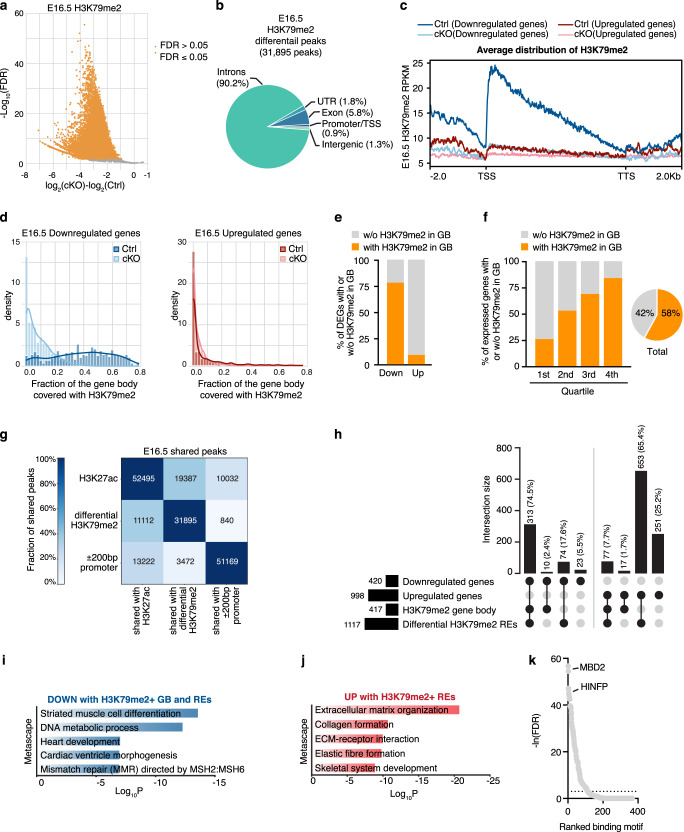
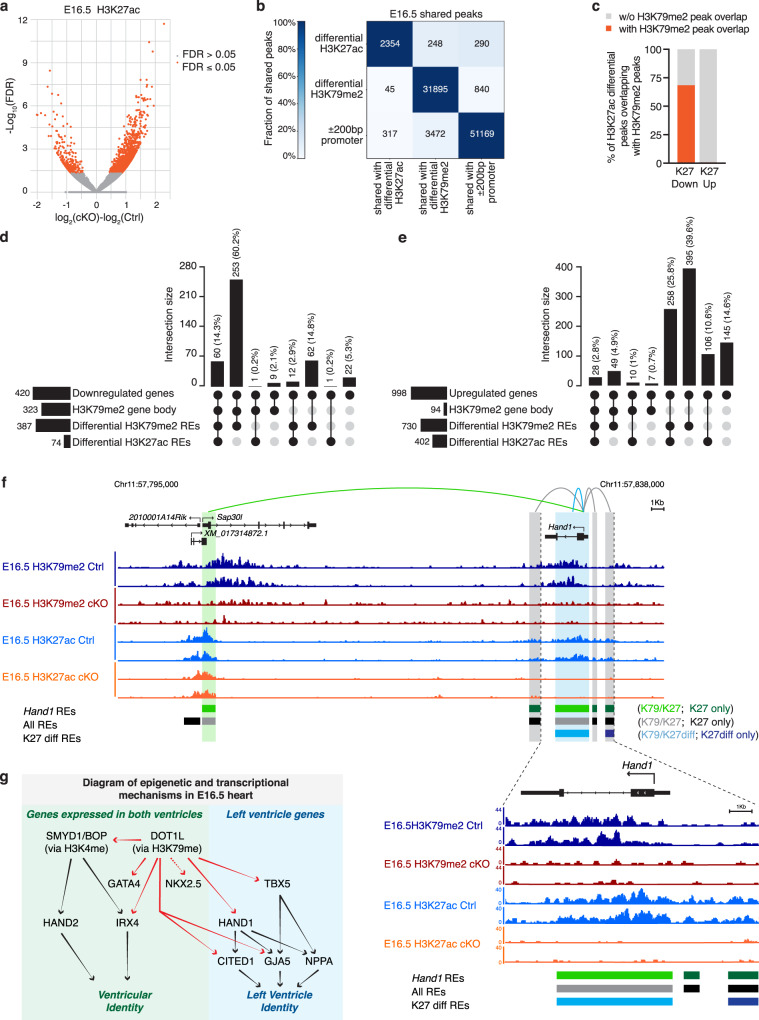
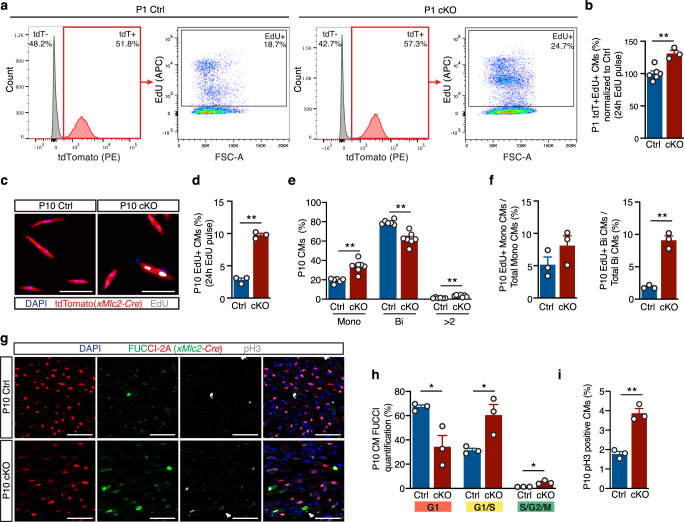
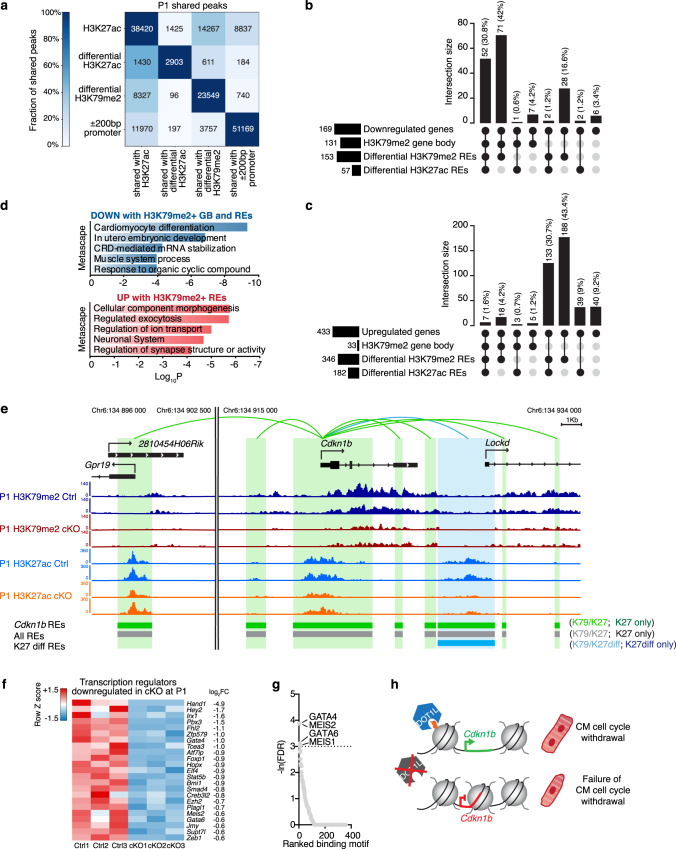
Mechanisms by which specific histone modifications regulate distinct gene networks remain little understood. We investigated how H3K79me2, a modification catalyzed by DOT1L and previously considered a general transcriptional activation mark, regulates gene expression during cardiogenesis. Embryonic cardiomyocyte ablation of Dot1l revealed that H3K79me2 does not act as a general transcriptional activator, but rather regulates highly specific transcriptional networks at two critical cardiogenic junctures: embryonic cardiogenesis, where it was particularly important for left ventricle-specific genes, and postnatal cardiomyocyte cell cycle withdrawal, with Dot1L mutants having more mononuclear cardiomyocytes and prolonged cardiomyocyte cell cycle activity. Mechanistic analyses revealed that H3K79me2 in two distinct domains, gene bodies and regulatory elements, synergized to promote expression of genes activated by DOT1L. Surprisingly, H3K79me2 in specific regulatory elements also contributed to silencing genes usually not expressed in cardiomyocytes. These results reveal mechanisms by which DOT1L successively regulates left ventricle specification and cardiomyocyte cell cycle withdrawal.


Conflict of interest statement

The authors declare no competing interests.

Figures

Fig. 1
Fig. 1. Cardiomyocyte-specific ablation of DOT1L from early developmental timepoints results in enlarged hearts and peri-natal lethality.
a qPCR analysis using a primer within the floxed exon of Dot1l mRNA showing efficient ablation of this gene in E12.5 cKO FACS-sorted CMs (N = 3 biological replicates, unpaired t-test, two-sided P = 0.0271). Western blot (b) and respective quantification (c) showing strongly reduced H3K79me2 levels in E14.5 hearts upon ablation of Dot1L (N = 3 biological replicates, unpaired t-test, two-sided P = 0.0004). d Kaplan–Meier survival curves showing postnatal lethality of Dot1L cKOs. e Whole mount images of postnatal day (P) 1, P5 and P10 hearts in Ctrls and Dot1L cKOs representative of the enlarged heart phenotype of Dot1L cKOs (scale bars = 1 mm). f Graph representing a significant increase in heart weight/body weight ratio (HW/BW (mg/g)) in Dot1L cKO vs Ctrl in all stages analyzed. (P1 Ctrl N = 36, P1 cKO N = 30, unpaired t-test, two-sided P < 0.0001; P5 Ctrl N = 5, P5 cKO N = 9, unpaired t-test, two-sided P = 0.0223; P10 Ctrl N = 16, P10 cKO N = 9 biological replicates, unpaired t-test, two-sided P = 0.0002). g Confocal images showing no alterations in sarcomere organization and myofiber orientation in Dot1L cKOs. αSarcomeric Actinin in green, Myomesin in red, DAPI (4’,6-diamidin-2-phenylindol) in blue (scale bar = 10 μm for lower magnification images on the left and 1 μm for higher magnification images on the right). h Immunofluorescence time course depicting the dynamics of phenotypic manifestations in Dot1L cKOs in embryonic (E) and postnatal (P) stages. DAPI in blue, Vimentin in green and lineage traced xMlc2-Cre;tdTomato CMs in red (scale bar = 1 mm). Assessment of CM length (left), width (middle) and ratio of CM length/width (right) at P5 (i) and P10 (j) indicated no major changes in CM size. Measurements were performed on isolated CMs (mean of 413 CMs counted per heart from N = 3 biological replicates, unpaired t-test, two-sided P = 0.0096 for P10 CM width). In all graphs Ctrl indicates control mice (XMlc2-Cre;Dot1L fl/+), cKO indicates mutant mice (XMlc2-Cre;Dot1L Δ/fl). Data is presented as mean ± SEM; * represents P ≤ 0.05, **P ≤ 0.01. Source data are provided as a Source Data file.
Fig. 2
Fig. 2. Echocardiographic and electrocardiographic defects in Dot1L cKO hearts.
Echocardiographic analyses conducted at P5 (a) and P10 (b) revealed significant defects in Dot1L cKO hearts at both timepoints, including increased left ventricular inner diameter, both in diastole (LVIDd) and systole (LVIDs), reduced fractional shortening (FS), and increased diastolic left ventricle mass to body weight ratios (LVMd/BW). Dot1L cKOs also exhibited increased diastolic left ventricular posterior wall thickness (LVPWd) at P5 and increased diastolic intra-ventricular septum thickness (IVSd) at P10. Additionally, Dot1L cKOs displayed reduced heart rate (HR) at both timepoints. (P5 Ctrl N = 13, P5 cKO N = 13, P10 Ctrl N = 12, P10 cKO N = 11 biological replicates; unpaired t-test, two-sided P5 LVIDd P < 0.0001, P5 LVIDs P < 0.0001, P5 FS P < 0.0001, P5 LVPWd P = 0.0029, P5 LVMd/BW P = 0.0017, P5 HR P < 0.0001; P10 LVIDd P < 0.0001, P10 LVIDs P < 0.0001, P10 FS P < 0.0001, P10 IVSd P = 0.0083, P10 LVMd/BW P = 0.0002, P10 HR P < 0.0005). c Representative ECG tracks from Ctrl and Dot1L cKO. ECG measurements revealed multiple defects in Dot1L cKOs both at P5 (d) and P10 (e), including increased and irregular R-R and QRS intervals. At P5 Dot1L cKOs also displayed significantly increased P-R intervals, however, this difference could not be detected in P10 mutants. (P5 N = 7, P10 N = 8 biological replicates, unpaired t-test, two-sided P5 R-R P = 0.004, P5 QRS P = 0.0164, P5 P-R P = 0.0017, P10 R-R P = 0.0024, P10 QRS P = 0.001, P10 P-R P = 0.2279). The left part of the graph represents the mean ± SD of multiple beats measured for each mouse. The right graph represents the mean ± SD of multiple biological replicates. Data is presented as mean ± SD; * represents P ≤ 0.05, **P ≤ 0.01. Source data are provided as a Source Data file.
Fig. 3
Fig. 3. DOT1L is required in cardiomyocytes for chamber-specific gene expression.
a Pie chart representing the number of genes down- (log2FC ≤ −0.5; FDR ≤ 0.05) and up-regulated (log2FC ≥ 0.5; FDR ≤ 0.05) in Dot1L cKO CMs at E16.5. b Quartile distribution of gene expression in CMs at E16.5. Genes downregulated (Down) in Dot1L cKO were expressed at a high level in control CMs, whereas the majority of upregulated genes (Up) belonged to the bottom quartile of expression. Genes not significantly modulated (Unch) were evenly distributed across quartiles of expression. Data are shown as stacked percentage bar graph. c Heatmap showing the expression of the top 25 transcription regulators downregulated in Dot1L cKO CMs at E16.5, highlighting that multiple chamber-specific transcription regulators were significantly downregulated. RNA-scope analyses (d) and respective quantification (e) validating blunted expression of Hand1 in Dot1L cKOs both at E10.5 and E16.5. (N = 3 biological replicates; unpaired t-test, two-sided, E10.5 RV P = 0.0042, E10.5 LV P = 0.0020, E16.5 LV P = 0.0003). f Quantification of RNA-scope analysis validating no changes in expression of Hand2 in Dot1L cKOs both at E10.5 and E16.5 (RNA-scope images presented in Supplementary Fig. 4) (N = 3 biological replicates). RNA-scope analyses (g) and respective quantification (h) validating reduced levels of Irx4 in Dot1L cKOs both at E10.5 and E16.5. (N = 3 biological replicates; unpaired t-test, two-sided, E10.5 LV P = 0.0153, E16.5 RV P = 0.0006, E16.5 LV P = 0.0005). i Quantification of RNA-scope analysis validating reduced levels of Smyd1 in Dot1L cKOs both at E10.5 and E16.5 (RNA-scope images presented in Supplementary Fig. 3). (N = 3 biological replicates; unpaired t-test, two-sided, E16.5 RV P = 0.0057, E16.5 LV P = 0.008). For panels d and g scale bars = 250 μm for low magnification panels and 50 μm for high magnification images. In panels e, f, h and i data is presented as mean ± SEM; * represents P ≤ 0.05, **P ≤ 0.01. (N = 3 biological replicates). Source data are provided as a Source Data file.
Fig. 4
Fig. 4. DOT1L controls transcription of target genes via a combination of H3K79me2 in gene bodies and regulatory elements.
a Volcano plot displaying H3K79me2 ChIP-seq peaks significantly enriched in E16.5 Dot1L cKO vs Ctrl CMs. b Pie chart indicating the genomic distribution of differential H3K79me2 ChIP-seq peaks in E16.5 CMs. c Metagene profiles showing the average distribution of H3K79me2 input-normalized density relative to Transcription Start Site (TSS) and Transcription Termination Site (TTS) with ±2 Kb flanking regions. d Fraction of gene body covered with H3K79me2 in downregulated genes (left graph) and in upregulated genes (right graph). e Graph representing the percentage of down- and up-regulated genes in E16.5 cKO CMs with (Coverage ≥ 50 reads and Fraction of gene body ≥ 0.2) or without (Coverage < 50 reads or Fraction of gene body <0.2) gene body H3K79me2 in E16.5 Ctrl CMs. f Percentage of genes with H3K79me2 in the gene body (GB) or without H3K79me2 in the gene body across the distinct quartiles of expression. This modification was abundant amongst highly expressed genes (4th quartile of RNA expression) and progressively decreased towards the lower quartiles of expression. Globally more than half (58%) of all genes expressed in E16.5 CMs had gene body H3K79me2. g Heatmap indicating the number of total and shared regions between H3K27ac ChIP-seq peaks in Ctrl CMs, differential H3K79me2 ChIP-seq peaks and promoters (±200 bp around 5’TSS) in E16.5 CMs. Different intensities of colors indicate the fraction (%) of shared peaks. h UpSet plot indicating the number and percentage of genes up and downregulated in cKOs versus Ctrls with or without H3K79me2 in gene body (GB) and/or regulatory elements (REs) in E16.5 CMs. Metascape pathway analysis of genes downregulated with H3K79me2 in GB and K79-REs (i) and upregulated without gene body H3K79me2 but with K79-REs (j) in Dot1L cKO versus Ctrl E16.5 CMs. Top 5 enriched categories are shown, sorted by Log10 P value. k Motif enrichment analysis ranking transcription factors (TFs) enriched in K79-REs associated with upregulated genes without H3K79me2 in GB versus K79-REs associated with downregulated genes with H3K79me2 in GB.
Fig. 5
Fig. 5. H3K27ac Relationship to H3K79me2.
a Volcano plot displaying H3K27ac ChIP-seq peaks significantly enriched in E16.5 Dot1L cKO vs Ctrl CMs. b Heatmap indicating the number of total and shared regions between differential H3K27ac ChIP-seq peaks, differential H3K79me2 ChIP-seq peaks and promoters (±200 bp around 5’TSS) in E16.5 CMs. Different intensities of colors indicate the fraction (%) of shared peaks. c Graph representing the percentage of differential H3K27ac ChIP-seq peaks in E16.5 cKO vs Ctrl CMs overlapping (orange) or not overlapping (gray) with H3K79me2 ChIP-seq peaks. H3K27ac downregulated peaks are more often differential for H3K79me2 than H3K27ac upregulated peaks (oddsratio = 0.004; p-value = 5.93e−212). UpSet plots indicating the number and percentage of genes down- (d) and upregulated (e) in E16.5 Dot1L cKO versus Ctrl CMs with or without H3K79me2 in gene body (GB) and/or regulatory elements (REs) and with or without differential H3K27ac REs. f Browser tracks displaying H3K79me2 and H3K27ac ChIP-seq profiles of Ctrl (dark and light blue respectively) and Dot1L cKO (red and orange respectively) E16.5 CMs in the genomic region containing the Hand1 locus. Loops display all regulatory interactions between REs and the Hand1 gene, as identified by the ABC analysis. Gray loops identify interactions with REs without H3K79me2, green loops identify interactions with K79-REs, whereas blue loops represent interactions with K79-REs that additionally have H3K27ac REs differentially enriched between Dot1L Ctrls and cKOs. For reference, all REs are displayed in the middle lane in black or gray, regardless of their regulatory association with the Hand1 gene. Differential H3K27ac REs are indicated in the bottom lane in light blue when they overlap a K79-RE or dark blue when they do not. g Diagrammatic representation summarizing the involvement of DOT1L in mammalian cardiogenesis. Genes directly regulated by DOT1L (via H3K79me2) are highlighted in red.
Fig. 6
Fig. 6. Neonatal Dot1L cKO cardiomyocytes fail to undergo cell cycle withdrawal.
Representative FACS analysis (a) and respective quantification (b) showing significantly increased EdU incorporation within P1 CMs (tdTomato + cells) of Dot1L cKO vs Ctrl hearts (Ctrl N = 6, cKO N = 3 biological replicates, unpaired t-test, two-sided, P = 0.0025). Representative immunofluorescence images (c), and respective quantification (d) showing significantly increased rates of EdU incorporation in P10 CMs isolated from Dot1L cKO vs Ctrl hearts. DAPI in blue, endogenous tdTomato signal driven by xMlc2-Cre;Rosa26-tdTomato in red and EdU in white. (Scale bar = 100 μm; Mean of 755 CMs counted per heart from N = 3 biological replicates, unpaired t-test, two-sided, P < 0.0001). e Quantification of relative percentage of mononuleated (Mono), binuclated (Bi) or multinucleated (>2) CMs in P10 Dot1L Ctrls and cKOs. At P10, Dot1L cKO hearts had more mononucleated (Mono) and less binucleated (Bi) CMs than littermate Ctrls (mean of 697 CMs counted per heart from N = 6 Ctrl and N = 7 cKO biological replicates, unpaired t-test, two-sided, Mono P = 0.0002, Bi P < 0.0001, >2 P = 0.0007). f Quantification of percentage of EdU+ CMs within mononucleated (left graph) and binucleated (right graph) CMs of P10 Dot1L Ctrls and cKOs (Mean of 755 CMs counted per heart from N = 3 biological replicates, unpaired t-test, two-sided P = 0.0006). Immunofluorescence images (g) and respective quantification (h, i) of P10 Dot1L Ctrl and cKO hearts on a Rosa26-Fucci2A background. Red-only nuclei represent CMs in G1; red + green (yellow) nuclei represent CMs in G1/S; green-only nuclei correspond to CMs in S/G2/M, phosphor-Histone 3 (pH3) staining in white. Dot1L cKO hearts had a significantly higher percentage of CMs in G1/S and in S/G2/M compared to Ctrls, (h, mean of 2070 CMs counted per heart from N = 3 biological replicates, unpaired t-test, two-sided G1 P = 0.0256, G1/S P = 0.0308, S/G2/M P = 0.0126) and of phopho-Histone3 + (pH3) CMs (i, mean of 1019 CMs counted per heart from N = 3 biological replicates, unpaired t-test, two-sided P = 0.0014). (Scale bar = 50 μm; sections have been quantified from all the compartments of the heart). In all graphs from b to i data is presented as mean ± SEM; * represents P ≤ 0.05, **P ≤ 0.01. Source data are provided as a Source Data file.
Fig. 7
Fig. 7. Mechanisms underlying sustained proliferation of DOT1L cKO cardiomyocytes.
a Heatmap indicating the number of total and shared regions between differential H3K27ac ChIP-seq peaks, differential H3K79me2 ChIP-seq peaks and promoters (±200 bp around 5’TSS) in P1 CMs. Different intensities of colors indicate the fraction (%) of shared peaks. UpSet plots indicating the number and percentage of genes down- (b) and upregulated (c) in P1 Dot1L cKO versus Ctrl CMs with or without H3K79me2 in gene body (GB) and/or regulatory elements (REs) and with and/or without differential H3K27ac REs. d Metascape pathway analysis of downregulated genes with H3K79me2 in GB and K79-REs (top) and upregulated genes without gene body H3K79me2 but with K79-REs (bottom) in Dot1L cKO vs Ctrl P1 CMs. Top 5 enriched categories are shown, sorted by Log10 P value. e Browser tracks displaying H3K79me2 and H3K27ac ChIP-seq profiles of Ctrls (dark and light blue respectively) and Dot1L cKOs (red and orange respectively) P1 CMs in the genomic region harboring the Cdkn1b locus (encoding p27). Loops display all regulatory interactions between REs and the Cdkn1b gene, as identified by the ABC analysis. Gray loops identify interactions with REs without H3K79me2, green loops identify interactions with K79-REs, whereas blue loops represent interactions with K79-REs that additionally have H3K27ac REs differentially enriched between Dot1L Ctrls and cKOs. For reference, all REs are displayed in the middle lane in black or gray, regardless of their regulatory association with the Cdkn1b gene. Differential H3K27ac REs are indicated in the bottom lane in light blue when they overlap a K79-RE or dark blue when they do not. f Heatmap showing the expression of all transcription regulators downregulated in Dot1L cKO CMs at P1. g Motif enrichment analysis ranking transcription factors (TFs) enriched in REs associated with downregulated genes with H3K79me2 in GB and K79REs versus upregulated genes without H3K79me2 in GB and with K79REs. h Diagrammatic representation of mechanism of defective CM cell cycle withdrawal in the absence of DOT1L.

References

    1. Reik W. Stability and flexibility of epigenetic gene regulation in mammalian development. Nature. 2007;447:425–432. doi: 10.1038/nature05918. - DOI - PubMed
    1. Singer MS, et al. Identification of high-copy disruptors of telomeric silencing in Saccharomyces cerevisiae. Genetics. 1998;150:613–632. doi: 10.1093/genetics/150.2.613. - DOI - PMC - PubMed
    1. Feng Q, et al. Methylation of H3-lysine 79 is mediated by a new family of HMTases without a SET domain. Curr. Biol. 2002;12:1052–1058. doi: 10.1016/S0960-9822(02)00901-6. - DOI - PubMed
    1. McLean CM, Karemaker ID, van Leeuwen F. The emerging roles of DOT1L in leukemia and normal development. Leukemia. 2014;28:2131–2138. doi: 10.1038/leu.2014.169. - DOI - PubMed
    1. Steger DJ, et al. DOT1L/KMT4 recruitment and H3K79 methylation are ubiquitously coupled with gene transcription in mammalian cells. Mol. Cell Biol. 2008;28:2825–2839. doi: 10.1128/MCB.02076-07. - DOI - PMC - PubMed

Publication types