. 2022 Dec 2;13(1):7414.
doi: 10.1038/s41467-022-35199-0.

Nuclear localization of mitochondrial TCA cycle enzymes modulates pluripotency via histone acetylation

Affiliations

Nuclear localization of mitochondrial TCA cycle enzymes modulates pluripotency via histone acetylation

Wei Li et al. Nat Commun. .

Abstract

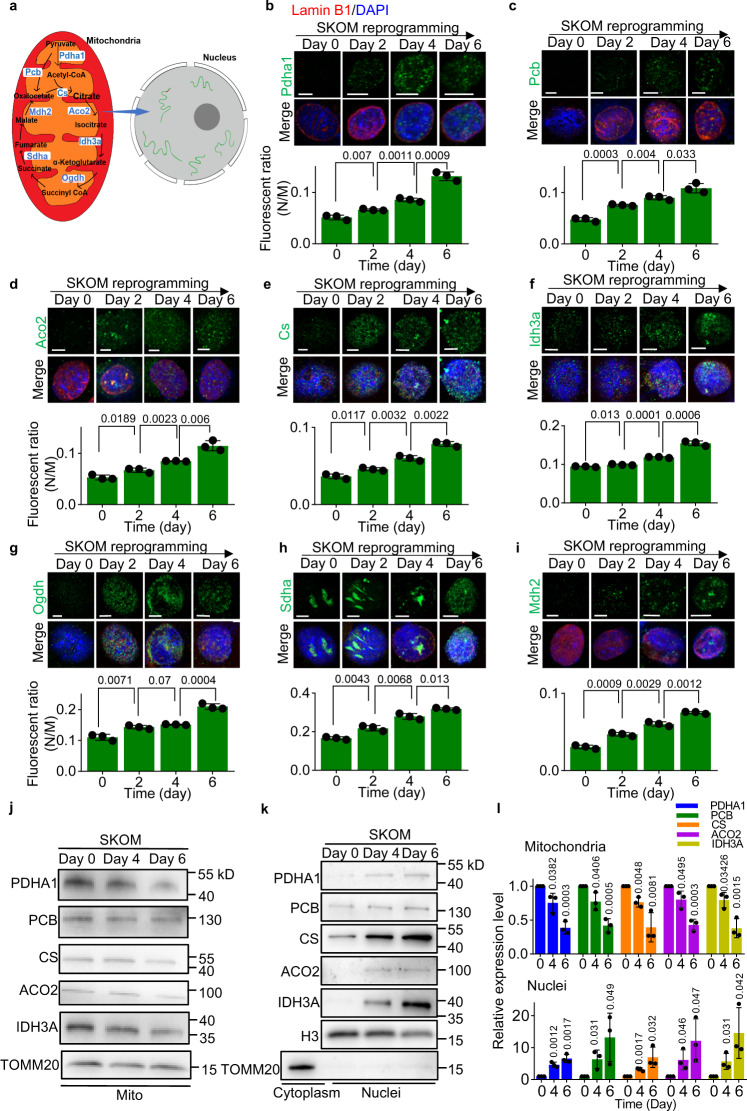
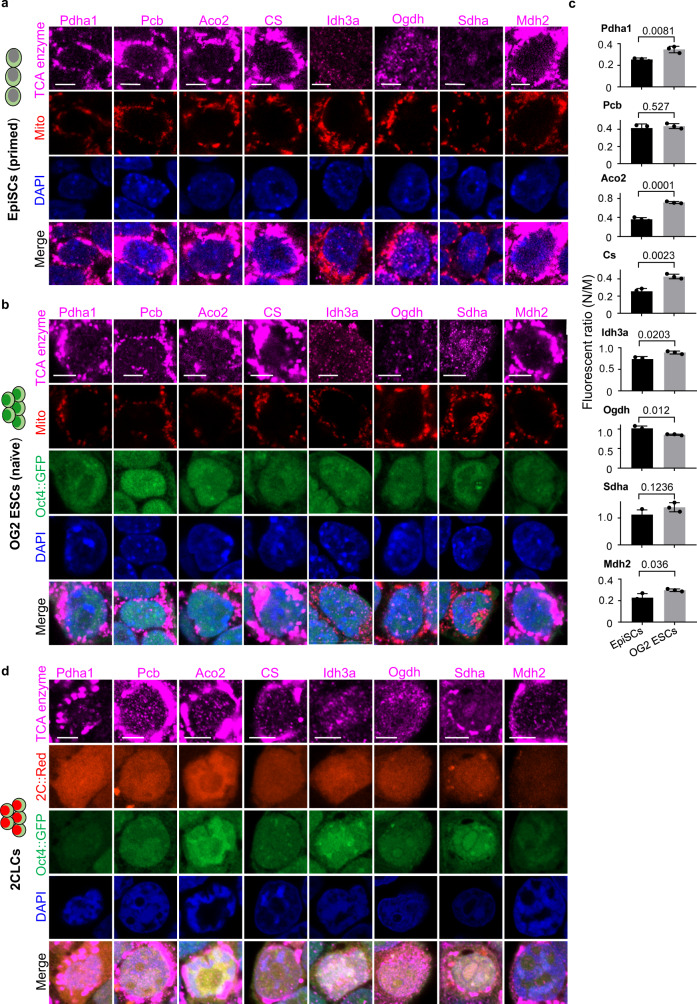
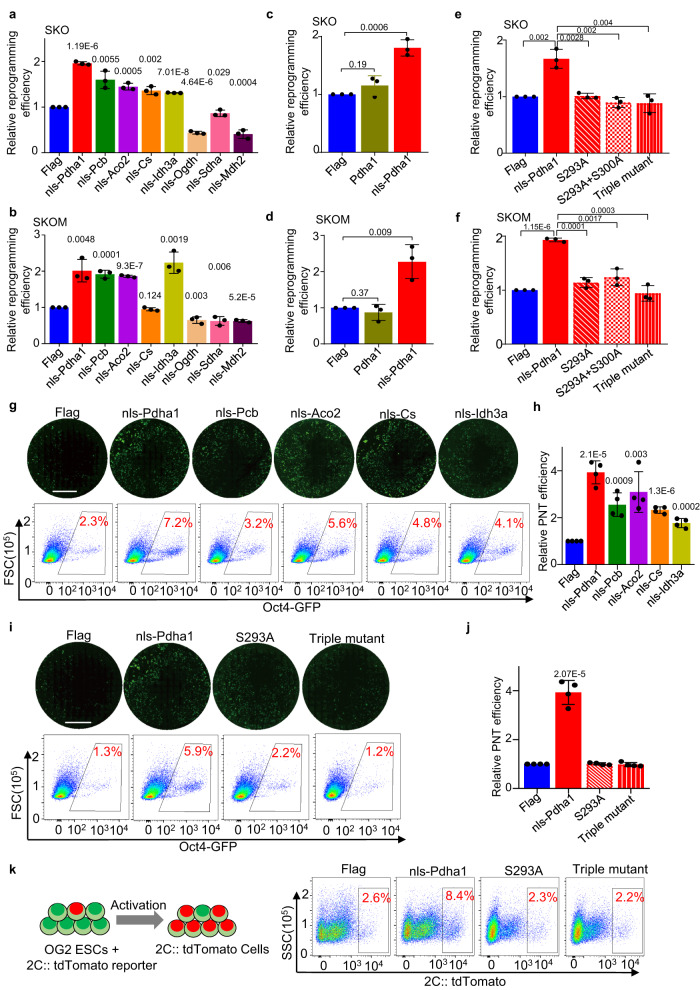
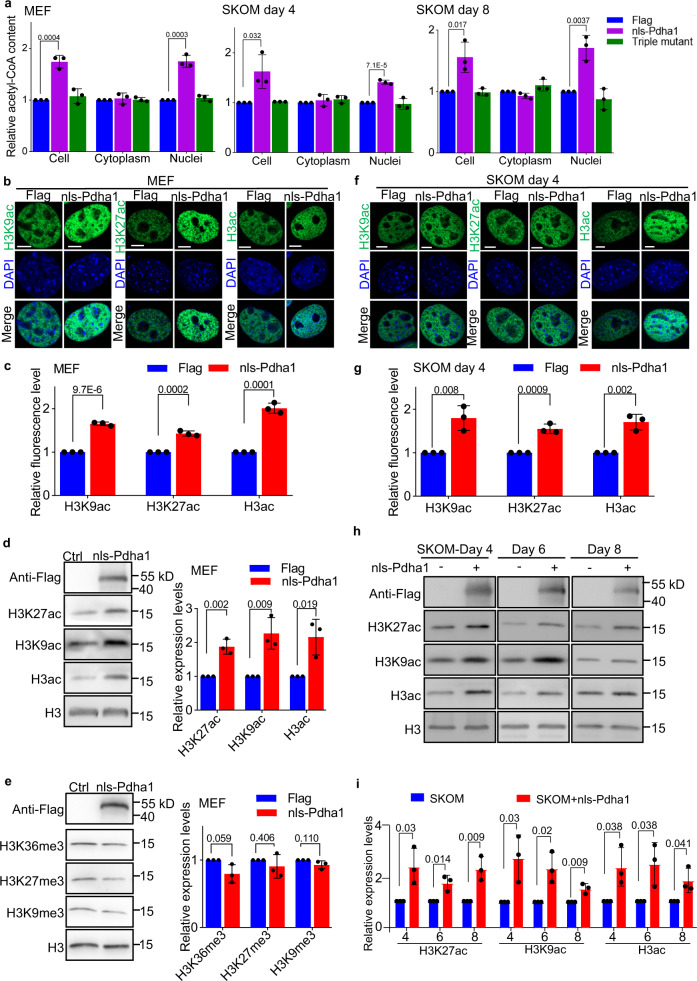
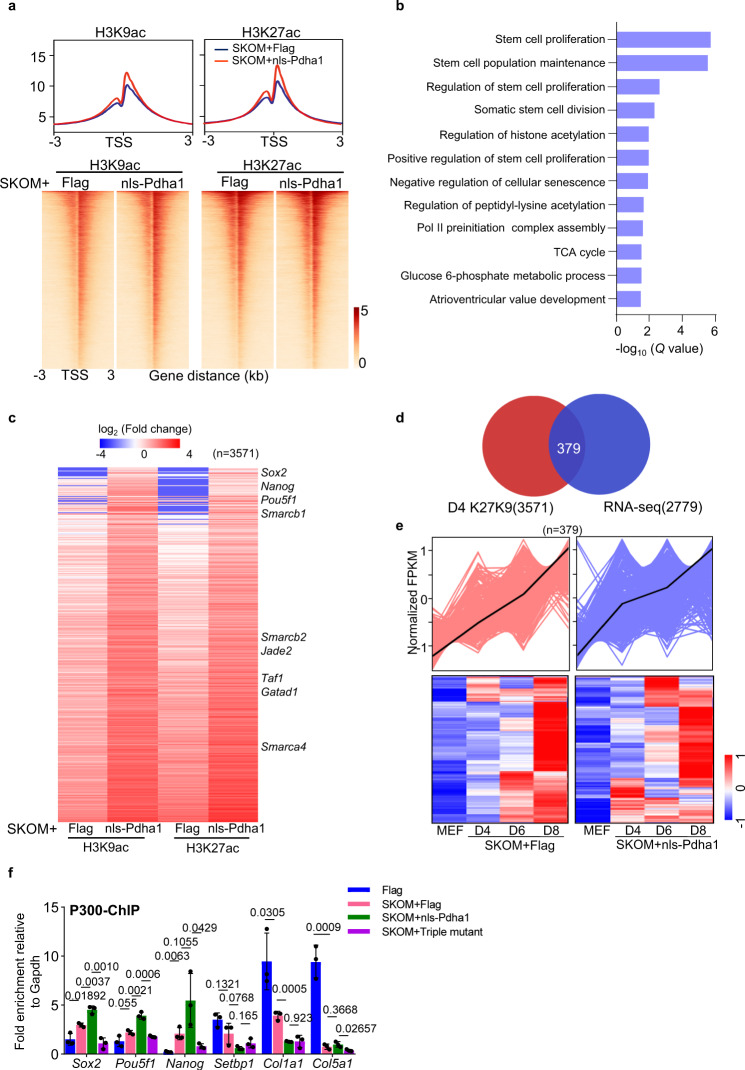
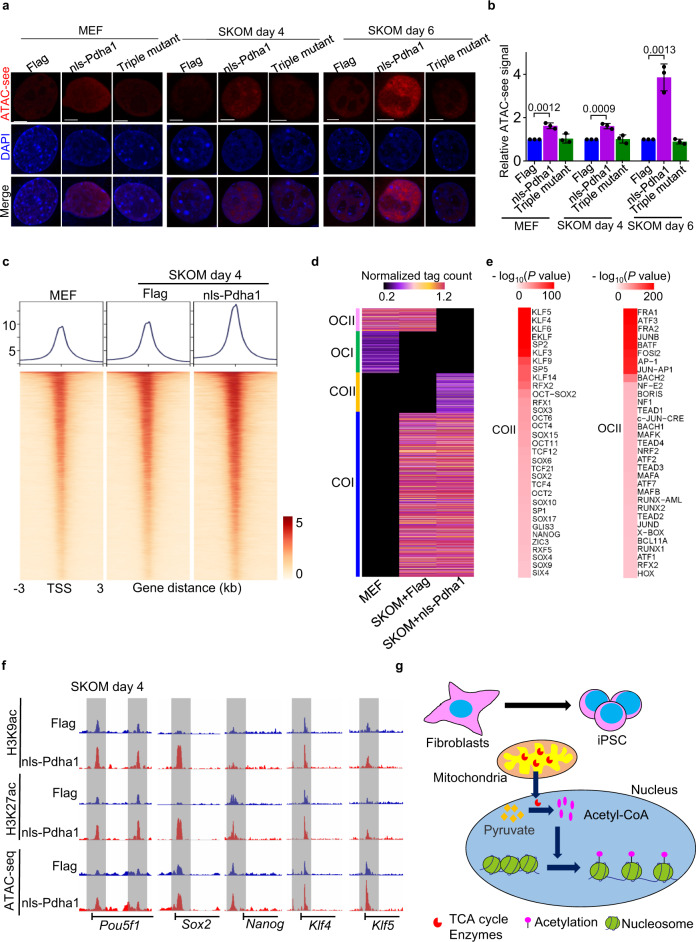
Pluripotent stem cells hold great promise in regenerative medicine and developmental biology studies. Mitochondrial metabolites, including tricarboxylic acid (TCA) cycle intermediates, have been reported to play critical roles in pluripotency. Here we show that TCA cycle enzymes including Pdha1, Pcb, Aco2, Cs, Idh3a, Ogdh, Sdha and Mdh2 are translocated to the nucleus during somatic cell reprogramming, primed-to-naive transition and totipotency acquisition. The nuclear-localized TCA cycle enzymes Pdha1, Pcb, Aco2, Cs, Idh3a promote somatic cell reprogramming and primed-to-naive transition. In addition, nuclear-localized TCA cycle enzymes, particularly nuclear-targeted Pdha1, facilitate the 2-cell program in pluripotent stem cells. Mechanistically, nuclear Pdha1 increases the acetyl-CoA and metabolite pool in the nucleus, leading to chromatin remodeling at pluripotency genes by enhancing histone H3 acetylation. Our results reveal an important role of mitochondrial TCA cycle enzymes in the epigenetic regulation of pluripotency that constitutes a mitochondria-to-nucleus retrograde signaling mode in different states of pluripotent acquisition.


Conflict of interest statement

The authors declare no competing interests.

Figures

Fig. 1
Fig. 1. Nuclear localization of TCA cycle enzymes in somatic cell reprogramming.
a Schematic diagram of TCA cycle enzymes in regulating epigenetics in the nucleus. bi Nuclear location of TCA cycle enzymes (green) during the early stages of somatic cell reprogramming with SKOM. Isolated nuclei were stained with antibodies targeting Pdha1 (b), Pcb (c), Aco2 (d), Cs (e), Idh3a (f), Ogdh (g), Sdha (h), or Mdh2 (i) together with Lamin B1 (red) and DAPI (blue). Scale bars, 5 µm. The nuclei/mitochondria (N/M) fluorescent ratio of each TCA cycle enzyme during somatic cell reprogramming with SKOM present in the source files was shown at the lower panel. Data are presented as the mean ± S.D from three independent experiments containing at least 30 cells each. A two-tailed unpaired Student’s t-test was used. j, k, The western blot analysis of PDHA1, PCB, CS, ACO2, and IDH3A in the mitochondria (j) or nucleus (k) during somatic cell reprogramming induced by SKOM. The TOMM20 was used as an indicator of mitochondrial content, while H3 were used as loading controls. l The quantification of PDHA1, PCB, CS, ACO2, and IDH3A in the mitochondria (upper panel) or nucleus (lower panel) are presented on the right. Data are presented as the mean ± S.D and n = 3 independent experiments. A two-tailed unpaired Student’s t test was used.
Fig. 2
Fig. 2. Translocation of TCA cycle enzymes in primed-to-naive transition and totipotency stem cells.
a, b Immunostaining of Pdha1, Pcb, Aco2, Cs, Idh3a, Ogdh, Sdha, and Mdh2 (purple) in mouse epiblast stem cells (EpiSCs) (a) or OG2 embryonic stem cells (naive stem cells) (b). The mito-DsRed (Mito) was used as a marker of mitochondria. Oct4::GFP is an indicator of embryonic stem cells and DAPI (blue) for indicating the nucleus. Scale bars, 5 µm. c The nuclei/mitochondria fluorescent (N/M) ratio of TCA cycle enzymes in EpiSCs and OG2 ESCs (Naive). Data are presented as the mean ± S.D of at least 30 cells from three independent experiments. A two-tailed unpaired Student’s t test was used. d, Immunostaining of Pdha1, Pcb, Aco2, Cs, Idh3a, Ogdh, Sdha, and Mdh2 (purple) in 2-cell stage-like cells (2CLCs). Oct4::GFP was used to track embryonic stem cells, 2C::tdTomato (red) was used to track 2CLCs, and DAPI (blue) for indicating the nucleus. Scale bars, 5 µm. Three independent experiments were repeated with similar results and one representative picture was presented (a, b, d).
Fig. 3
Fig. 3. Nuclear TCA cycle enzymes modulate somatic cell reprogramming, primed-to-naive transition and totipotency acquisition.
a, b Relative somatic cell reprogramming efficiency after transducing with nuclear-targeted TCA cycle enzymes together with SKO (a) or SKOM (b). The reprogramming efficiency was determined by counting the GFP-positive colonies. c, d The relative somatic cell reprogramming efficiency after overexpression of Pdha1 or nls-Pdha1 together with SKO (c) or SKOM (d). e, f The relative somatic cell reprogramming efficiency after overexpression of nls-Pdha1 or nuclear-targeted catalytic mutants of Pdha1-S293A, S293A + S300A or S232A + S293A + S300A (Triple mutant)-together with SKO (e) or SKOM (f). g Representative images (upper panel) and flow cytometry analysis (lower panel) (gated on Oct4-GFP cells) of GFP-positive naive stem cell colonies generated from EpiSCs with nls-Pdha1, nls-Pcb, nls-Aco2, nls-Cs or nls-Idh3a overexpression. The Flag was used as control. Scale bars, 250 µm. Three independent experiments were repeated with similar results. h The relative PNT efficiency after overexpression of nls-Pdha1, nls-Pcb, nls-Aco2, nls-Cs, and nls-Idh3a. i Representative images (upper panel) and flow cytometry analysis (lower panel) (gated on Oct4-GFP cells) of GFP-positive naive stem cell colonies generated from EpiSCs with nls-Pdha1, S293A, and Triple mutant. Scale bars, 250 µm. Three independent experiments were repeated with similar results. j The relative PNT efficiency after overexpression nls-Pdha1, nls-Pdha1, S293A and Triple mutant. k Left: Schematic of OG2 ESCs with 2C:: tdTomato reporter induced into totipotency stem cells. Right: Flow cytometry (gated on 2C:: tdTomato cells) showing the relative proportion of 2C:: tdTomato-positive totipotency stem cells generated from OG2 ESCs with overexpression of nls-Pdha1 or nuclear-targeted catalytic mutants of Pdha1 (right). Data are presented as the mean ± S.D (af, h, j), and n = 3 independent experiments (af) or n = 4 independent experiments (h, j). A two-tailed unpaired Student’s t test was used (af, h, j).
Fig. 4
Fig. 4. Nuclear Pdha1 promotes histone acetylation by increasing the local acetyl-CoA content.
a Relative content of acetyl-CoA in whole-cell, cytoplasm, or nucleus of MEFs during somatic cell reprogramming with SKOM. Cells after overexpression of Flag, nls-Pdha1, or nls-Pdha1 with triple mutation of its catalytic domain (Triple mutant) were tested. b, c Representative images (b) and quantification (c) of H3K9ac, H3K27ac, and H3ac (green) in MEFs with or without nls-Pdha1 overexpression. Scale bars, 5 µm. d Western blot analysis of H3K9ac, H3K27ac, and H3ac in MEFs with or without nls-Pdha1 overexpression, as well the band quantification. Anti-Flag was targeting nls-Pdha1 and Anti-H3 was used as a loading control. e H3K9me3, H3K27me3, and H3k36me3 modifications in MEFs with or without nls-Pdha1 overexpression were detected by western blot. Anti-Flag was targeting nls-Pdha1 and Anti-H3 was used as a loading control. The relative expression levels were quantified in the right panel. f, g Representative images (f) and quantification (g) of H3K9ac, H3K27ac, and H3ac (green) at day 4 of cell reprogramming with SKOM plus nls-Pdha1 or Flag (control). Scale bars, 5 µm. h The H3K9ac, H3K27ac, and H3ac modifications during cell reprogramming with or without nls-Pdha1 at indicated time point were detected by western blot. Anti-Flag was targeting nls-Pdha1 and Anti-H3 was used as a loading control. i The relative expression levels of H3K9ac, H3K27ac, and H3ac modifications during cell reprogramming with or without nls-Pdha1 at each time point were quantified. Data are presented as the mean ± S.D and n = 3 independent experiments (a, ce, g, h, i). At least 30 cells were counted in each experiment (c, g). A two-tailed unpaired Student’s t test was used (a, ce, g, i).
Fig. 5
Fig. 5. Nuclear-localized Pdha1 promotes histone acetylation of pluripotent genes by facilitating the enrichment by P300.
a Pileup (upper panel) and heatmap (lower panel) of H3K9ac, H3K27ac ChIP-seq near the TSS in MEFs transduced with SKOM plus nls-Pdha1 or Flag on day 4. 2 independent experiments were repeated with similar results, and one replicate (n = 1, each group) was used for ChIP-seq (upstream 3 kb and downstream 3 kb of the TSS). b GO analysis for the genes with >1.5-fold enrichment of H3K9ac and H3K27ac in the nls-Pdha1 overexpression group at day 4 during somatic cell reprogramming. c Global view of H3K9ac and H3K27ac levels at genes with >1.5-fold upregulated normalized tag density near the TSS at day 4. A total of 3571 genes were contained. Two independent experiments were repeated with similar results, and one replicate (n = 1, each group) was used for this analysis. d Venn diagram depicting overlap of the genes where both H3K9ac and H3K27ac increased around TSS sites with genes upregulated in somatic cell reprogramming. A total of 3571 genes were contained in ChIP-seq data, while a total of 2779 genes were contained in RNA-seq data. e Dynamic of the overlayed genes (d) in SKOM induced reprogramming with or without nls-Pdha1 or Flag. 2 independent experiments were repeated with similar results, and one replicate (n = 1, each group) was used for this analysis (be). f ChIP-qPCR analysis of P300 enrichment on promoter regions of pluripotency genes (Sox2, Pouf51, Nanog) and somatic genes (Setbp1, Col1a1, Col5a1). Data are presented as the mean ± S.D and n = 3 independent experiments. A two-tailed unpaired Student’s t test was used.
Fig. 6
Fig. 6. Nuclear Pdha1 loosens chromatin of pluripotency genes and promotes somatic cell reprogramming.
a Representative images of ATAC-see (red) in MEFs before and after transduction with SKOM plus nls-Pdha1, Triple mutant or Flag at day 4 and day 6. Scale bars, 5 µm. b Quantification of the relative levels of ATAC-see signal represented in a. Data are presented as the mean ± S.D and n = 3 independent experiments. At least 30 nuclei were counted in each experiment. A two-tailed unpaired Student’s t test was used. c Heatmap and pileup of ATAC-seq signal near the TSS (upstream 3 kb and downstream 3 kb of the TSS) in MEFs and MEFs transduced with SKOM plus nls-Pdha1 or Flag on day 4. Three replicates (n = 3, each group) were used for the ATAC assay. d Heatmap of ATAC-seq OC/CO loci at day 4 during reprogramming: closed in Flag but open in Flag+SKOM and nls-Pdha1+SKOM (COI), closed in Flag and Flag+SKOM but open in nls-Pdha1+SKOM (COII), open in Flag but closed in SKOM + Flag and SKOM + nls-Pdha1 (OCI), open in Flag and SKOM + Flag but closed in SKOM + nls-Pdha1 (OCII). Units are in normalized sequence tag counts. Three replicates (n = 3, each group) were used for ATAC assay. e TF motifs significantly enriched at least >1.5-fold in COII (left) and OCII (right) peaks defined in d. The motif enrichment was conducted using the findMotifsGenome.pl module in HOMER. Three independent experiments were repeated with similar results, and three replicates (n = 3, each group) were used for this analysis. f Selected genome views for H3K9ac and H3K27ac ChIP-seq data and ATAC-seq in reprogramming on day 4 with or without expression of nls-Pdha1. Regions of open chromatin are marked with a gray box. Genome views: Nanog (chr6:122,704,483–122,716,633), Pou5f1 (chr17:35,504,032–35,512,777), Klf4 (chr4:55,525,137–55,534,475), Sox2 (chr3:34,647,995–34,654,461) and Klf5 (chr14:99,296,691–99,315,412). All genome views are on the same vertical scale. g Schematic diagram represents the mechanism of nuclear translocation of Pdha1 in regulating cell fate through epigenetic regulation.

References

    1. Orkin SH, Hochedlinger K. Chromatin connections to pluripotency and cellular reprogramming. Cell. 2011;145:835–850. doi: 10.1016/j.cell.2011.05.019. - DOI - PMC - PubMed
    1. Baker CL, Pera MF. Capturing totipotent stem cells. Cell Stem Cell. 2018;22:25–34. doi: 10.1016/j.stem.2017.12.011. - DOI - PubMed
    1. Yamanaka S, Blau HM. Nuclear reprogramming to a pluripotent state by three approaches. Nature. 2010;465:704–712. doi: 10.1038/nature09229. - DOI - PMC - PubMed
    1. Li M, Liu GH, Izpisua Belmonte JC. Navigating the epigenetic landscape of pluripotent stem cells. Nat. Rev. Mol. Cell Biol. 2012;13:524–535. doi: 10.1038/nrm3393. - DOI - PubMed
    1. Gurdon JB, Melton DA. Nuclear reprogramming in cells. Science. 2008;322:1811. doi: 10.1126/science.1160810. - DOI - PubMed

Publication types