. 2022 Dec 3;79(12):615.
doi: 10.1007/s00018-022-04646-y.

The endocytic recycling compartment serves as a viral factory for hepatitis E virus

Affiliations

The endocytic recycling compartment serves as a viral factory for hepatitis E virus

Cyrine Bentaleb et al. Cell Mol Life Sci. .

Abstract

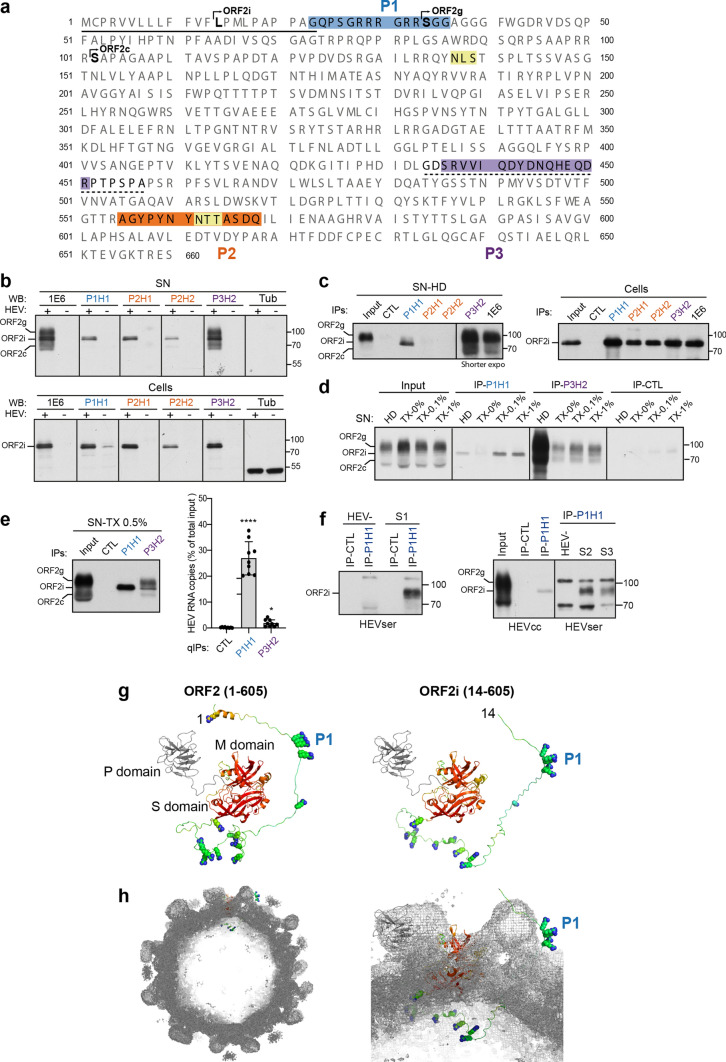
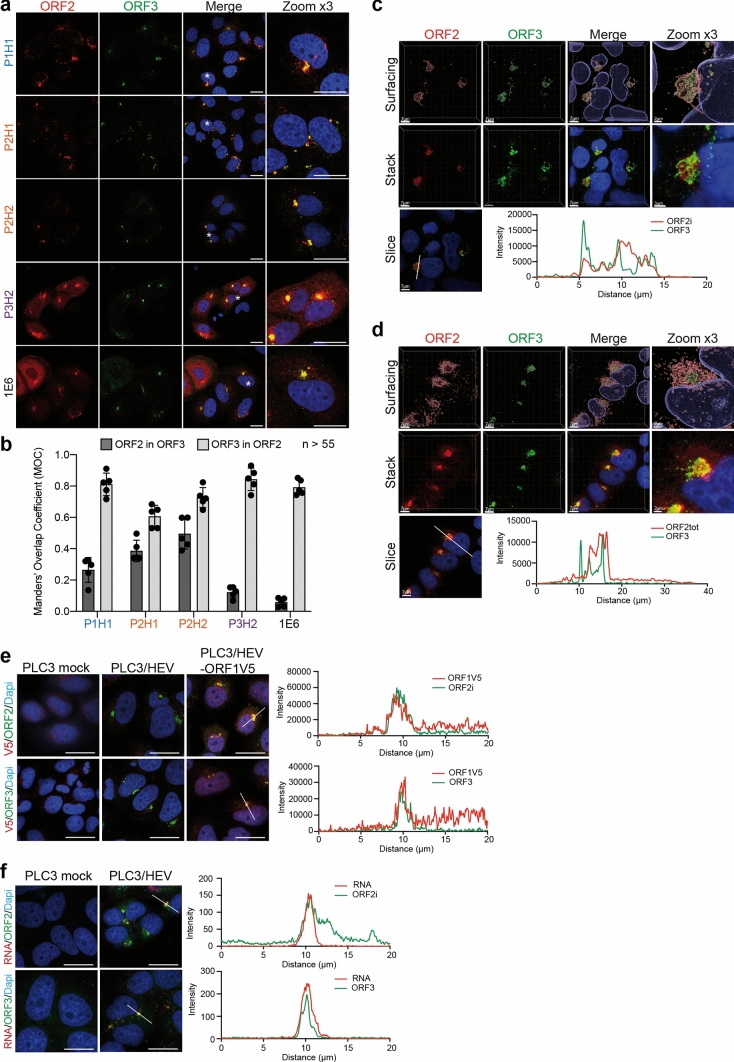
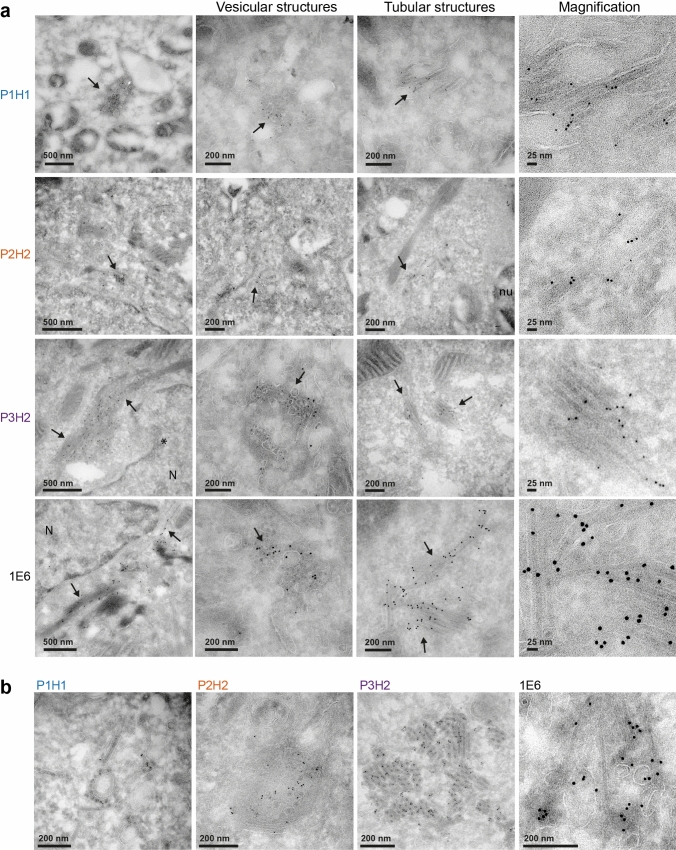
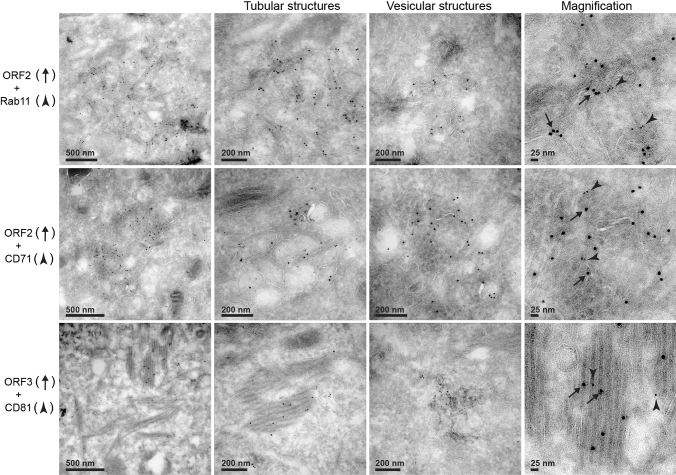
Although hepatitis E virus (HEV) is the major leading cause of enterically transmitted viral hepatitis worldwide, many gaps remain in the understanding of the HEV lifecycle. Notably, viral factories induced by HEV have not been documented yet, and it is currently unknown whether HEV infection leads to cellular membrane modeling as many positive-strand RNA viruses. HEV genome encodes the ORF1 replicase, the ORF2 capsid protein and the ORF3 protein involved in virion egress. Previously, we demonstrated that HEV produces different ORF2 isoforms including the virion-associated ORF2i form. Here, we generated monoclonal antibodies that specifically recognize the ORF2i form and antibodies that recognize the different ORF2 isoforms. One antibody, named P1H1 and targeting the ORF2i N-terminus, recognized delipidated HEV particles from cell culture and patient sera. Importantly, AlphaFold2 modeling demonstrated that the P1H1 epitope is exposed on HEV particles. Next, antibodies were used to probe viral factories in HEV-producing/infected cells. By confocal microscopy, we identified subcellular nugget-like structures enriched in ORF1, ORF2 and ORF3 proteins and viral RNA. Electron microscopy analyses revealed an unprecedented HEV-induced membrane network containing tubular and vesicular structures. We showed that these structures are dependent on ORF2i capsid protein assembly and ORF3 expression. An extensive colocalization study of viral proteins with subcellular markers, and silencing experiments demonstrated that these structures are derived from the endocytic recycling compartment (ERC) for which Rab11 is a central player. Hence, HEV hijacks the ERC and forms a membrane network of vesicular and tubular structures that might be the hallmark of HEV infection.

Keywords: AlphaFold2; Antibodies; Electron microscopy; Endocytic recycling compartment; Hepatitis E virus; Infectious particles; ORF2 capsid protein; Rab11; Viral factories.


Conflict of interest statement

Claire Montpellier, Jean Dubuisson and Laurence Cocquerel are coinventors of two patent applications on the use of antibodies having specificity for the ORF2i protein for HEV diagnostic purposes. Patents have been filed by Inserm Transfert. Julien Roux and Clarence Deffaud are employees of the BIOTEM company. The authors have no other financial or non-financial interests to disclose.

Figures

Fig. 1
Fig. 1
Generation of monoclonal antibodies that specifically recognize the ORF2i protein. a Sequence of ORF2 proteins. The line corresponds to the signal peptide. N-glycosylation sites are highlighted in yellow. P1, P2 and P3 peptides are highlighted in blue, orange and purple, respectively. The dashed line corresponds to the 1E6 epitope. b Detection of ORF2 proteins in supernatants (SN) and lysates (cells) of PLC3/HEV (+) and mock electroporated PLC3 cells (−) by WB. c Immunoprecipitation of ORF2 proteins in heat-denatured (HD, 20 min at 80 °C) SN and lysates of PLC3/HEV cells. An anti-HCV E2 envelope protein antibody (H52) was used as a negative control (CTL). ORF2 proteins were detected by WB with the 1E6 antibody (WB 1E6). d IP of SN treated for 30 min with Triton X-100 (TX-0.1%, TX-1%), or left untreated (TX-0%). Inputs used for IP are shown on the left. ORF2 proteins were detected by WB 1E6. e SN of PLC3/HEV cells was treated with TX-0.5% and immunoprecipitated with the P1H1, P3H2 or isotype control antibodies. Half of the IP was analyzed by WB 1E6 (left panel) and the other half was processed for RNA extraction and HEV RNA quantification (right panel). Results are expressed as percentage of immunocaptured HEV RNA copies compared to the total input. Values are means from three independent experiments (n = 3, mean ± S.D., Kruskal–Wallis with Dunn’s test), *p < 0.05, ****p < 0.0001. f Sera of HEV-infected (HEVser, S1-S3) or non-infected (HEV-) patients were treated with TX-0.5% and immunoprecipitated with P1H1 or isotype control antibodies. IPs on SN of PLC3/HEV cells (HEVcc) were used as controls. ORF2 proteins were detected by WB 1E6. (b-f) Molecular mass markers are indicated on the right (kDa). For clarity and conciseness concerns, blots were cropped. g Models of ORF2 (left) and ORF2i (right) including their N-termini (residues 1–128 and 14–128, respectively. The first residue is labeled. The 606–660 residues located downstream of the P (protruding) domain are not included). Models are displayed in ribbons representation and, for S (shell) and M (middle) domains, colored by expected accuracy from red (most accurate) to blue (least accurate or no defined structure). P (protruding) domain is colored in gray. Arginine side chains upstream residue 128 are displayed as spheres. The P1 epitope is labeled. h The same ORF2i model in the same representation and orientation as in (g, right) has been fitted at the 'A' molecule position in the 12-Å cryo-EM map of a virion-sized recombinant ORF2 icosahedral T = 3 particle (EMDB 5173). Left, cutaway overall view. Right, zoom on the model
Fig. 2
Fig. 2
Subcellular structures recognized by anti-ORF2 antibodies. a At 6 days post-electroporation (d.p.e.), PLC3/HEV cells were fixed, permeabilized with cold methanol and TX-0.5% and double-stained with indicated anti-ORF2 and anti-ORF3 antibodies. Red = ORF2; Green = ORF3; Blue = DAPI. Staining were analyzed by confocal microscopy. Scale bar, 20 μm. b Manders' overlap coefficients (MOC) of the ORF2 labeling in the ORF3 labeling (ORF2 in ORF3, dark grey) and MOC of the ORF3 labeling in the ORF2 labeling (ORF3 in ORF2, light grey). c, d PLC3/HEV cells were co-stained with anti-ORF3 and P1H1 (c) or P3H2 (d) antibodies and analyzed by confocal microscopy with a high-resolution Airyscan module. On the top, volume rendering of the 3D z-stacks (Surfacing) using Imaris is shown to visualize the ORF2/ORF3 substructures. In the middle, z-stacks are shown. On the bottom, line graphs show the fluorescence intensities of ORF2 and ORF3 staining measured every 50 nm across the region of interest highlighted by the white line in the micrograph shown on the bottom left of each panel. Scale bars show the indicated length. e PLC3 cells were electroporated with the p6 strain expressing either wildtype (PLC3/HEV) or the V5-tagged ORF1 (PLC3/HEV-ORF1V5) proteins or mock electroporated (PLC3 mock). At 3 d.p.e., cells were processed for immunofluorescence using anti-V5 (V5, red), and P1H1 (ORF2, green) or anti-ORF3 (ORF3, green) antibodies prior to analysis by confocal microscopy. Line graphs show the fluorescence intensities of ORF1V5 and ORF2i or ORF3 staining measured every 70 nm across the region of interest highlighted by the white line in the micrograph shown on the left. f PLC3/HEV and PLC3 mock cells were grown on coverslips, fixed at 3 d.p.e. and processed for in situ RNAscope hybridization. Cells were stained with a probe targeting HEV genomic RNA (RNA, red) and P1H1 (ORF2, green) or anti-ORF3 (ORF3, green) antibodies. Line graphs show the fluorescence intensities of RNA and ORF2i or ORF3 staining measured every 70 nm across the region of interest highlighted by the white line in the micrograph shown on the left. Nuclei are in blue. Scale bar, 20 μm
Fig. 3
Fig. 3
Identification of HEV-induced vesicular and tubular structures in HEV-producing PLC3 cells. a Transmission electron microscopy of PLC3/HEV cells cryosections immunogold-labeled with the indicated antibodies. Arrows highlight vesicular and tubular structures. N, nucleus. The asterisk indicates a nuclear deformation. b Networks containing both vesicular and tubular structures in PLC3/HEV cells
Fig. 4
Fig. 4
Identification of HEV-induced subcellular structures in HEV-producing Huh-7.5 cells. Huh-7.5 cells electroporated with HEV RNA (ac) and Huh-7.5 cells infected with HEV particles (d, f) were fixed at 6 days p.e and 12 days post-infection, respectively. a, d Cells were next processed for immunostaining with 1E6, P1H1, anti-ORF3 and anti-Rab11 antibodies, as indicated. Red = ORF2; Green = ORF3 or Rab11; Blue = DAPI. Staining were analyzed by confocal microscopy. Scale bar, 20 μm. Manders' overlap coefficients (MOC) of ORF2i (P1H1) staining in ORF3 or Rab11 staining (n ≥ 30 cells) were calculated. b, c, e–f) Cryosections of HEV-producing Huh-7.5 cells were processed for immunogold labeling with 1E6 or P1H1 antibodies (visualized by 6-nm gold particles), as indicated. Cryosections were next analyzed by EM. Vesicular (b, e) and tubular (c, f) structures containing ORF2 proteins are indicated by black arrows. N nucleus
Fig. 5
Fig. 5
HEV-induced subcellular structures are dependent on the expression of ORF3 protein and assembly of ORF2 capsid proteins. At 6 days post-electroporation (d.p.e.), PLC3/HEV (a, b), PLC3/HEV-ΔORF3 (c) and PLC3/HEV-5R/5A (d) cells were fixed, permeabilized with cold methanol and TX-0.5% and double-stained with P1H1 (a) or 1E6 (b–d) and anti-ORF3 antibodies. Red = ORF2; Green = ORF3; Blue = DAPI. Staining was analyzed by confocal microscopy. Manders' overlap coefficients (MOC) of the ORF3 labeling in the ORF2 labeling were calculated on at least 30 cells. Line graphs show the fluorescence intensities of ORF2 and ORF3 staining measured every 200 nm across the region of interest highlighted by the white line in the micrograph shown above. Scale bar, 20 μm. Cryosections of indicated cells were processed for double immunogold labeling with anti-ORF2 (visualized by 6-nm gold particles) and anti-ORF3 (visualized by 10-nm gold particles) antibodies, as indicated. Cryosections were next analyzed by EM. ORF2 proteins are indicated by black arrows and ORF3 proteins by arrowheads. N nucleus. Scale bars show the indicated length
Fig. 6
Fig. 6
Colocalization analysis of the ORF2i protein with different cell markers. PLC3/HEV and PLC3/HEV-ΔORF3 cells were fixed, permeabilized with methanol and TX-0.5% and double-stained with P1H1 and anti-cell markers antibodies, as indicated. a Manders' overlap coefficients (MOC) of ORF2 and cell marker labeling (n > 30 cells). Co-staining showing a low MOC are in light grey and those showing a medium MOC are in middle grey. Co-staining of PLC3/HEV cells showing a MOC > 0.4 are in dark grey and representative confocal images are shown in (b, Top). The co-staining of PLC3/HEV-ΔORF3 cells with P1H1 and antibodies directed against markers of recycling compartment are also shown in (b, Bottom). Staining was analyzed by confocal microscopy. Scale bar, 20 μm. PLC3/HEV cells double-stained with P1H1 and anti-Rab11 (c), anti-CD71 (d) or anti-MICAL-L1 (e) antibodies were next analyzed by confocal microscopy with a high-resolution Airyscan module. On the top, volume rendering of the 3D z-stacks (Surfacing) using Imaris is shown to better visualize the stained substructures. In the middle, z-stacks are shown. On the bottom, line graphs show the fluorescence intensities of ORF2i and Rab11/CD71/MICAL-L1 staining measured every 50 nm across the region of interest highlighted by the white line in the micrograph shown on the bottom left of each panel. Scale bars show the indicated length. Red = ORF2; Green = cell marker; Blue = DAPI
Fig. 7
Fig. 7
Co-distribution of HEV RNA and Rab11 in PLC3/HEV cells. PLC3/HEV and PLC3 mock cells were grown on coverslips, fixed at 3 d.p.e. and processed for in situ RNAscope hybridization. Cells were stained with a probe targeting HEV genomic RNA (RNA, red) and anti-Rab11 antibody (Rab11, green). Line graphs show the fluorescence intensities of RNA and Rab11 staining measured every 70 nm across the region of interest highlighted by the white line in the micrograph shown on the left. Nuclei are in blue. Scale bar, 20 μm. Manders' overlap coefficient (MOC) of the RNA labeling in the Rab11 labeling was calculated on at least 30 cells
Fig. 8
Fig. 8
Kinetics of colocalization of the ORF2i protein with transferrin. PLC3/HEV (a) and PLC3/HEV-ΔORF3 (b) cells were incubated with fluorochrome-conjugated transferrin (TrF) at 37 °C and fixed at indicated times. Cells were next permeabilized and stained with the P1H1 antibody. Staining was analyzed by confocal microscopy. Red = ORF2; Green = transferrin; Blue = DAPI. Scale bar, 20 μm. Manders' Overlap Coefficients (MOC) of ORF2 staining in TrF staining (n ≥ 50 cells) were calculated at each time point
Fig. 9
Fig. 9
EM analysis of the co-distribution of ORF2 and ORF3 proteins with cell markers. Cryosections of PLC3/HEV cells were processed for double immunogold labeling with 1E6 or anti-ORF3 (visualized by 10-nm gold particles) and anti-Rab11, anti-CD71 or anti-CD81 (visualized by 6 nm gold particles) antibodies, as indicated. Cryosections were next analyzed by EM. ORF2 and ORF3 proteins are indicated by black arrows and cell markers by arrowheads
Fig. 10
Fig. 10
Visualization of intracellular HEV like-particles. Cryosections of PLC3/HEV cells were immunogold-labeled with the indicated antibodies and analyzed by EM
Fig. 11
Fig. 11
Effect of Rab11 silencing on protein expression and HEV particle secretion. ad PLC3/HEV cells were transfected with siRNA targeting Rab11a and Rab11b (siRab11), with a non-targeting siRNA control (siCTL) or left non-transfected (NT). Non-electroporated PLC3 cells were used as controls (Mock). At 72 h post-transfection, cells were analyzed by IF (a) and WB (b) using the indicated antibodies. Staining were analyzed by confocal microscopy. Scale bar, 20 μm. Red = ORF2i stained by P1H1; Green = ORF3 or cell marker; Blue = DAPI. Manders’ overlap coefficients of ORF2i staining in ORF3, Rab11, CD71 or MICAL-L1 staining were calculated. c Quantification of HEV RNA in SN of transfected cells was performed by direct RT-qPCR (SN) and after IP with the P1H1 antibody (qIP-P1H1). d Production of extracellular and intracellular infectious particles in transfected cells was evaluated by viral titration. e PLC3 cells stably replicating a p6 subgenomic replicon were transfected with siRNAs as described above. At 72 h post-transfection, intracellular HEV RNA was quantified by RT-qPCR. Mock cells were used as a negative control. PLC3 cells harboring the replicon and treated with 20 μM of sofosbuvir were used as a positive control for replication inhibition. Values are means from three independent experiments (n = 3, mean ± S.D., Kruskal–Wallis with Dunn’s test), **p < 0.01

References

    1. Kamar N, Izopet J, Pavio N, et al. Hepatitis E virus infection. Nat Rev Dis Primers. 2017;3:17086. doi: 10.1111/trf.13355. - DOI - PubMed
    1. Doceul V, Bagdassarian E, Demange A, Pavio N. Zoonotic hepatitis E virus: classification animal reservoirs and transmission routes. Viruses. 2016;8:270. doi: 10.3390/v8100270. - DOI - PMC - PubMed
    1. Horvatits T, Wiesch JS, zur, Lütgehetmann M,, et al. The clinical perspective on hepatitis E. Viruses. 2019;11:617–619. doi: 10.3390/v11070617. - DOI - PMC - PubMed
    1. Lee G-H, Tan B-H, Teo EC-Y, et al. Chronic infection with camelid hepatitis E virus in a liver transplant recipient who regularly consumes camel meat and milk. Gastroenterology. 2016;150:355–7.e3. doi: 10.1053/j.gastro.2015.10.048. - DOI - PubMed
    1. Aslan AT, Balaban HY. Hepatitis E virus: epidemiology, diagnosis, clinical manifestations, and treatment. World J Gastroentero. 2020;26:5543–5560. doi: 10.3748/wjg.v26.i37.5543. - DOI - PMC - PubMed

LinkOut - more resources