. 2023 Jun 7;31(6):1756-1774.
doi: 10.1016/j.ymthe.2022.11.013. Epub 2022 Dec 2.

Anchoring super-enhancer-driven oncogenic lncRNAs for anti-tumor therapy in hepatocellular carcinoma

Affiliations

Anchoring super-enhancer-driven oncogenic lncRNAs for anti-tumor therapy in hepatocellular carcinoma

Xiao-Qing Yuan et al. Mol Ther. .

Abstract

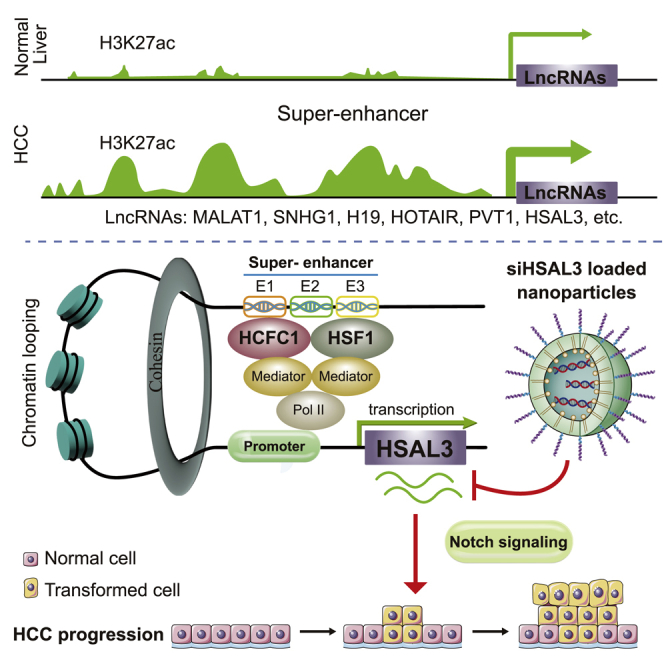
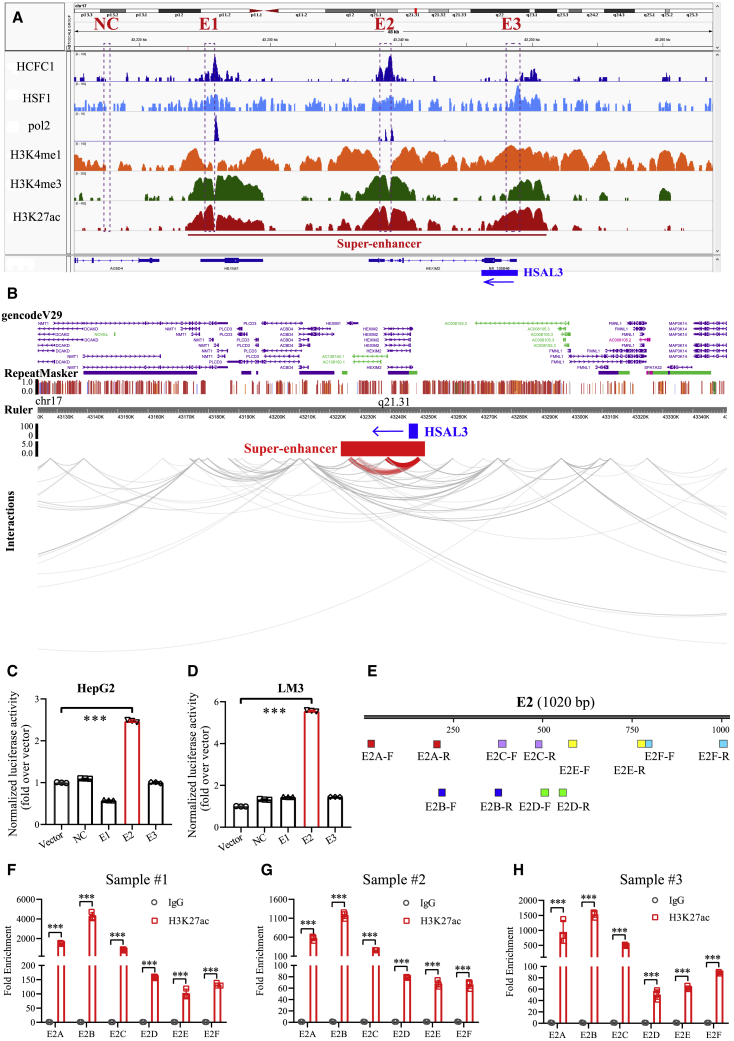
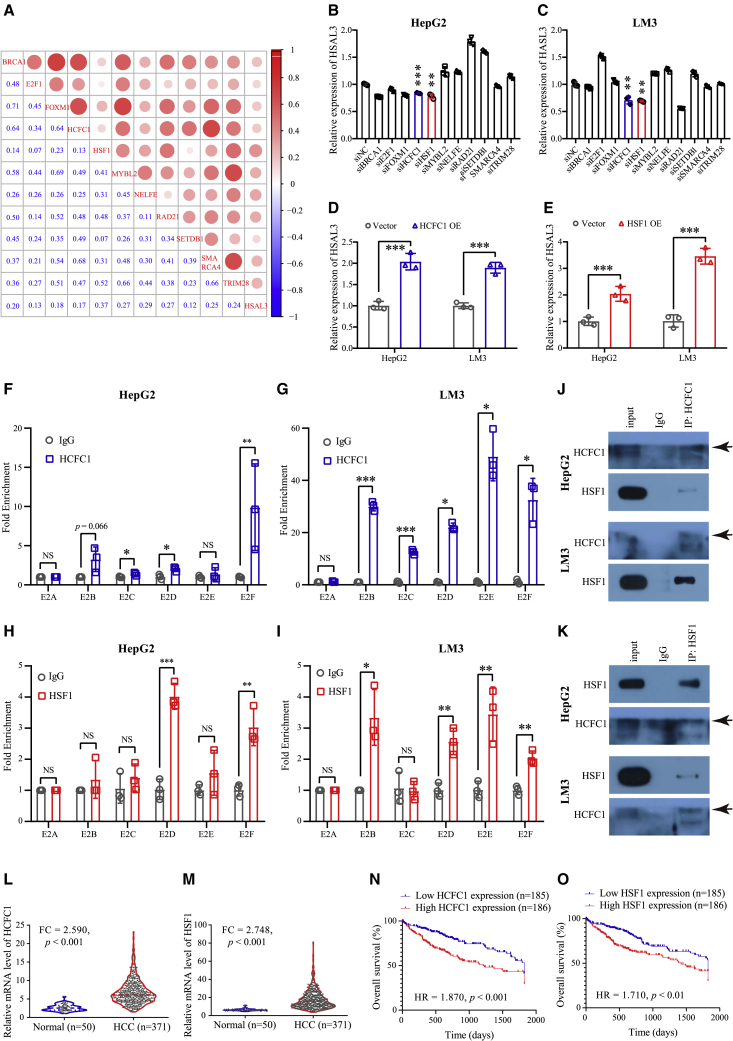
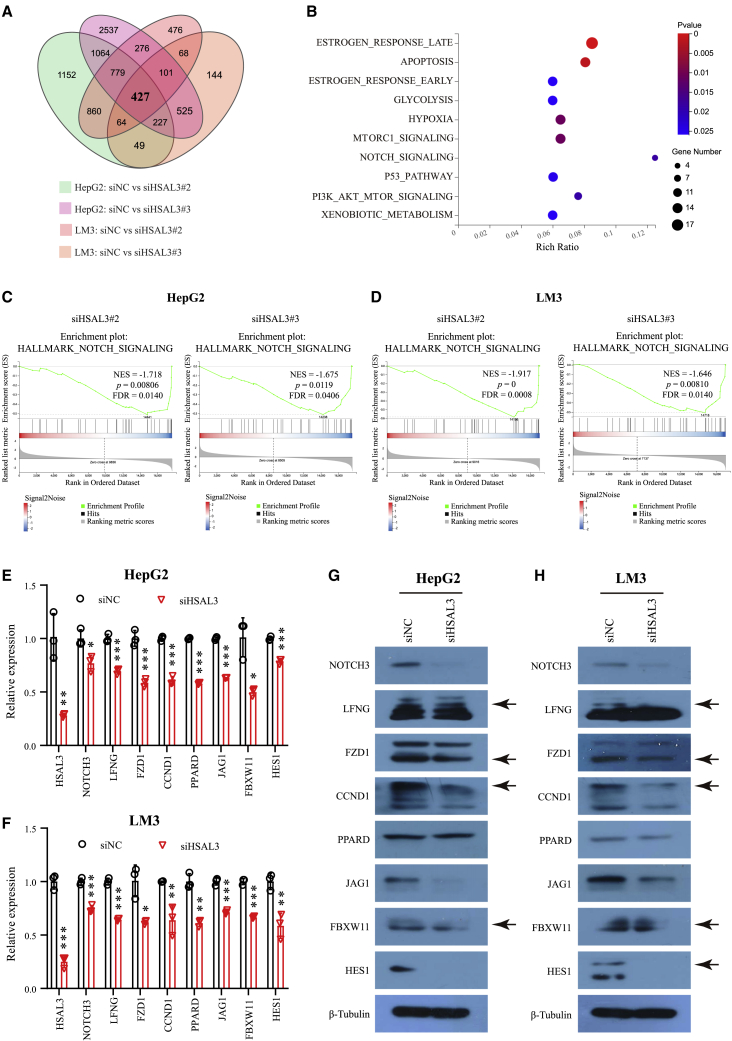
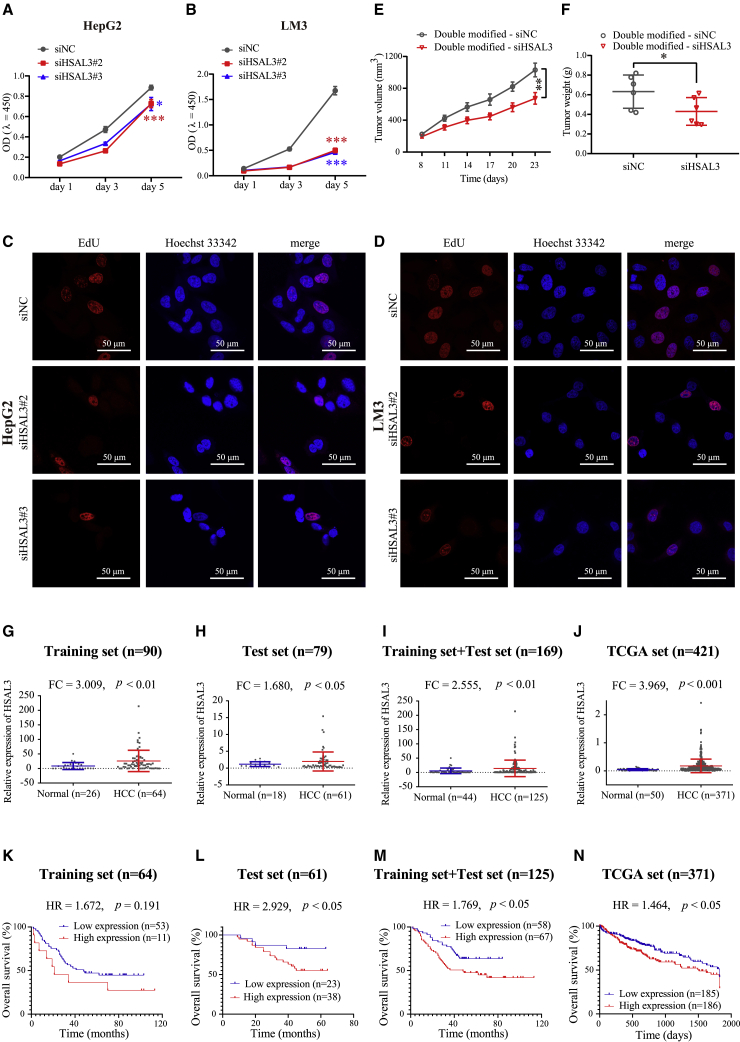
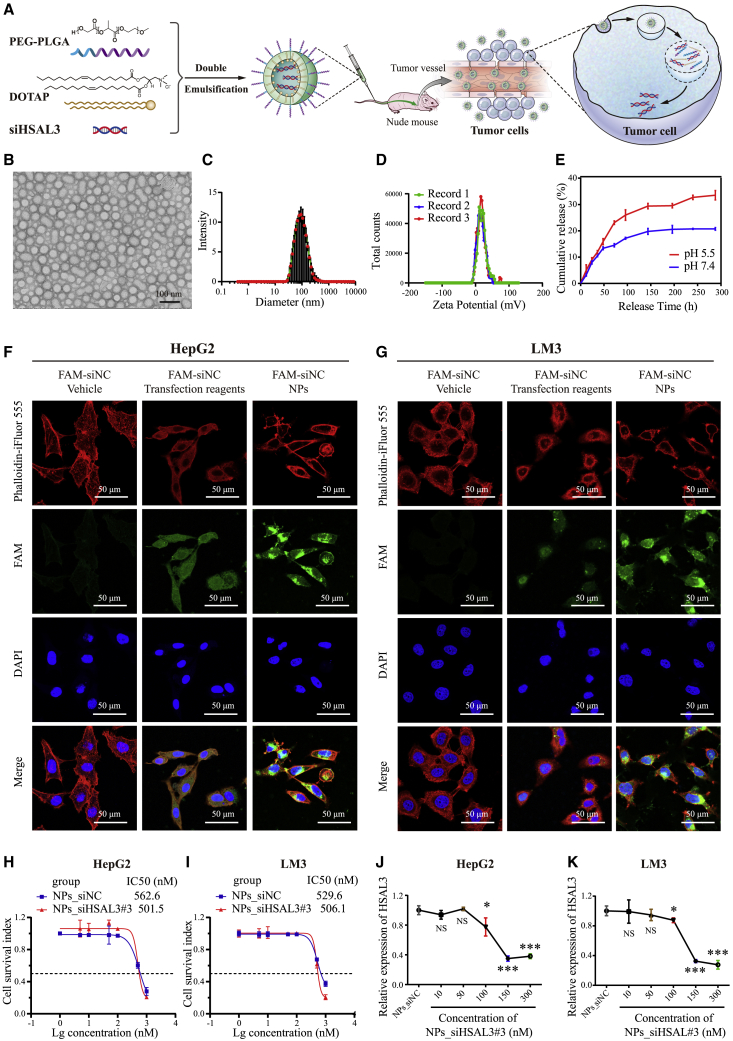
Super-enhancer (SE) plays a vital role in the determination of cell identity and fate. Up-regulated expression of coding genes is frequently associated with SE. However, the transcription dysregulation driven by SE, from the viewpoint of long non-coding RNA (lncRNA), remains unclear. Here, SE-associated lncRNAs in HCC are comprehensively outlined for the first time. This study integrally screens and identifies several novel SE-associated lncRNAs that are highly abundant and sensitive to JQ1. Especially, HSAL3 is identified as an uncharacterized SE-driven oncogenic lncRNA, which is activated by transcription factors HCFC1 and HSF1 via its super-enhancer. HSAL3 interference negatively regulates NOTCH signaling, implying the potential mechanism of its tumor-promoting role. The expression of HSAL3 is increased in HCC samples, and higher HSAL3 expression indicates an inferior overall survival of HCC patients. Furthermore, siHSAL3 loaded nanoparticles exert anti-tumor effect on HCC in vitro and in vivo. In conclusion, this is the first comprehensive survey of SE-associated lncRNAs in HCC. HSAL3 is a novel SE-driven oncogenic lncRNA, and siHSAL3 loaded nanoparticles are therapeutic candidates for HCC. This work sheds lights on the merit of anchoring SE-driven oncogenic lncRNAs for HCC treatment.

Keywords: HCC; HSAL3; enhancer; hepatocellular carcinoma; long non-coding RNA; nanoparticle; oncogene; super-enhancer; target therapy; transcription regulation.


Conflict of interest statement

Declaration of interests The authors declare no competing interests.

Figures

None
Graphical abstract
Figure 1
Figure 1
Integrative analysis of ChIP-seq and lncRNA-seq data to screen novel SE-associated oncogenic lncRNAs (A) Identification of SE-associated candidate lncRNAs in HCC. (B) H3K27ac ChIP-seq profiles of eight uncharacterized candidate lncRNAs in HepG2 and LM3 cells. (C and D) The expression level of candidate lncRNAs following JQ1 or vehicle treatment in HepG2 and LM3 cells (n = 4). PC, positive control. The results are presented as mean ± SD. ∗p < 0.05; ∗∗p < 0.01; ∗∗∗p < 0.001 by two-tailed Student’s t test. (E) Expression rank of all lncRNAs in HCC cells from CCLE database (https://portals.broadinstitute.org/ccle). Red dots denote candidate lncRNAs in HCC cells. (F and G) Effect of siRNAs interfering eight candidate lncRNAs on cell proliferation of HepG2 and LM3 cells, measured by CCK-8 assay (n = 4). The results are presented as mean ± SD. ∗p < 0.05; ∗∗p < 0.01; ∗∗∗p < 0.001 by two-tailed Student’s t test. (H) Effect of siRNAs interfering eight candidate lncRNAs on cell migration of HepG2 and LM3 cells, measured by Transwell assay. Scale bar, 100 μm.
Figure 2
Figure 2
Identification of HSAL3 as a novel SE-driven lncRNA in HCC (A) ChIP-seq profiles of HCFC1, HSF1, pol2, and indicated histone markers (H3K4me1, H3K4me3, and H3K27ac) in HepG2 cells. Three constituent enhancers (E1–E3) within the super-enhancer region were cloned into luciferase reporter vector pGL3-promoter. (B) ChIA-PET data displaying spatial interactions between the super-enhancer and promoter of HSAL3 in HepG2 cells. Results in (A) and (B) were respectively reanalyzed from ChIP-seq and ChIA-PET data of HepG2 cells from the ENCODE project (https://www.encodeproject.org/). (C and D) The luciferase activities of these three constituent enhancer elements in HepG2 and LM3 cells (n = 3). The results are presented as mean ± SD. ∗∗∗p < 0.001 by two-tailed Student’s t test. (E–H) ChIP assay of H3K27ac on the enhancer of HSAL3 in tissues from three liver cancer patients. ∗∗∗p < 0.001 by two-tailed Student’s t test.
Figure 3
Figure 3
HCFC1 and HSF1 directly bound to the SE of HSAL3 (A) Pearson correlation among the expression of candidate TFs and HSAL3 in HCC patients (n = 371). (B and C) qRT-PCR assay determining the expression of HSAL3 upon silencing of these candidate TFs in HepG2 and LM3 cells (n = 3). The results are presented as mean ± SD. ∗∗p < 0.01; ∗∗∗p < 0.001 by two-tailed Student’s t test. (D and E) qRT-PCR assay testing the effect of HCFC1 and HSF1 overexpression on HSAL3 expression in HepG2 and LM3 cells (n = 3). The results are presented as mean ± SD. ∗∗∗p < 0.001 by two-tailed Student’s t test. (F–I) ChIP assay of (F and G) HCFC1 and (H and I) HSF1 on the enhancer of HSAL3 in HepG2 and LM3 cells (n = 3). The results are presented as mean ± SD. NS, not significant; ∗p < 0.05; ∗∗p < 0.01; ∗∗∗p < 0.001 by two-tailed Student’s t test. (J) The protein interaction of HCFC1 with HSF1 in HepG2 and LM3 cells as determined by endogenous co-IP assay coupled with immunoblotting. (K) The protein interaction of HSF1 with HCFC1 in HepG2 and LM3 cells as validated by endogenous co-IP assay coupled with immunoblotting. (L and M) The expression of HCFC1 and HSF1 in HCC samples (n = 371) and normal liver tissues (n = 50). The p value was calculated by two-tailed Student’s t test. (N and O) Five-year overall survival of TCGA HCC patients (n = 371) stratified based on the expression of HCFC1 and HSF1, respectively. Results in (A) and (L–O) were analyzed based on the HCC dataset downloaded from TCGA (https://cancergenome.nih.gov/). The p value was calculated by Log rank (Mantel-Cox) test, and HR value was estimated by hazard ratio (Mantel-Haenszel).
Figure 4
Figure 4
NOTCH signaling acts as a candidate downstream pathway of HSAL3 in HCC cells (A) Overlapping differentially expressed genes (DEGs) among different siRNA groups between two HCC cells (filtered by Q-value ≤ 0.05). DEGs were evaluated by DESeq2 (Love et al.25). (B) Top 10 enriched KEGG pathways of the overlapping DEGs. KEGG analysis of DEGs was conducted by Phyper in R based on hypergeometric test. (C and D) NOTCH pathway was enriched by GSEA analysis in replicated HSAL3 interferences in both HCC cells. NES, Normalized enrichment score; FDR, false discovery rate. NES, p value, and FDR were evaluated by the GSEA software. (E and F) The effect of HSAL3 interference on mRNA level of NOTCH signaling related genes in HepG2 and LM3 cells (n = 3). ∗p < 0.05, ∗∗p < 0.01, ∗∗∗p < 0.001 by two-tailed Student’s t test. (G and H) The effect of HSAL3 interference on protein content of NOTCH signaling related genes in HepG2 and LM3 cells.
Figure 5
Figure 5
HSAL3 promoting HCC cell growth and metastasis indicated a poor prognosis of HCC patients (A and B) CCK-8 assay examining the effect of HSAL3 interference on proliferation ability of HepG2 and LM3 cells (n = 4). ∗p < 0.05; ∗∗∗p < 0.001 by two-tailed Student’s t test. (C and D) EdU assay examining the effect of HSAL3 interference on DNA synthesis of HepG2 and LM3 cells. Scale bar, 50 μm. (E) The growth and (F) weights of tumor xenograft after intratumor treatment with 2′-o-Me and 5′-cholesterol modified siHSAL3 or siNC (negative control). Six mice per group. ∗p < 0.05, ∗∗p < 0.01 by two-tailed Student’s t test. (G–J) Relative expression of HSAL3 was significantly higher in HCC tissues than in normal liver tissues in training set (n Normal = 26; n HCC = 64), test set (n Normal = 18; n HCC = 61), training set + test set (n Normal = 44; n HCC = 125), and TCGA HCC set (n Normal = 50; n HCC = 371), respectively. The p value was calculated by two-tailed Student’s t test. (K–N) Kaplan-Meier survival curves of overall survival (OS) or 5-year OS based on HSAL3 expression in HCC patients in training set (n HCC = 64), test set (n HCC = 61), training set + test set (n HCC = 125), and TCGA HCC set (n HCC = 371). The p value was calculated by Log rank (Mantel-Cox) test, and HR value was estimated by hazard ratio (Mantel-Haenszel). Results in (J) and (N) were analyzed based on the HCC dataset downloaded from TCGA (https://cancergenome.nih.gov/).
Figure 6
Figure 6
Synthesis and characterization of siHSAL3 loaded NPs (A) Molecular structures of PEG-PLGA, DOTAP, and siRNA, and schematic illustration of the nanoparticles (NPs) platform for systemically delivery of siRNA for HCC treatment. (B) Morphology of NPs_FAM-siNC observed by transmission electron microscope. Scale bar, 100 nm. (C) Diameter and (D) Zeta Potential of NPs_FAM-siNC calculated by Nano ZSE. (E) Cumulative siRNA release from NPs_FAM-siNC incubated in PB buffer at a pH of 5.5 or 7.4. (F and G) Cellular uptake assay exhibiting DNA uptake of HepG2 and LM3 cells treated respectively with FAM-siNC, FAM-siNC transfected with transfection reagent, and NPs_FAM-siNC for 6 h. The cytoskeleton was labeled by Phalloidin-iFluor 555, and the cytonuclear was marked by DAPI. Scale bar, 50 μm. (H and I) The IC50 of NPs_siNC and NPs_siHSAL3 in HepG2 and LM3 cells (n = 5). NPs_siNC was used as a negative control. (J and K) The expression of HSAL3 in HepG2 and LM3 cells treated with NPs_siHSAL3 at different concentrations (n = 4). NS, not significant; ∗p < 0.05; ∗∗∗p < 0.001 by two-tailed Student’s t test. NPs, blank nanoparticles; NPs_siNC, siNC loaded NPs; NPs_FAM-siNC, FAM-siNC loaded NPs; NPs_siHSAL3, siHSAL3 loaded NPs.
Figure 7
Figure 7
NPs-mediated HSAL3 silencing suppressed HCC cell proliferation in vitro (A and B) HSAL3 expression measured by qRT-PCR in HepG2 and LM3 cells with indicated treatments (n = 4). NS, not significant; ∗∗∗p < 0.001 by two-tailed Student’s t test. (C and D) Cell proliferation ability measured by CCK-8 assay in HepG2 and LM3 cells with indicated treatments (n = 4). ∗∗p < 0.01; ∗∗∗p < 0.001 by two-tailed Student’s t test. (E and F) Cell number of HepG2 and LM3 cells with indicated treatments (n = 4). NS, not significant; ∗p < 0.05; ∗∗p < 0.01; ∗∗∗p < 0.001 by two-tailed Student’s t test. (G and H) DNA synthesis measured by EdU assay in HepG2 and LM3 cells with indicated treatments. NPs, blank nanoparticles; NPs_siNC, negative control; NPs_siHSAL3, siHSAL3 loaded NPs. Scale bar, 50 μm.
Figure 8
Figure 8
NPs-mediated HSAL3 silencing diminished xenogeneic growth of HCC cells in vivo (A) Systemic illustration of tumor inoculation and intravenous injections in the HCC cell tumor-bearing nude mice. (B) Tumor xenograft growth and (C) tumor xenograft weights after systemic treatment with vehicle, NPs, NPs_siNC (negative control), NPs_siHSAL3, and oxaliplatin. Six mice per group. NS, not significant; ∗p < 0.05 by two-tailed Student’s t test. (D) H&E, (E) Ki67, and (F) TUNEL staining of tumor tissues; representative H&E staining images are under ×200 magnification (scale bar, 100 μm), and other staining images are under ×400 magnification (scale bar, 100 μm). (G) Graphical illustration of the comprehensive identification of SE-associated lncRNAs in HCC (up). HSAL3 is identified as a novel SE-driven oncogenic lncRNA, which is activated by transcription factors HCFC1 and HSF1 via its super-enhancer (below). HSAL3 interference negatively regulates NOTCH signaling, implying the potential mechanism of its tumor-promoting role (below). Furthermore, siHSAL3 loaded nanoparticles exert anti-tumor effect on HCC (below). NPs, blank NPs; NPs_siNC, NPs loading with siNC; NPs_siHSAL3, NPs loading with siHSAL3.

References

    1. Sung H., Ferlay J., Siegel R.L., Laversanne M., Soerjomataram I., Jemal A., et al. Global cancer statistics 2020: GLOBOCAN estimates of incidence and mortality worldwide for 36 cancers in 185 countries. CA Cancer J. Clin. 2021;71:209–249. - PubMed
    1. Feng R.M., Zong Y.N., Cao S.M., Xu R.H. Current cancer situation in China: good or bad news from the 2018 Global Cancer Statistics? Cancer Commun. (Lond) 2019;39:22. - PMC - PubMed
    1. Siegel R.L., Miller K.D., Fuchs H.E., Jemal A. Cancer statistics, 2021. CA Cancer J. Clin. 2021;71:7–33. - PubMed
    1. Llovet J.M., Kelley R.K., Villanueva A., Singal A.G., Pikarsky E., Roayaie S., Lencioni R., Koike K., Zucman-Rossi J., Finn R.S. Hepatocellular carcinoma. Nat. Rev. Dis. Primers. 2021;7:6. - PubMed
    1. Huang A., Yang X.R., Chung W.Y., Dennison A.R., Zhou J. Targeted therapy for hepatocellular carcinoma. Signal Transduct. Target. Ther. 2020;5:146. - PMC - PubMed

MeSH terms