

Assessment of epicardial adipose tissue on virtual non-contrast images derived from photon-counting detector coronary CTA datasets
- PMID: 36462042
- PMCID: PMC10017616
- DOI: 10.1007/s00330-022-09257-6
Assessment of epicardial adipose tissue on virtual non-contrast images derived from photon-counting detector coronary CTA datasets
Abstract
Objectives: To assess epicardial adipose tissue (EAT) volume and attenuation of different virtual non-contrast (VNC) reconstructions derived from coronary CTA (CCTA) datasets of a photon-counting detector (PCD) CT-system to replace true non-contrast (TNC) series.
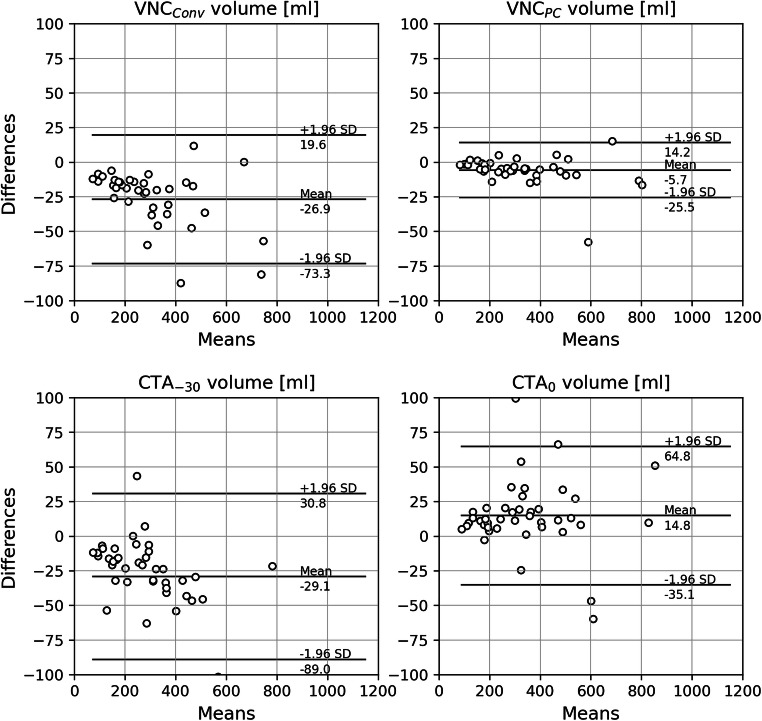
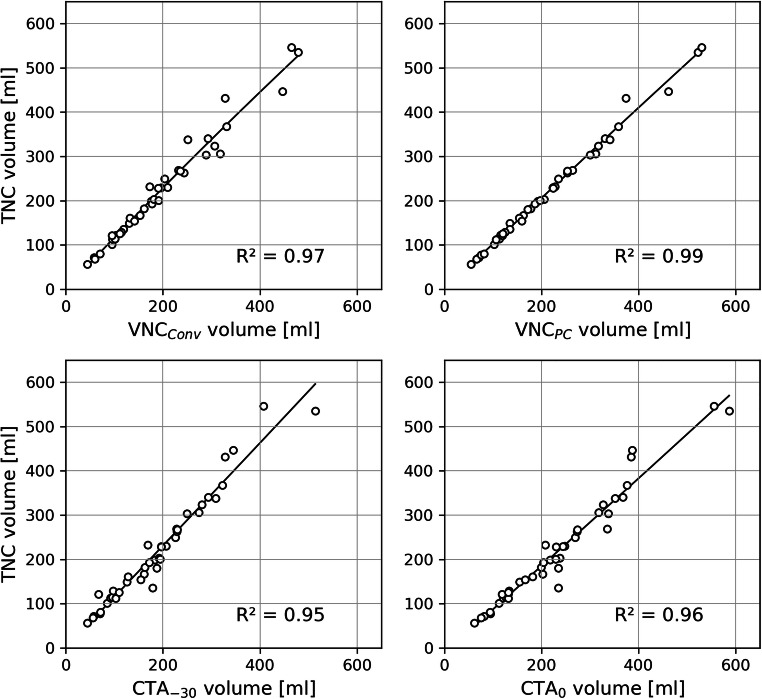
Methods: Consecutive patients (n = 42) with clinically indicated CCTA and coronary TNC were included. Two VNC series were reconstructed, using a conventional (VNCConv) and a novel calcium-preserving (VNCPC) algorithm. EAT was segmented on TNC, VNCConv, VNCPC, and CCTA (CTA-30) series using thresholds of -190 to -30 HU and an additional segmentation on the CCTA series with an upper threshold of 0 HU (CTA0). EAT volumes and their histograms were assessed for each series. Linear regression was used to correlate EAT volumes and the Euclidian distance for histograms. The paired t-test and the Wilcoxon signed-rank test were used to assess differences for parametric and non-parametric data.
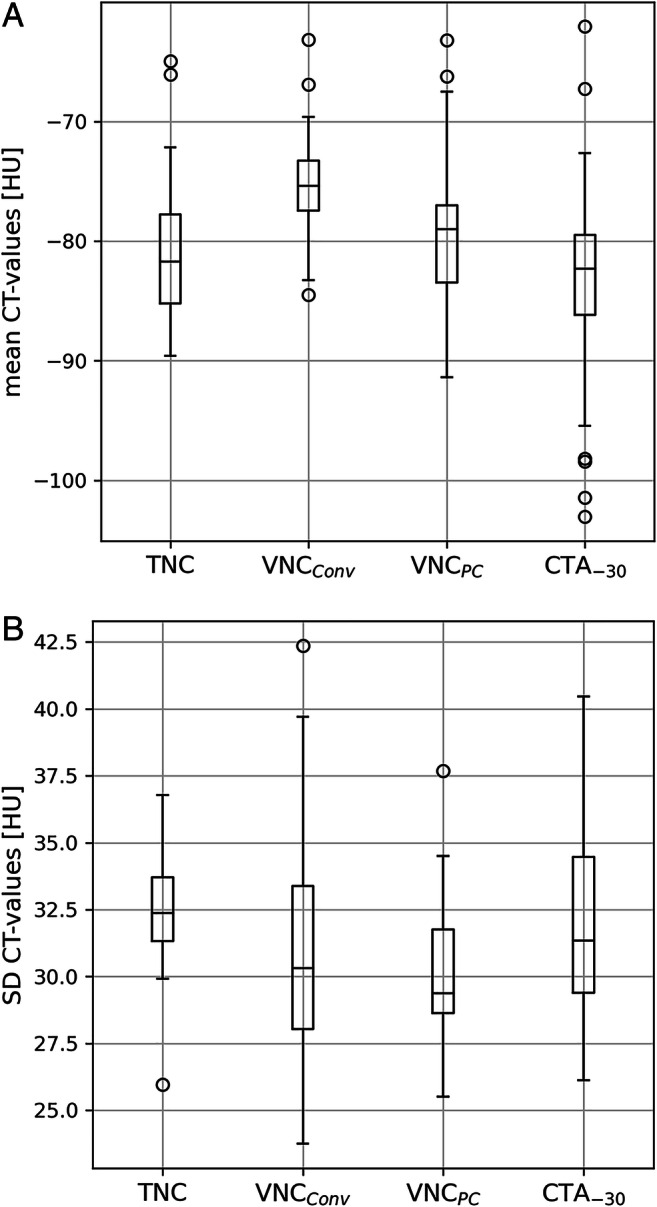
Results: EAT volumes from VNC and CCTA series showed significant differences compared to TNC (all p < .05), but excellent correlation (all R2 > 0.9). Measurements on the novel VNCPC series showed the best correlation (R2 = 0.99) and only minor absolute differences compared to TNC values. Mean volume differences were -12%, -3%, -13%, and +10% for VNCConv, VNCPC, CTA-30, and CTA0 compared to TNC. Distribution of CT values on VNCPC showed less difference to TNC than on VNCConv (mean attenuation difference +7% vs. +2%; Euclidean distance of histograms 0.029 vs. 0.016).
Conclusions: VNCPC-reconstructions of PCD-CCTA datasets can be used to reliably assess EAT volume with a high accuracy and only minor differences in CT values compared to TNC. Substitution of TNC would significantly decrease patient's radiation dose.
Key points: • Measurement of epicardial adipose tissue (EAT) volume and attenuation are feasible on virtual non-contrast (VNC) series with excellent correlation to true non-contrast series (all R2>0.9). • Differences in VNC algorithms have a significant impact on EAT volume and CT attenuation values. • A novel VNC algorithm (VNCPC) enables reliable assessment of EAT volume and attenuation with superior accuracy compared to measurements on conventional VNC- and CCTA-series.
Keywords: Adipose tissue; Computed tomography angiography; Heart; Medical image processing; Radiation dosage.
© 2022. The Author(s).
Conflict of interest statement
The authors of this manuscript declare relationships with the following companies:
Prof. Kroencke discloses receives institutional research support from Siemens Healthineers and Dr. Schwarz has received speaker honoraria from Siemens Healthineers. All other authors of this manuscript declare no relationships with any companies whose products or services may be related to the subject matter of the article.
Figures


Similar articles
-
CT radiomic features reproducibility of virtual non-contrast series derived from photon-counting CCTA datasets using a novel calcium-preserving reconstruction algorithm compared with standard non-contrast series: focusing on epicardial adipose tissue.Int J Cardiovasc Imaging. 2024 Jun;40(6):1257-1267. doi: 10.1007/s10554-024-03096-w. Epub 2024 Apr 8. Int J Cardiovasc Imaging. 2024. PMID: 38587689
-
Virtual Non-Contrast Reconstructions of Photon-Counting Detector CT Angiography Datasets as Substitutes for True Non-Contrast Acquisitions in Patients after EVAR-Performance of a Novel Calcium-Preserving Reconstruction Algorithm.Diagnostics (Basel). 2022 Feb 22;12(3):558. doi: 10.3390/diagnostics12030558. Diagnostics (Basel). 2022. PMID: 35328111 Free PMC article.
-
Multiphase photon counting detector CT data sets - Which combination of contrast phase and virtual non-contrast algorithm is best suited to replace true non-contrast series in the assessment of active bleeding?Eur J Radiol. 2023 Nov;168:111125. doi: 10.1016/j.ejrad.2023.111125. Epub 2023 Sep 30. Eur J Radiol. 2023. PMID: 37804649
-
Virtual non-contrast series of photon-counting detector computed tomography angiography for aortic valve calcium scoring.Int J Cardiovasc Imaging. 2024 Apr;40(4):723-732. doi: 10.1007/s10554-023-03040-4. Epub 2024 Jan 4. Int J Cardiovasc Imaging. 2024. PMID: 38175389 Free PMC article.
-
Dual-energy Computed Tomography in Coronary Artery Calcium Scoring.Heart Views. 2024 Apr-Jun;25(2):74-79. doi: 10.4103/heartviews.heartviews_24_24. Epub 2024 Oct 10. Heart Views. 2024. PMID: 39619105 Free PMC article. Review.
Cited by
-
Cardiac computed tomography with late contrast enhancement: A review.Heliyon. 2024 Jun 4;10(11):e32436. doi: 10.1016/j.heliyon.2024.e32436. eCollection 2024 Jun 15. Heliyon. 2024. PMID: 38933964 Free PMC article. Review.
-
Spectral Photon-Counting Computed Tomography: Technical Principles and Applications in the Assessment of Cardiovascular Diseases.J Clin Med. 2024 Apr 18;13(8):2359. doi: 10.3390/jcm13082359. J Clin Med. 2024. PMID: 38673632 Free PMC article. Review.
-
Spectral Imaging Techniques in Heart Disease Assessment Using Photon-Counting Detector Computed Tomography.Echocardiography. 2025 Aug;42(8):e70177. doi: 10.1111/echo.70177. Echocardiography. 2025. PMID: 40824173 Free PMC article. Review.
-
Perivascular adipose tissue as a source of therapeutic targets and clinical biomarkers.Eur Heart J. 2023 Oct 12;44(38):3827-3844. doi: 10.1093/eurheartj/ehad484. Eur Heart J. 2023. PMID: 37599464 Free PMC article. Review.
-
Synthetic hematocrit from virtual non-contrast images for myocardial extracellular volume evaluation with photon-counting detector CT.Eur Radiol. 2024 Dec;34(12):7845-7855. doi: 10.1007/s00330-024-10865-7. Epub 2024 Jun 27. Eur Radiol. 2024. PMID: 38935123 Free PMC article.
References
-
- Brandt V, Decker J, Schoepf UJ, et al. Additive value of epicardial adipose tissue quantification to coronary CT angiography–derived plaque characterization and CT fractional flow reserve for the prediction of lesion-specific ischemia. Eur Radiol. 2022;32:4243–4252. doi: 10.1007/s00330-021-08481-w. - DOI - PubMed
MeSH terms
LinkOut - more resources
Full Text Sources
Medical
Miscellaneous
