. 2022 Dec 21;13(12):1048-1064.e7.
doi: 10.1016/j.cels.2022.11.003. Epub 2022 Dec 2.

Lactate-dependent chaperone-mediated autophagy induces oscillatory HIF-1α activity promoting proliferation of hypoxic cells

Affiliations

Lactate-dependent chaperone-mediated autophagy induces oscillatory HIF-1α activity promoting proliferation of hypoxic cells

Kshitiz et al. Cell Syst. .

Abstract

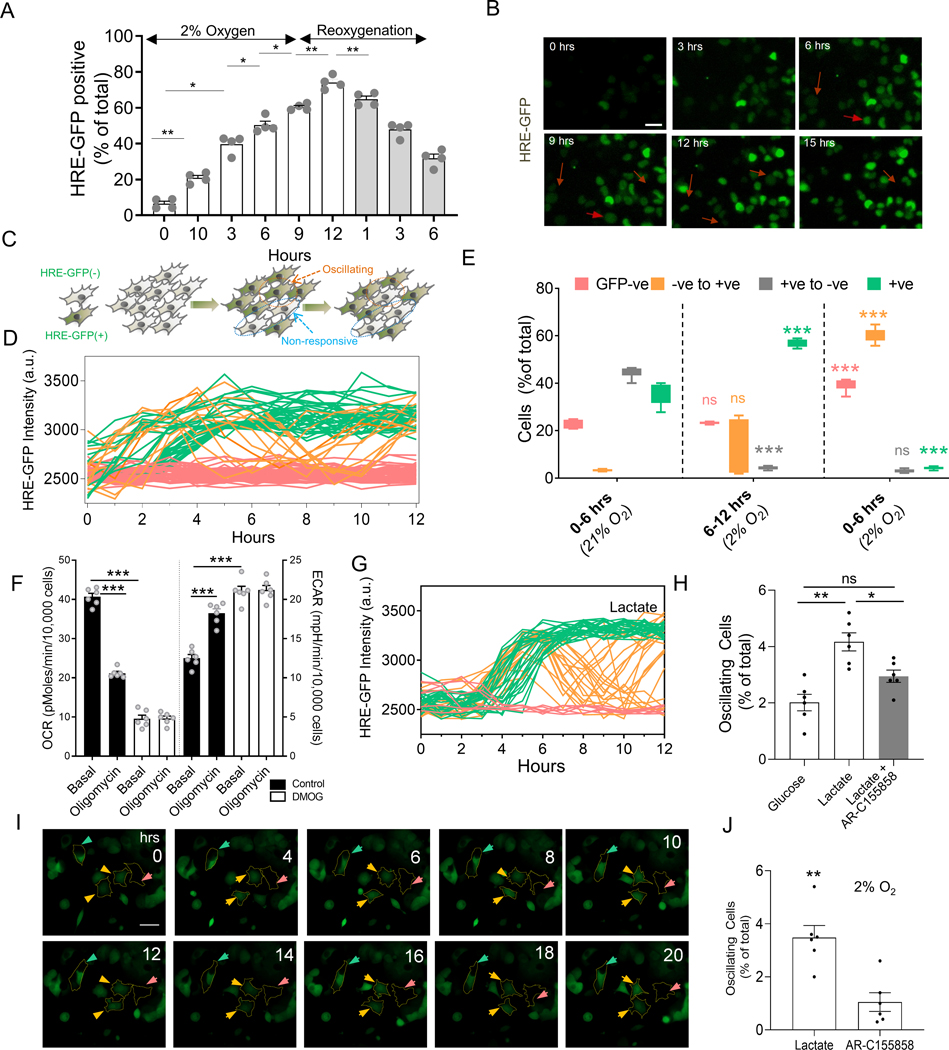
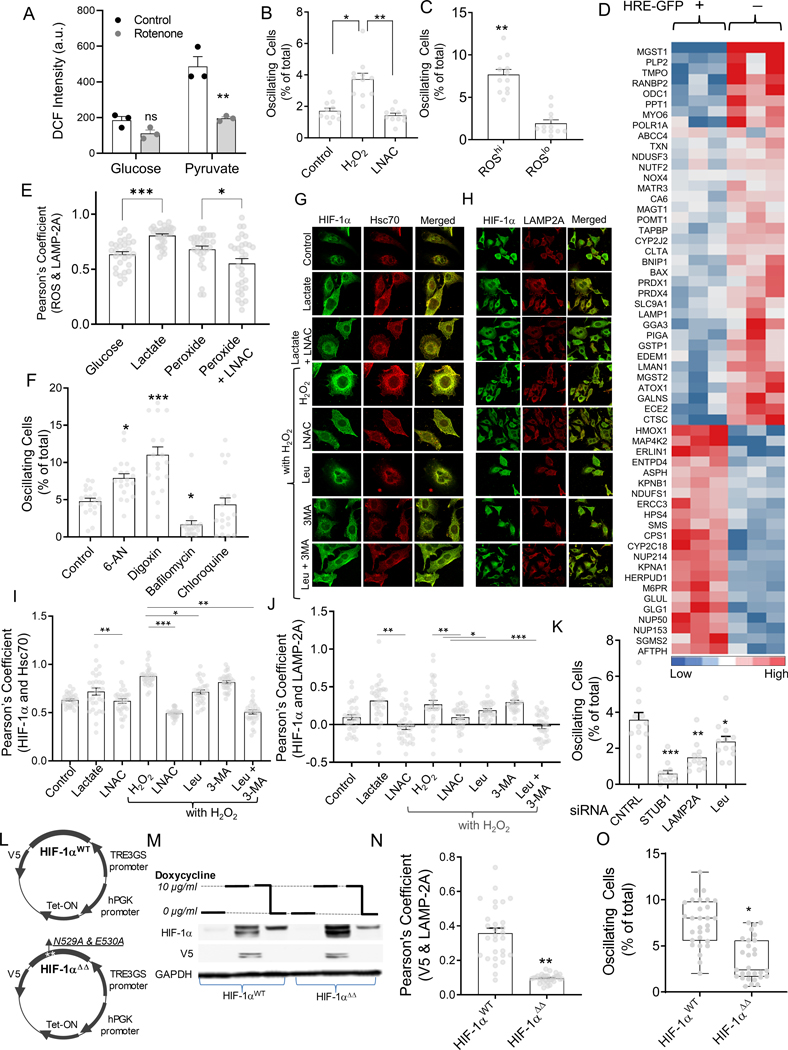
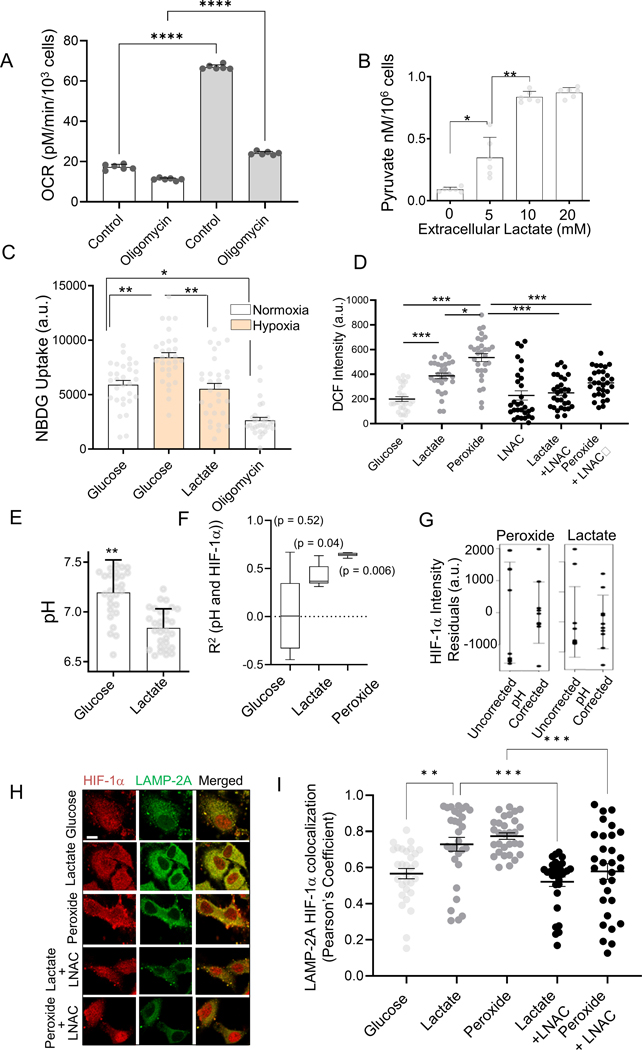
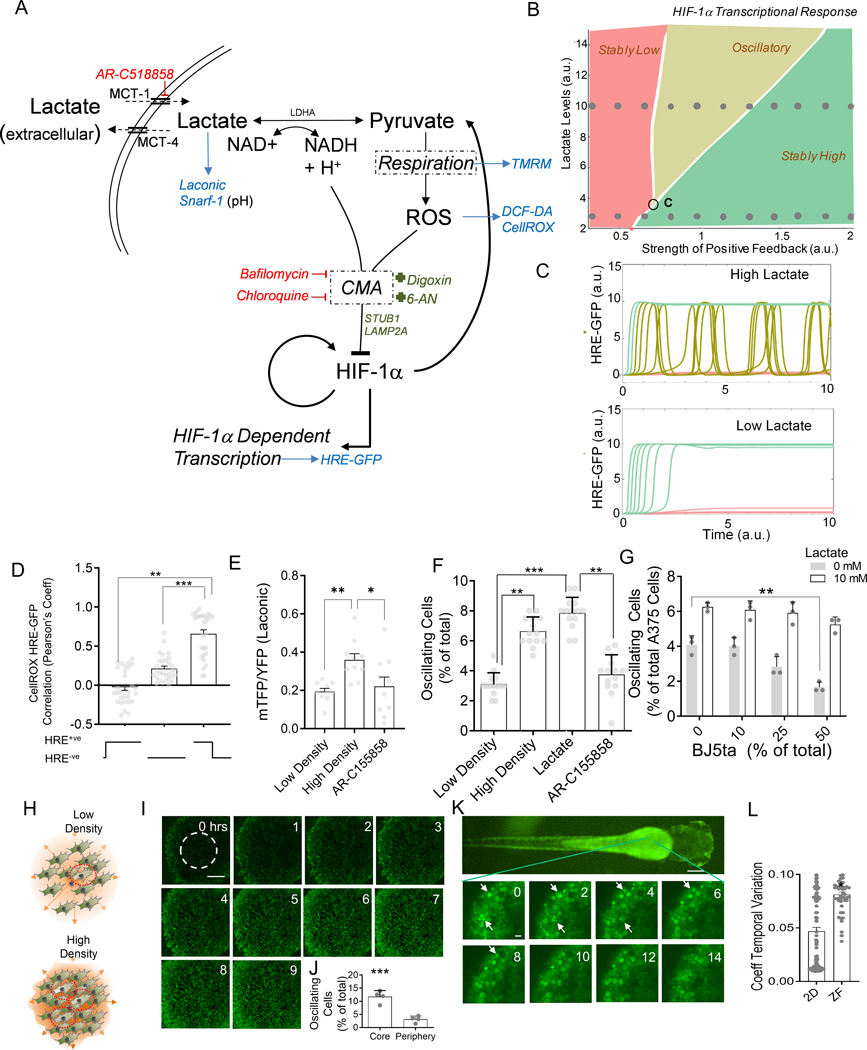
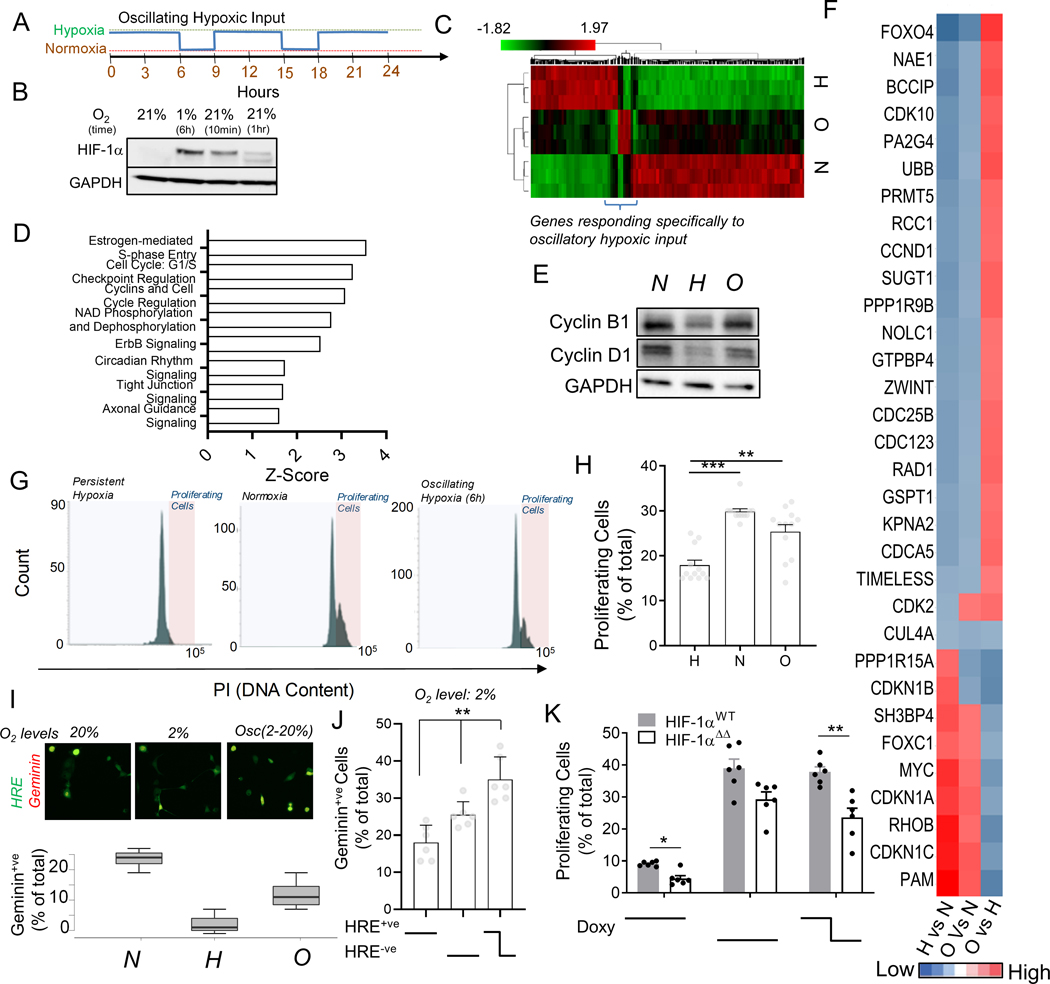
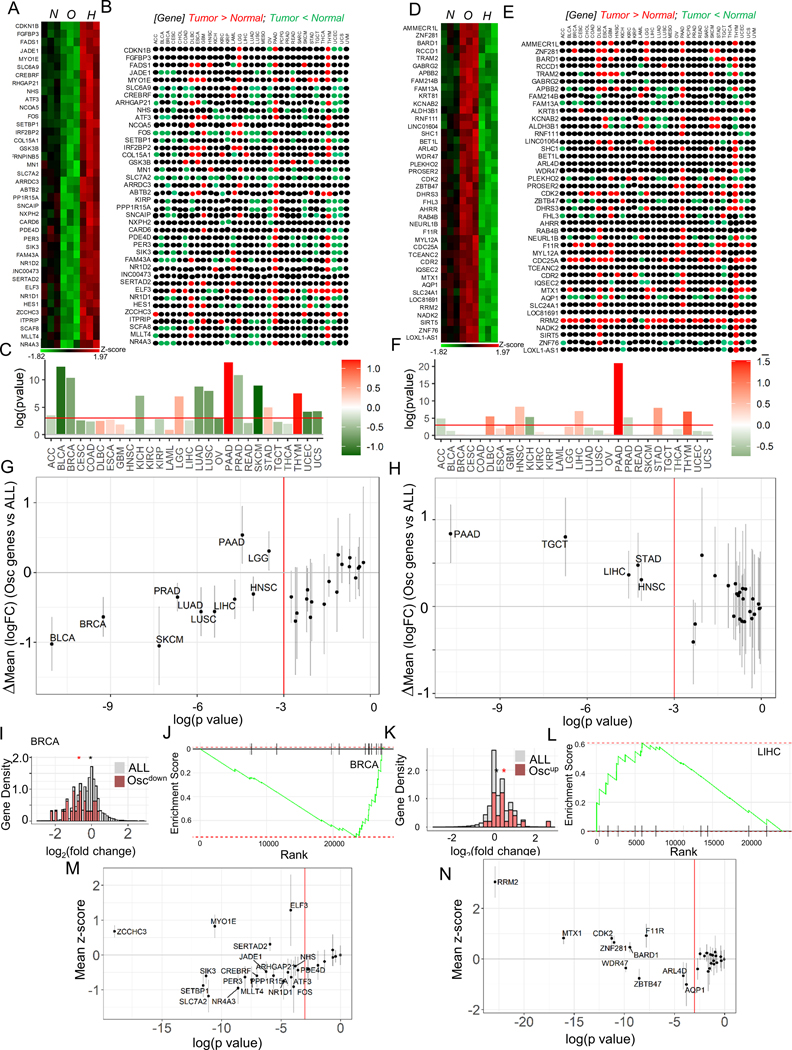
Response to hypoxia is a highly regulated process, but little is known about single-cell responses to hypoxic conditions. Using fluorescent reporters of hypoxia response factor-1α (HIF-1α) activity in various cancer cell lines and patient-derived cancer cells, we show that hypoxic responses in individual cancer cells can be highly dynamic and variable. These responses fall into three classes, including oscillatory activity. We identify a molecular mechanism that can account for all three response classes, implicating reactive-oxygen-species-dependent chaperone-mediated autophagy of HIF-1α in a subset of cells. Furthermore, we show that oscillatory response is modulated by the abundance of extracellular lactate in a quorum-sensing-like mechanism. We show that oscillatory HIF-1α activity rescues hypoxia-mediated inhibition of cell division and causes broad suppression of genes downregulated in cancers and activation of genes upregulated in many cancers, suggesting a mechanism for aggressive growth in a subset of hypoxic tumor cells.

Keywords: HIF; ROS; Warburg and reverse Warburg effect; cancer microenvironment; chaperone-mediated autophagy; hypoxia; hypoxic oscillations; lactate; quorum sensing; reactive oxygen species.


Conflict of interest statement

Declaration of interests The authors declare no competing interests.

Figures

Fig 1.
Fig 1.. Single cell responses to hypoxia display complex and varied dynamic profiles.
(A) Time course analysis of HRE-GFP transfected HEK293 cells exposed to hypoxia (2% O2) for 12 hours, followed by reoxygenation for 6 hours; n > 500 cells from 4 experiments (exp); (B) Representative time course images of HRE-GFP in HEK293 cells in sustained hypoxia show a subset of cells exhibit reduction in HRE-GFP levels (arrowheads); Scale bar = 25μm. (C) Schematic showing putative dynamic diversity of HRE responses, with a subset of cells switching from HRE-GFPhi to HRE-GFPlo state. (D) Representative HRE-GFP intensity traces in HEK293 cells in 12 hours of hypoxia, showing cells that remain in HRE-GFPlo state (red), those that monotonically increase and maintain their HRE-GFP levels (green), and those that exhibit oscillations between HRE-GFPhi to HRE-GFPlo (orange); (E) Live cell imaging analysis of HRE-GFP transitions in sustained hypoxia (12 hours) followed by reoxygenation (6 hours); Shown is percentage of HEK293 cells in 6 hours segments belonging to subclasses in D; statistical significance shown for each subclass (colored) vs previous 6h time segment; n = 7 exp with more than 500 cells/exp. (F) Live metabolic analysis by Seahorse of HeLa cells shows oxygen consumption rate (OCR) decreases following 5 mM DMOG treatment vs control, and rate of acid efflux (ECAR) levels increase with DMOG treatment similar to oligomycin treatment; n = 6 exp; (G) Representative traces of HRE-GFP intensity in HEK293 cells in low density for 18 hours in hypoxia with 10 mM lactate (colors are defined as in (D)). (H) Fractions of HEK293 cells displaying HRE-GFP oscillation during 12 hours of hypoxia in 25 mM glucose, 10 mM lactate (without or with 100 nM AR-C155858, an inhibitor against MCT-1 transporter); n = 5 exp; (I) Imaging of HRE-GFP patient-derived breast cancer cells in the presence of 10mM lactate; colored arrows point to bounded cells representative of stably high (green), stably low (pink), and oscillating (orange) response; Phase-contrast images shown in Fig S1L; (J) Percentage of oscillating patient-derived cells with lactate, without or with AR-155858; n = 6 exp (>300 cells/exp). Error bars: s.e.m.; *: p < 0.05, **: p < 0.01, ***: p < 0.001.
Fig 2.
Fig 2.. ROS-induced CMA controls HIF-1α dynamics in hypoxic cells.
(A-D) ROS increases oscillations in HIF-1α activity; (A) Average DCF-DA intensities in HeLa cells cultured with 25 mM glucose or pyruvate, before and after treatment with Rotenone for 30 minutes; n = 3 exp; (B) Fraction of HRE-GFP cells displaying oscillation in the presence of 5 μM H2O2 with or without 1 mM LNAC; n = 10 exp; (C) Fraction of oscillatory cells in subpopulations sorted for high CellROX and low CellROX, imaged after 6 hours subsequent to sorting; n =12 exp. (D) Microarray analysis of gene transcripts related to redox, and chaperone-mediated autophagy (CMA) pathways in HypoxCR-HEK293 cells cultured in hypoxia for 12 hours, and sorted for GFPhi and GFPlo levels. (E-J) ROS induced CMA mediates HIF-1α oscillations; (E) Pearson’s coefficient of correlation between ROS levels and LAMP-2A levels in individual HeLa cells shown on the right; n > 28 cells; (F) Percentage of oscillating cells in the presence of activators (50 mM 6-AN, and 200 nM Digoxin), and inhibitors of lysosomal degradation (10nM Bafilomycin, and 50 μM Chloroquin). (G-H) Representative images showing HIF-1α, along with lysosomal Hsc70 13D3 (G), and LAMP-2A (H) in HeLa cells cultured for 12 hours in 1% O2, 10 mM lactate, lactate with LNAC, as well as 25 μm H2O2 without or with LNAC, or CMA inhibitor Leupeptin (50 μM); (I-J) Pearson’s coefficient for colocalization of lysosomal Hsc70, or LAMP-2A and HIF-1α; n = 30 cells; (K) Live cell imaging analysis of GFP oscillations in HIF-1α-GFP transfected HeLa cells cultured in hypoxia (control), or with Leupeptin (50 μM), or after siRNA mediated knockdown of STUB1 and LAMP-2A; n = 12 cells; (L) Schematic showing plasmid maps for HIF-1αWT and HIF-1αΔΔ with mutation in the KFERQ-like motif in the HIF-1α encoding sequence. (M) Immunoblot showing abundance of V5 tagged-HIF-1α, and total HIF-1α in HIF-1αWT and HIF-1αΔΔ cells maintained in 5% O2 and treated with doxycline for 8 hours and then withdrawn for 2 hours; GAPDH shown as loading control; (N) Pearson’s coefficient of correlation between HIF-1α and LAMP-2A in HeLa cells stably expressing HIF-1αWT and HIF-1αΔΔ; n > 25 cells; (O) Live cell imaging analysis of GFP oscillations in HeLa cells transduced with wild-type HIF-1αWT and mutated HIF-1αΔΔ; n > 20 samples. Error bars: s.e.m.; *: p < 0.05, **: p < 0.01, ***: p < 0.001.
Fig 3.
Fig 3.. HIF-1α dynamics is regulated by lactate through control of intracellular ROS and pH.
(A) Oxygen consumption rate (OCR) in HeLa cells with 10 mM glucose, or 10 mM lactate + 5 mM glucose, or oligomycin; n = 6 exp; (B) Intracellular pyruvate levels in HeLa cells to extracellular lactate after 12 hours; n = 6 exp; (C) NBDG uptake in HEK293 cells in normoxia or hypoxia, with10 mM lactate in 12 hours; n = 30 cells; (D) Average DCF intensity in HeLa cells cultured in medium containing a combination of glucose, lactate, H2O2, and LNAC after 12 hours; n > 25 cells. (E-G) Lactate mediated acidosis contributes to variation in HRE-GFP levels; (E) Intracellular pH (pHi, measured by Snarf-1 dye) of HeLa cells in the presence of glucose, lactate, H2O2, and LNAC; n = 30 cells; (F) Correlation of pHi and HIF-1α-GFP levels in HeLa cells cultured in glucose, lactate, or H2O2; (G) Spread in HIF-1α-GFP intensities attributed to pH-mediated degradation; Total noise is the observed GFP intensity values minus the mean; pH corrected noise is the residual deviation remaining after regressing to the pH; error bars denote one standard deviation on each side; n = 10 samples. (H) Representative immunostained confocal images showing colocalization of LAMP-2A and HIF-1α-GFP in HeLa cells treated with 10nM Bafilomycin, and cultured for 12 hours in the presence of glucose, lactate, and H2O2 without, or in the presence of LNAC; green: LAMP-2A, red: HIF-1α-GFP; Scale bar = 2 μm; Pearson’s coefficient of spatial correlation shown in (I); Concentrations where applicable: 25 mM glucose; or 2 mM glucose added to 10 mM lactate, 25 μM H2O2, 10mM LNAC; n = 30 cells. Error bars: s.e.m.; *: p < 0.05, **: p < 0.01, ***: p < 0.001.
Fig 4.
Fig 4.. Modeling CMA mediated HIF-1α degradation accounts for diverse dynamics in HIF-1α activity mediated by cell density.
(A) Hypothesized molecular circuit controlling the dynamics of HIF-1α responses; CMA: chaperone mediated autophagy; Also listed are the main perturbations used in the study: Red: inhibitors, Green: activators, Blue: reporters. (B) Bifurcation diagram of the mathematical model corresponding to (A), see Methods, demonstrating existence of different dynamic response modes; ‘C’ denotes the critical point of the phase diagram corresponding to the onset of oscillatory responses; (C) Model predictions for dynamic HRE-GFP intensity profiles in hypoxic cells in the presence of low and high levels of lactate; Traces correspond to the sets of parameter values indicated by two rows of circular dots in the bifurcation diagram in (B). (D) Pearson’s coefficient showing correlation of HRE-GFP and CellROX levels; n = 30 cells; (E-G) The effect of cell density on variation in HRE-GFP expression; (E) Laconic FRET ratio in A375 cells; n = 12 cells; (F) HRE-GFP transitions in HEK293 cells cultured at low density, at high density with and without 10 mM lactate, or MCT-1 transporter inhibitor; n > 12 exp; (G) Percentage of HRE-GFP oscillations in A375 in co- culture with BJ5ta fibroblasts at different relative percentages, also with lactate; n = 3 exp; (H) Schematic showing that high density in solid tumors can result in lactate buildup in the core, causing increased oscillations in HIF-1α activity; (I-J) Confocal time lapsed images of HRE-GFP HEK293 spheroids in CoCl2 and frequency of GFP switches in the core (area shown within dotted line); Scale bar = 100 μm; n = 4 spheroids. (K) Confocal images showing dynamics of HRE-GFP HEK293 cells in a zebrafish embryo, imaged 1 day after microinjection into the yolk sac; white arrows show cells with changes in GFP expression; (L) Coefficient of temporal variation (standard deviation normalized by mean) over 14 hours of observation for detectable cells in 2D cultures, and zebrafish; n > 40 locations. Error bars: s.e.m.; *: p < 0.05, **: p < 0.01, ***: p < 0.001.
Fig 5.
Fig 5.. Oscillating hypoxic response can lead to differential gene regulation and allow proliferation under hypoxia.
(A) Experimental protocol to entrain intracellular hypoxic response by imposing oscillations of extracellular O2. (B) Immunoblot showing HIF-1α abundance in HeLa cells after 1% hypoxia for 6 hours, and after re-oxygenation for 10 min, and 1 hour, GAPDH is loading control; (C) RNA-Seq based hierarchical clustering of gene expression in HeLa cells kept in normoxia, and stable or oscillating hypoxia for > 24 h; Genes differentially regulated by oscillatory hypoxia shown in bracket. (See Fig S5). (D) Key Ingenuity pathways upregulated in gene-set differentially regulated by oscillatory hypoxia (referred to in B) vs persistent hypoxia. (E-J) Oscillations in HIF-1α abundance allows cells to continue to proliferate in hypoxia; (E) Immunoblot showing abundance of Cyclin B1 and Cyclin D1 in cells in normoxia, and stable or oscillating hypoxia; GAPDH is loading control. (F) RNA-Seq-based analysis of pairwise fold-changes between cells in above conditions for cell-cycle related genes. (G) Propidium iodide levels in HEK293 cells after conditioning with stably high, low or oscillatory input of 2% oxygen for 18 h; Quantification of gated cycling cells shown in (H); n = 12 exp. (I) Percentage of HypoxCR-GFP transfected HeLa cells positive for Geminin-mCherry after 12 h each of environmental normoxia, hypoxia, and oscillating hypoxia; above panel shows a representative location. (J) Percentage of HypoxCR-GFP transfected HEK293 cells positive for Geminin-mCherry within HRE-GFP+ve, HRE-GFP-ve subpopulations, and cells that spontaneously oscillate in persistent hypoxia; n = 6 exp. (K) Percentage of proliferating cells in HeLa cells stably transfected with Tet-inducible wild-type HIF-1α (HIF-1αWT) and HIF-1α with mutation in KFERQ-like lysosomal targeting motif (HIF-1αΔΔ), with stable or oscillating doxycycline concentrations; n = 6 exp. Error bars: s.e.m.; *: p < 0.05, **: p < 0.01, ***: p < 0.001.
Fig 6.
Fig 6.. Oscillating hypoxic response dynamics regulates gene expression congruent to many human cancers.
(A-C) Genes downregulated by oscillating hypoxia show a correlatively downregulated signature in many human cancer types. (A) Heatmap showing genes upregulated by hypoxia, but downregulated by oscillatory hypoxia (Oscdown genes), and (B) their relative expression in cancers vs normal tissue in the TCGA tumor database; colors refer to a TCGA study where the given gene is expressed significantly higher (red), or significantly lower (green) in tumor compared to normal tissue sample, with significance for the whole set of Oscdown genes in (C). (D-F) Genes upregulated by oscillating hypoxia also show a correlatively upregulated signature in many human cancer types: (D) Heatmap showing genes downregulated in hypoxia, but upregulated in oscillatory hypoxia (Oscup genes), and (E) direction of their expression in TCGA tumors vs normal samples; color code same as B. (F) Significance of the whole set of Oscup genes shown in tumor vs normal; In C, and F, bars show overall fold change of the geneset, colorbar represents the mean log2fold change between cancer and normal samples. (G-H) Genes differentially regulated by oscillatory hypoxia are significantly downregulated (G), or upregulated (H) when compared against the directional expression of all other genes in those TCGA tumors vs control samples; In both G, and H, each dot represents a tumor comparison with normal tissue; x-axis refer to log(pvalue) of tumor vs normal comparison; bars show 95% confidence interval for mean vs all genes difference; vertical red line marks threshold of pvalue = 0.05. (I-L) Representative examples of Oscdown and Oscup gene sets in breast cancer BRCA, and liver hepatocellular carcinoma LIHC: (I) Histogram showing density of Oscdown genes (green), or all genes (pink); Genes are normalized by total gene numbers; BRCA tumor samples = 1085, normal breast samples = 291. (J) GSEA enrichment analysis in Oscdown gene expression in BRCA vs normal samples; all genes are ranked in order of decreasing tumor/normal fold changes on x-axis, with bars representing Oscdown genes. (K) Histogram showing relative distribution of fold change of Oscdown genes (green), or all genes (pink); Genes are normalized by total gene numbers; LIHC tumor samples = 369, normal breast samples = 160. In I, and K, asterisk represents the mean log2fold change between cancer and normal samples for the corresponding gene set (all or Oscdown /Oscup). (L) GSEA enrichment analysis in Oscup gene expression in LIHC cancers. (M) Oscdown genes are significantly downregulated in many TCGA cancer types when compared to all the other genes; bars show a 95% confidence interval for the difference. (N) Many Oscup genes are significantly upregulated in many TCGA cancer types compared to all the other genes; bars show a 95% confidence interval.

References

    1. Semenza GL (2002). HIF-1 and tumor progression: pathophysiology and therapeutics. Trends Mol Med 8, S62–67. - PubMed
    1. Semenza GL (2003). Targeting HIF-1 for cancer therapy. Nat Rev Cancer 3, 721–732. 10.1038/nrc1187. - DOI - PubMed
    1. Semenza GL (2010). Vascular responses to hypoxia and ischemia. Arterioscler Thromb Vasc Biol 30, 648–652. 10.1161/ATVBAHA.108.181644. - DOI - PMC - PubMed
    1. Semenza GL (2010). Oxygen homeostasis. Wiley Interdiscip Rev Syst Biol Med 2, 336–361. 10.1002/wsbm.69. - DOI - PubMed
    1. Semenza GL (1998). Hypoxia-inducible factor 1: master regulator of O2 homeostasis. Curr Opin Genet Dev 8, 588–594. - PubMed

Publication types

LinkOut - more resources