. 2023 Jan;299(1):102758.
doi: 10.1016/j.jbc.2022.102758. Epub 2022 Dec 1.

Temperature instability of a mutation at a multidomain junction in Na,K-ATPase isoform ATP1A3 (p.Arg756His) produces a fever-induced neurological syndrome

Affiliations

Temperature instability of a mutation at a multidomain junction in Na,K-ATPase isoform ATP1A3 (p.Arg756His) produces a fever-induced neurological syndrome

Elena Arystarkhova et al. J Biol Chem. 2023 Jan.

Abstract

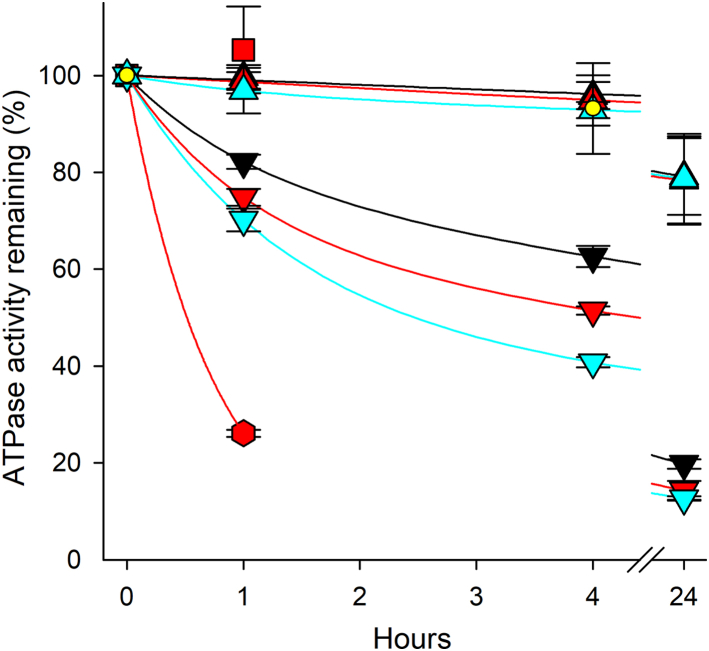
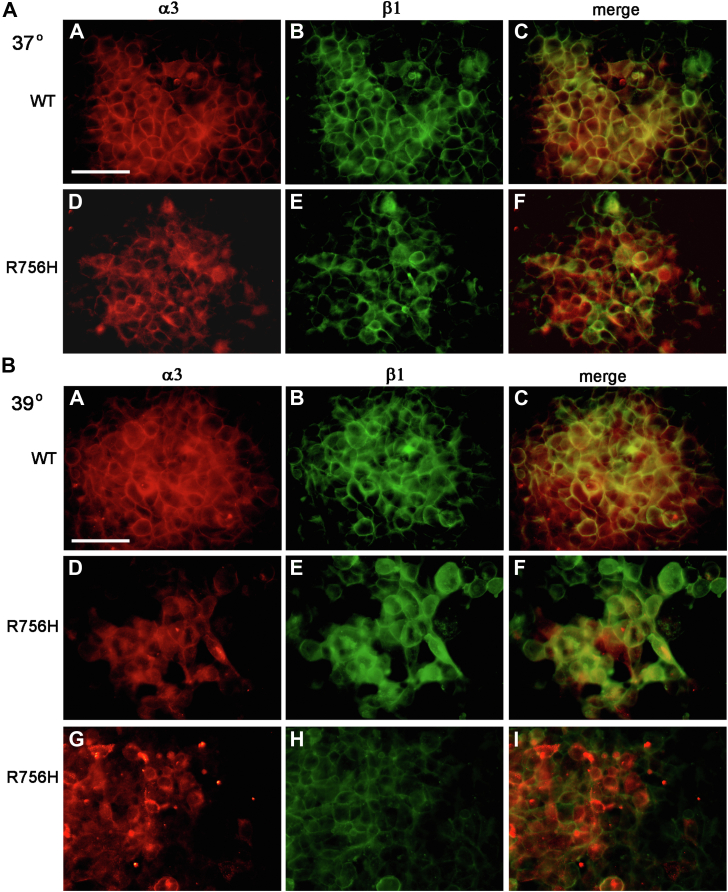
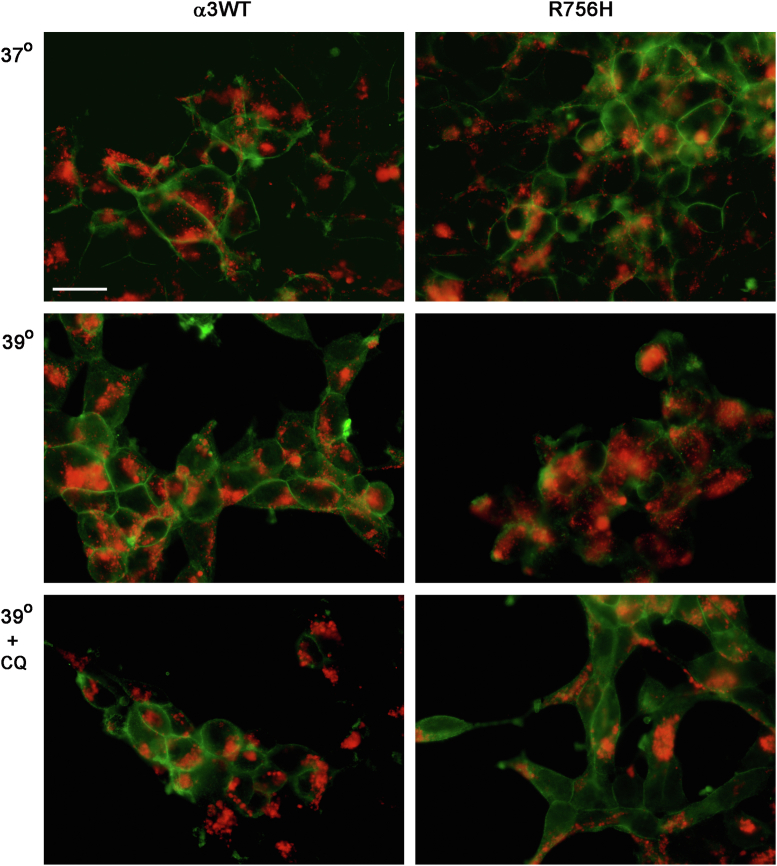
ATP1A3 encodes the α3 isoform of Na,K-ATPase. In the brain, it is expressed only in neurons. Human ATP1A3 mutations produce a wide spectrum of phenotypes, but particular syndromes are associated with unique substitutions. For arginine 756, at the junction of membrane and cytoplasmic domains, mutations produce encephalopathy during febrile infections. Here we tested the pathogenicity of p.Arg756His (R756H) in isogenic mammalian cells. R756H protein had sufficient transport activity to support cells when endogenous ATP1A1 was inhibited. It had half the turnover rate of wildtype, reduced affinity for Na+, and increased affinity for K+. There was modest endoplasmic reticulum retention during biosynthesis at 37 °C but little benefit from the folding drug phenylbutyrate (4-PBA), suggesting a tolerated level of misfolding. When cells were incubated at just 39 °C, however, α3 protein level dropped without loss of β subunit, paralleled by an increase of endogenous α1. Elevated temperature resulted in internalization of α3 from the surface along with some β subunit, accompanied by cytoplasmic redistribution of a marker of lysosomes and endosomes, lysosomal-associated membrane protein 1. After return to 37 °C, α3 protein levels recovered with cycloheximide-sensitive new protein synthesis. Heating in vitro showed activity loss at a rate 20- to 30-fold faster than wildtype, indicating a temperature-dependent destabilization of protein structure. Arg756 appears to confer thermal resistance as an anchor, forming hydrogen bonds among four linearly distant parts of the Na,K-ATPase structure. Taken together, our observations are consistent with fever-induced symptoms in patients.

Keywords: Na,K-ATPase; ataxia; cytopathology; fever; hypotonia; mutation pathogenicity; neurodegeneration; phenotype-genotype relationship; thermal inactivation.


Conflict of interest statement

Conflict of interest E. A., M. S. T-J., R. H., J. J-K., K. E. L., P. F., L. J. O., B. V., and K. J. S. declare no competing financial interests. A. B. serves the McKnight Brain Research Foundation as a trustee and is on the board of directors of the American Board of Psychiatry and Neurology and Care Directions.

Figures

Figure 1
Figure 1
R756 helps connect four domains of Na,K-ATPase α and the β subunit. A–C, Portions of crystal structures of α1β1 Na,K-ATPase in three different conformation states are illustrated with different colors (ribbon representation). In the order of the linear structure, the P domain is made in two parts (pink and red) that are interrupted by the 214-amino acid N domain (not visible). M5 is a long transmembrane span, but the portion shown is its cytoplasmic extension (white). The cytoplasmic loop between M6 and M7 is lavender, and the N terminus of the β subunit is green. The backbone and sidechains of R756 and Q825 of α3 are shown in stick format, but only the backbone carbonyls and amides of Glu358, Ala599, Ile821, and Arg824 are shown, because the latter’s sidechains are not involved in the hydrogen bonds. Not illustrated: The arginine is further surrounded by hydrophobic residues in L6-7. ATP1A3 residues I821, M822, and P826 are all close contacts (<4.2 Å) of the R756 side chain, and the stem of the R824 side chain runs antiparallel with that of R756. In the ground state structure, a portion of L6-7 is cut away to make the backbone of I821 more visible. Putative hydrogen bonds (black dashed lines) were calculated in Swiss PDB Viewer 4.1 as determined by both distance and angle. The calculated hydrogen bond between the carbonyl of G358 and R756 is near the maximal distance, so its dashed line is colored gray. In the Na+ form, R756 makes a hydrogen bond with the carbonyl of Q825. The glutamine’s carboxyamido group in turn can form a hydrogen bond with the guanidine of Arg3 of the β subunit. There are minor shifts in predicted hydrogen bonds among the three conformations, but the common feature is that the guanidino group of R756 can make hydrogen bonds with three other parts of the protein that meet at this location. D–E, Na,K-ATPase (PDB file 3KDP) and a SERCA Ca-ATPase (PDB file 6LN5) were aligned on the cytoplasmic M5 helix with Magic Fit in Swiss PDB viewer to illustrate the interactions of R756 and R751. F, The two structures were superimposed. All of the bonded residues correspond between Na,K-ATPase and Ca-ATPase, and their relationships are exactly the same in the two proteins.
Figure 2
Figure 2
Reduced expression and increased ER retention. A, examples of variations in the expression level of α3 in 293 cell lines with different mutations. The R756L cells initially expressed the protein but looked abnormal and lost expression after continuous induction, suggesting selection against it. B, average reduction of R756H expression in 15 biological replicates, normalized to cells expressing WT α3 in the same experiment. Significance was determined with paired 2-tail Student’s t test with the measured densitometry values for both α3WT and R756H (average 0.566 ± 0.188 S.D., n = 15, p < 0.0001). C, example of differences in α3 expression and β subunit maturation. In almost all experiments with α3WT, immature β could not be quantified. This blot shows the highest level ever seen. All lanes shown were from the same blot, but top and bottom halves were stained with α3 and β1 antibodies separately, and unrelated lanes between these were removed. D, the fraction of immature β was determined by scanning densitometry of each lane for 23 independent samples from 15 experiments. Normalization for loading is not needed with in-lane scanning. Significance was determined by unpaired one-sided Student’s t test (average 0.282 ± 0.086 S.D., n = 23, p < 0.0001). Significance: ∗∗∗∗≤ 0.00001.
Figure 3
Figure 3
Impacts of the R756H mutation on Na,K-ATPase function. A, active site concentration as a measure of the expression level determined by phosphorylating the enzyme for 10 s at 0 °C in the presence of 2 μM [γ-32P]ATP, 150 mM NaCl, 20 mM Tris (pH 7.5), 3 mM MgCl2, 1 mM EGTA, 10 μM ouabain, and 20 μg oligomycin/ml, i.e., under stoichiometric conditions (11). The data are presented as % of the WT, resulting in a mean value of 55 ± 15 (S.D., n = 6) for R756H. B, maximal catalytic turnover rate. The ATPase activity was determined for 15 min at 37 °C in medium containing 130 mM NaCl, 20 mM KCl, 30 mM histidine (pH 7.4), 1 mM EGTA, 3 mM MgCl2, 3 mM ATP, and 10 μM ouabain and is shown relative to the active site concentration determined as described for panel A, resulting in mean values (min-1) of 8157 ± 689 (S.D., n = 14) and 3531 ± 545 (S.D., n = 16) for WT and R756H, respectively. In panels A and B, the data points from individual determinations are shown superimposed on bar graphs showing mean values with error bars indicating S.D. C, Na+ dependence of phosphorylation. Phosphorylation was carried out under conditions described for A, except that the Na+ concentration was varied, added as NaCl with various concentration of NMDG+ to maintain constant ionic strength. The data points (normalized to maximal phosphorylation) show mean values with error bars indicating S.D. Line plots represent the best fit of a Hill function. The apparent affinities for Na+ activation extracted from the data are as follows: K0.5 = 0.86 ± 0.04 mM and 2.56 ± 0.70 mM for WT and R756H, respectively (mean ± S.D., n = 3 and 6). D, K+ dependence of Na,K-ATPase activity determined at 37 °C in medium containing 40 mM NaCl, 3 mM ATP, 3 mM MgCl2, 30 mM histidine (pH 7.4), 1 mM EGTA, 10 μM ouabain, and the indicated concentrations of K+ added as KCl. The data points (normalized to the maximal activity) show mean values with error bars indicating S.D. Line plots represent the best fit of a double Hill function to the data (with a rising phase and an inhibition phase). The apparent affinities for K+ activation extracted from the data corresponding to the rising phase are: K0.5 = 595 ± 66 μM and 213 ± 25 μM for WT and R756H, respectively (mean ± S.D., n = 5 and 6).
Figure 4
Figure 4
Elevated temperature effects on Na,K-ATPase α and β subunits. A, the blots shown are from the same experiment as Figure 3A. B and C, α3 and α1 were quantified by densitometry. There was little effect of elevated temperature on α3WT, but there was complementary reduction in α3 and increase in α1 in R756H. Biological replicates were n = 5 for α3WT (α3 average 0.963 ± 0.343 S.D.; α1 1.104 ± 0.416 S.D.) and n = 10 for R756H (α3 average 0.571 ± 0.106 S.D.; α1 1.522 ± 0.344 S.D.). Statistical analysis was by Wilcoxon-signed rank test (p < 0.01). D, total β subunit was quantified by densitometry and normalized to GAPDH (left 2 bars), and there was no significant difference by paired 2-tail Student’s t test (α3WT average 1.139 ± 0.164 S.D, n = 9; R756H 1.018 ± 0.200 S.D, n = 9). On the right, when total β subunit was normalized to α3 in each experiment, the difference was significant (p < 0.001), reflecting the decrease in α3 (α3WT average 1.194 ± 0.239 S.D, n = 9; R756H 2.262 ± 1.394 S.D, n = 13). Significance: ∗∗≤0.001; ∗∗∗≤0.0001.
Figure 5
Figure 5
Temperature sensitivity in vitro. Wildtype (triangles pointing upward), R756H mutant (triangles pointing downward), and D923N mutant (small yellow circles) in membranes isolated from COS-1 cells and permeabilized as described in Methods were incubated for the time intervals indicated on the abscissa in buffer containing 12.5 mM Imidazole (pH 7.0), 10 mM EDTA, with 130 mM NaCl and 20 mM KCl, at the following temperatures: 37 °C (black symbols), 39 °C (red and yellow symbols), or 41 °C (cyan symbols). At the indicated times, the ATPase activity was determined. Mean values are shown relative to that corresponding to zero time. Plotted on the same graph (red squares, WT; red hexagons, R756H) are the values obtained when membranes were incubated at 39 °C in buffer containing 12.5 mM Imidazole (pH 7.0), 10 mM EDTA without NaCl or KCl, which destabilized the R756H mutant far more than WT. Error bars indicate S.D. (number of independent experiments n= 3–6 for all datapoints, each performed as duplicate determinations).
Figure 6
Figure 6
Prolonged incubation of cells at elevated temperature. A, representative Western blot showing the effect of prolonging incubation at 39 °C to 48 h. The asterisk in panel A marks immature β. B, α3 levels remained suppressed at 48 h; by two-way ANOVA, levels in α3WT were not different (average 0.936 ± 0.296 S.D. at 24 h, n = 8; 1.027 ± 0.112 S.D. at 48 h, n = 6; n.s.) and R756H was reduced by half (p < 0.01) (average 0.567 ± 0.243 at 24 h, n = 14; 0.543 ± 0.139 S.D. at 48 h, n = 11). The figure additionally shows pairwise 2-tailed comparisons. C, effects of the length of incubation on the fraction of β subunit that is immature were quantified at 37 °C to determine the baseline, and the graph shows 24 h and 48 h data (average 0.327 ± 0.065 S.D. at 24 h, n = 11; 0.241 ± 0.085 S.D. at 48 h, n = 12). Improved maturation at 48 h for R756H cells was significant at 37 °C (p < 0.01). D, the proportion of immature β subunit in R756H was higher at 39 °C at both incubation times, but the difference was greater after 48 h. Two-way ANOVA gave p < 0.01, and a pairwise 2-tailed t test between 37 °C and 39 °C were more significantly different at 48 h (p < 0.001). Averages were 37 °C 24 h 0.348 ± 0.064 S.D, n = 8.; 37 °C 48 h 0.266 ± 0.081 S.D. n = 8; 39 °C 24 h 0.409 ± 0.95 S.D. n = 8; 39 °C 48 h 0.324 ± 0.072 S.D., n = 10). Significance: ∗≤0.01; ∗∗≤0.001; ∗∗∗≤0.0001; ∗∗∗∗≤ 0.00001.
Figure 7
Figure 7
Recovery after elevated temperature. A, representative blot showing recovery of α3 expression after shift from 39 °C back to 37 °C. B, the averaged data showed no significant change in α3WT expression levels (n = 5) (average 1.015 ± 0.120 S.D. at 37 °C, 1.028 ± 0.142 S.D. at 39 °C), but for R756H, the data were significant by two-way ANOVA and pairwise comparisons (n = 5) (average 0.489 ± 0.140 S.D. at 37 °C, 0.866 ± 0.175 S.D at 39 °C). Significance: ∗≤ 0.01; ∗∗≤0.001. C, cycloheximide blocked the recovery of R756H α3 as expected if most of the recovery is due to new synthesis. The reduction in α3WT due to cycloheximide was 25% for α3 and undetectable for total β, while for R756H, the reduction was 65% for α3 and 25% for total β.
Figure 8
Figure 8
Tests of phenylbutyric acid (PBA) for improvement of R756H cell phenotype. A, R756H cells were incubated at 37 °C or 39 °C for 48 h with and without 5 mM PBA. At 37 °C, there was an average 1.48-fold increase in α3 in R756H, but this did not differ from 1.46-fold in α3WT. At 39 °C, there was less improvement than at 37 °C. B, similarly, there was a small improvement in β maturation in PBA at 37 °C, but not at 39 °C. The results are plotted as pairs of values in five replicate experiments. C, the appearance of processes was not different between α3WT and R756H at either temperature. Scale bar is 20 μm. D, quantification of process length (175 measurements per condition) showed that α3WT and R756H had a similar distribution of lengths at both temperatures and with and without PBA.
Figure 9
Figure 9
α3 and β1 distribution in confluent cells. In fixed and permeabilized cells, α3 was detected with polyclonal antibody (red) and β1 with monoclonal antibody M17-P5-F11 (green). A, after growth at 37 °C, R756H cells showed more intracellular stain and more discrepancies in the distribution of α3 and β compared to the α3WT controls. B, after growth at 39 °C, α3WT showed uniform changes consisting of an increase in intracellular stain. R756H cells, on the other hand, showed almost entirely intracellular stain for α3 as well as cells with sharply reduced levels. The β subunit in many cases was internalized, but with less co-localization with α3. DF, these images show cells that are somewhat enlarged, with diffuse stain. GI, these cells show a different pathology consisting of bright α3 aggregates scattered in the cytoplasm. Scale bar 50 μm.
Figure 10
Figure 10
LAMP1 stain for lysosomes and endosomes. Stain for LAMP1 is red, and stain for Na,K-ATPase β subunit in green is used to define the edges of the cells and reveal some disruption in R756H cells. Chloroquine, 10 μM, was added at the same time as the change to 39 °C. Scale bar 20 μm. LAMP1, lysosomal-associated membrane protein 1.
Figure 11
Figure 11
Rotamers predict interactions of the mutant side chains. Substitutions were made in the Na+ form crystal structure 3WGU with the Swiss PDB viewer, and each of their rotamers was examined for interactions or clashes with other residues. Two examples are shown for each substitution to histidine, cysteine, and leucine. On the left in each frame, the backbone carbonyls and amides of A599 in the P domain and Q825 and R824 in L6-7 are shown to illustrate how far away the side chains of the three substitutions are. Black dashed lines are calculated hydrogen bonds. The bond that shows in both R756H and R756L is the normal alpha helical hydrogen bond between the carbonyl of V752 and the amide of R756. A new hydrogen bond is predicted between the sulfur of cysteine and the carbonyl of G358. Clashes are indicated by white dashed lines and by arrowheads when poorly visible.

References

    1. Arystarkhova E., Haq I.U., Luebbert T., Mochel F., Saunders-Pullman R., Bressman S.B., et al. Factors in the disease severity of ATP1A3 mutations: impairment, misfolding, and allele competition. Neurobiol. Dis. 2019;132:104577. - PMC - PubMed
    1. Lazarov E., Hillebrand M., Schroder S., Ternka K., Hofhuis J., Ohlenbusch A., et al. Comparative analysis of alternating hemiplegia of childhood and rapid-onset dystonia-parkinsonism ATP1A3 mutations reveals functional deficits, which do not correlate with disease severity. Neurobiol. Dis. 2020;143 - PubMed
    1. Arystarkhova E., Ozelius L.J., Brashear A., Sweadner K.J. Misfolding, altered membrane distributions, and the unfolded protein response contribute to pathogenicity differences in Na,K-ATPase ATP1A3 mutations. J. Biol. Chem. 2021;296 - PMC - PubMed
    1. Toyoshima C., Nakasako M., Nomura H., Ogawa H. Crystal structure of the calcium pump of sarcoplasmic reticulum at 2.6 Å resolution. Nature. 2000;405:647–655. - PubMed
    1. Jorgensen P.L., Hakansson K.O., Karlish S.J.D. Structure and mechanism of Na,K-ATPase: Functional sites and their interactions. Ann. Rev. Physiol. 2003;65:817–849. - PubMed

Publication types

Substances