. 2022 Dec 3;13(12):1017.
doi: 10.1038/s41419-022-05426-z.

The mechanism of BUD13 m6A methylation mediated MBNL1-phosphorylation by CDK12 regulating the vasculogenic mimicry in glioblastoma cells

Affiliations

The mechanism of BUD13 m6A methylation mediated MBNL1-phosphorylation by CDK12 regulating the vasculogenic mimicry in glioblastoma cells

Meichen Liu et al. Cell Death Dis. .

Abstract

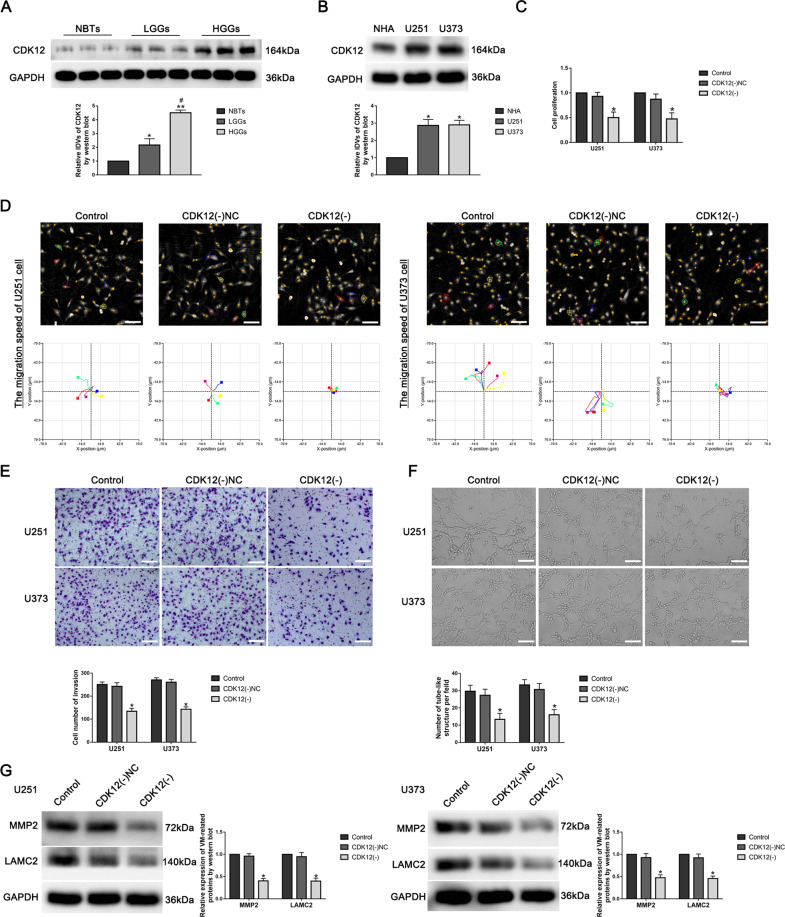
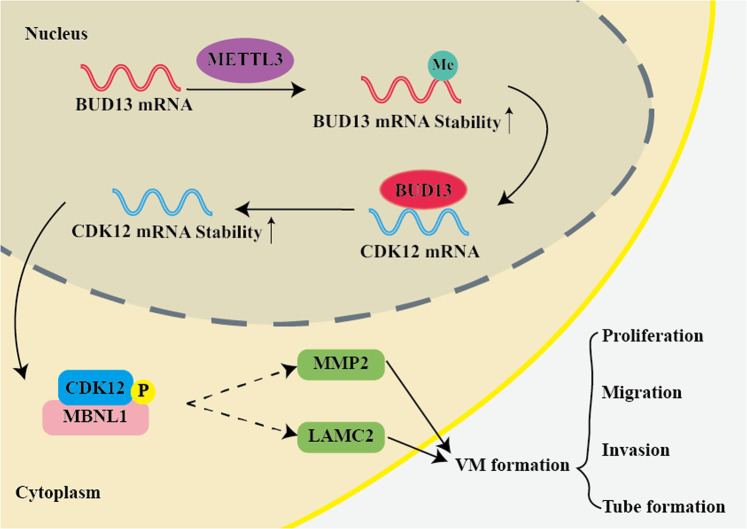
Vasculogenic mimicry (VM) is an endothelium-independent tumor microcirculation that provides adequate blood supply for tumor growth. The presence of VM greatly hinders the treatment of glioblastoma (GBM) with anti-angiogenic drugs. Therefore, targeting VM formation may be a feasible therapeutic strategy for GBM. The research aimed to evaluate the roles of BUD13, CDK12, MBNL1 in regulating VM formation of GBM. BUD13 and CDK12 were upregulated and MBNL1 was downregulated in GBM tissues and cells. Knockdown of BUD13, CDK12, or overexpression of MBNL1 inhibited GBM VM formation. METTL3 enhanced the stability of BUD13 mRNA and upregulated its expression through m6A methylation. BUD13 enhanced the stability of CDK12 mRNA and upregulated its expression. CDK12 phosphorylated MBNL1, thereby regulating VM formation of GBM. The simultaneous knockdown of BUD13, CDK12, and overexpression of MBNL1 reduced the volume of subcutaneously transplanted tumors in nude mice and prolonged the survival period. Thus, the BUD13/CDK12/MBNL1 axis plays a crucial role in regulating VM formation of GBM and provides a potential target for GBM therapy.


Conflict of interest statement

The authors declare no competing interests.

Figures

Fig. 1
Fig. 1. BUD13 was upregulated in GBM tissues and cells, and knockdown of BUD13 inhibited VM formation in GBM cells.
A Western blot was used to detect the expression of BUD13 in normal brain tissues (NBTs), low-grade glioma tissues (WHO 1–2), and high-grade glioma tissues (WHO 3–4). Data are presented as mean ± SD (n = 3). Compared with NBTs group, *P < 0.05, **P < 0.01, compared with low-grade glioma tissue group, #P < 0.05. B Western blot was used to detect the expression of BUD13 in normal human astrocytes (NHAs), U251, and U373 cells. Data are presented as mean ± SD (n = 3). *P < 0.05, compared with NHAs group. C The effect of BUD13 on the proliferation ability of U251 and U373 cells was detected by CCK8 assay. Data are presented as mean ± SD (n = 3). *P < 0.05, compared with BUD13(-)NC group. D The effect of BUD13 on the migration ability of U251 and U373 cells was detected by Hstudio M4 (n = 5). E Transwell assay was used to detect the effect of BUD13 on the invasion of U251 and U373 cells. Data are presented as mean ± SD (n = 3). *P < 0.05, compared with BUD13(-)NC group, scale bar: 50 μm. F Three-dimensional tube formation assay was used to detect the effect of BUD13 on the tube formation ability of U251 and U373 cells. Data are presented as mean ± SD (n = 3). *P < 0.05, compared with BUD13(-)NC group, scale bar: 50 μm. G Western blot was used to detect the effect of BUD13 on the expression of VM-related proteins MMP2 and LAMC2 in U251 and U373 cells. Data are presented as mean ± SD (n = 3). *P < 0.05, compared with BUD13(-)NC group.
Fig. 2
Fig. 2. Effects of BUD13 m6A methylation site on VM formation in GBM cells.
A The effect of BUD13 m6A methylation site on the proliferation of U251 and U373 cells was detected by CCK8 assay. Data are presented as mean ± SD (n = 3). *P < 0.05, compared with the Control group. B Hstudio M4 was used to detect the effect of BUD13 m6A methylation site on the migration of U251 and U373 cells (n = 5). C Transwell assay was used to detect the effect of BUD13 m6A methylation site on the invasion of U251 and U373 cells. Data are presented as mean ± SD (n = 3). *P < 0.05, compared with the Control group. D Three-dimensional tube formation assay was used to detect the effect of BUD13 m6A methylation site on the tube formation of U251 and U373 cells. Data are presented as mean ± SD (n = 3). *P < 0.05, compared with the Control group. E Western blot was used to detect the effect of BUD13 m6A methylation site on the expression of VM-related proteins MMP2 and LAMC2 in U251 and U373 cells. Data are presented as mean ± SD (n = 3). *P < 0.05, compared with the Control group.
Fig. 3
Fig. 3. CDK12 was upregulated in GBM tissues and cells, and knockdown of CDK12 inhibited VM formation in GBM cells.
A Western blot was used to detect CDK12 protein expression level in normal brain tissues (NBTs), low-grade glioma tissues (WHO 1–2), and high-grade glioma tissues (WHO 3–4). Data are presented as mean ± SD (n = 3). *P < 0.05, **P < 0.01, compared with NBTs group, #P < 0.05, compared with low-grade glioma tissue group. B Western blot was used to detect CDK12 protein expression level in NHAs, U251, and U373 cells. Data are presented as mean ± SD (n = 3). *P < 0.05, compared with NHAs group. C The effect of CDK12 on the proliferation of U251 and U373 cells was detected by CCK8 assay. Data are presented as mean ± SD (n = 3). *P < 0.05, compared with CDK12(-)NC group. D Hstudio M4 was used to detect the effect of CDK12 on the migration of U251 and U373 cells (n = 5). E Transwell assay was used to detect the effect of CDK12 on the invasion of U251 and U373 cells. Data are presented as mean ± SD (n = 3). *P < 0.05, compared with CDK12(-)NC group, scale bar: 50 μm. F Three-dimensional tube formation assay was used to detect the effect of CDK12 on the tube formation ability of U251 and U373 cells. Data are presented as mean ± SD (n = 3). *P < 0.05, compared with CDK12(-)NC group, scale bar: 50 μm. G Western blot was used to detect the effect of CDK12 on VM-related proteins MMP2 and LAMC2 expression in U251 and U373 cells. Data are presented as mean ± SD (n = 3). *P < 0.05, compared with CDK12(-)NC group.
Fig. 4
Fig. 4. MBNL1 was downregulated in GBM tissues and cells, and overexpression of MBNL1 inhibited VM formation in GBM cells.
A Western blot detected MBNL1 protein expression level in normal brain tissues (NBTs), low-grade glioma tissues (WHO 1–2) and high-grade glioma tissues (WHO 3–4). Data are presented as mean ± SD (n = 3). *P < 0.05, **P < 0.01, compared with NBTs group; #P < 0.05, compared with low-grade glioma tissue group. B Western blot detected MBNL1 protein expression level in NHAs, U251, and U373 cells. Data are presented as mean ± SD (n = 3). *P < 0.05, compared with NHAs group. C The effect of MBNL1 on the proliferation of U251 and U373 cells was detected by CCK8 assay. Data are presented as mean ± SD (n = 3). *P < 0.05, compared with MBNL1(+)NC group. D Hstudio M4 detected the effect of MBNL1 on the migration of U251 and U373 cells (n = 5). E Transwell assay was used to detect the effect of MBNL1 on the invasion of U251 and U373 cells. Data are presented as mean ± SD (n = 3). *P < 0.05, compared with MBNL1(+)NC group. Scale bar: 50 μm. F Three-dimensional tube formation assay detected the effect of MBNL1 on the tube formation of U251 and U373 cells. Data are presented as mean ± SD (n = 3). *P < 0.05, compared with MBNL1(+)NC group. Scale bar: 50 μm. G Western blot detected the effect of MBNL1 on the expressions of VM-related proteins MMP2 and LAMC2 in U251 and U373 cells. Data are presented as mean ± SD (n = 3). *P < 0.05, compared with MBNL1(+)NC group.
Fig. 5
Fig. 5. CDK12 phosphorylated MBNL1.
A The colocalization of CDK12 and MBNL1 in U251 and U373 cells by immunofluorescence assay. Green, CDK12; red, MBNL1; blue, DAPI nuclear staining. Scale bar: 10 μm. B Lysates of U251 cells were subjected to immunoprecipitation (IP) and immunoblotting (IB) with CDK12 and MBNL1 antibodies. C Lysates of 293T cells transfected with FLAG-CDK12 and GST-MBNL1 plasmids were subjected to IP and IB with FLAG tag and GST tag antibodies. D The direct interaction between CDK12 and MBNL1 was confirmed by GST pull-down assay. GST protein functioned as a negative control. E Autoradiography detected phosphorylation of GST-MBNL1 fusion protein. F The effects of MBNL1 T6 phosphorylation site on its stability were detected by Cycloheximide (CHX) chase assay. Data are presented as the mean ± SD (n = 3, each group). *P < 0.05, **P < 0.01, compared with MBNL1-WT group by one-way ANOVA.
Fig. 6
Fig. 6. Knockdown of BUD13 and CDK12 combined with overexpression of MBNL1 inhibited the growth of GBM and prolonged the survival period of nude mice.
A Subcutaneously xenografted nude mice injected with differently treated cells are shown (above). Representative tumors from each group are shown (below). B Tumor growth curve (n = 8). Tumor size was recorded every 5 days and tumors were removed after day 45. *P < 0.05, **P < 0.01, compared with the Control group; #P < 0.05, compared with BUD13(-) group; &P < 0.05, compared with CDK12(-) group; ΔP < 0.05, compared with MBNL1(+) group. C Survival curve of subcutaneously transplanted tumor in nude mice (n = 8). D CD34-PAS staining was used to detect tube-forming ability in nude mice tumors. Scale bar: 50 μm. Arrows indicate VM structures.
Fig. 7
Fig. 7. The schematic diagram about the regulating process of BUD13/CDK12/MBNL1 axis on VM formation of GBM.
METTL3 enhanced the stability of BUD13 mRNA and upregulated its expression through m6A methylation. BUD13 enhanced the stability of CDK12 mRNA and upregulated its expression. CDK12 phosphorylating MBNL1 regulated proliferation, migration, invasion, and tube formation of GBM.

References

    1. Agnihotri S, Aldape KD, Zadeh G. Isocitrate dehydrogenase status and molecular subclasses of glioma and glioblastoma. Neurosurg Focus. 2014;37:E13. doi: 10.3171/2014.9.FOCUS14505. - DOI - PubMed
    1. Wu JS, Mu LM, Bu YZ, Liu L, Yan Y, Hu YJ, et al. C-type natriuretic peptide-modified lipid vesicles: fabrication and use for the treatment of brain glioma. Oncotarget. 2017;8:40906–21. doi: 10.18632/oncotarget.16641. - DOI - PMC - PubMed
    1. Wen PY, Reardon DA. Neuro-oncology in 2015: Progress in glioma diagnosis, classification and treatment. Nat Rev Neurol. 2016;12:69–70. doi: 10.1038/nrneurol.2015.242. - DOI - PubMed
    1. Chen W, Cheng X, Wang X, Hu W, Wang J, Liao C. Caveolin-1 promotes tumor cell proliferation and vasculogenic mimicry formation in human glioma. Braz J Med Biol Res. 2021;54:e10653. doi: 10.1590/1414-431x2020e10653. - DOI - PMC - PubMed
    1. Cai HP, Wang J, Xi SY, Ni XR, Chen YS, Yu YJ, et al. Tenascin-cmediated vasculogenic mimicry formation via regulation of MMP2/MMP9 in glioma. Cell Death Dis. 2019;10:879. doi: 10.1038/s41419-019-2102-3. - DOI - PMC - PubMed

Publication types

MeSH terms

LinkOut - more resources