. 2022 Dec 3;5(1):1326.
doi: 10.1038/s42003-022-04298-5.

An integrated map of fibroblastic populations in human colon mucosa and cancer tissues

Affiliations

An integrated map of fibroblastic populations in human colon mucosa and cancer tissues

Siying Li et al. Commun Biol. .

Abstract

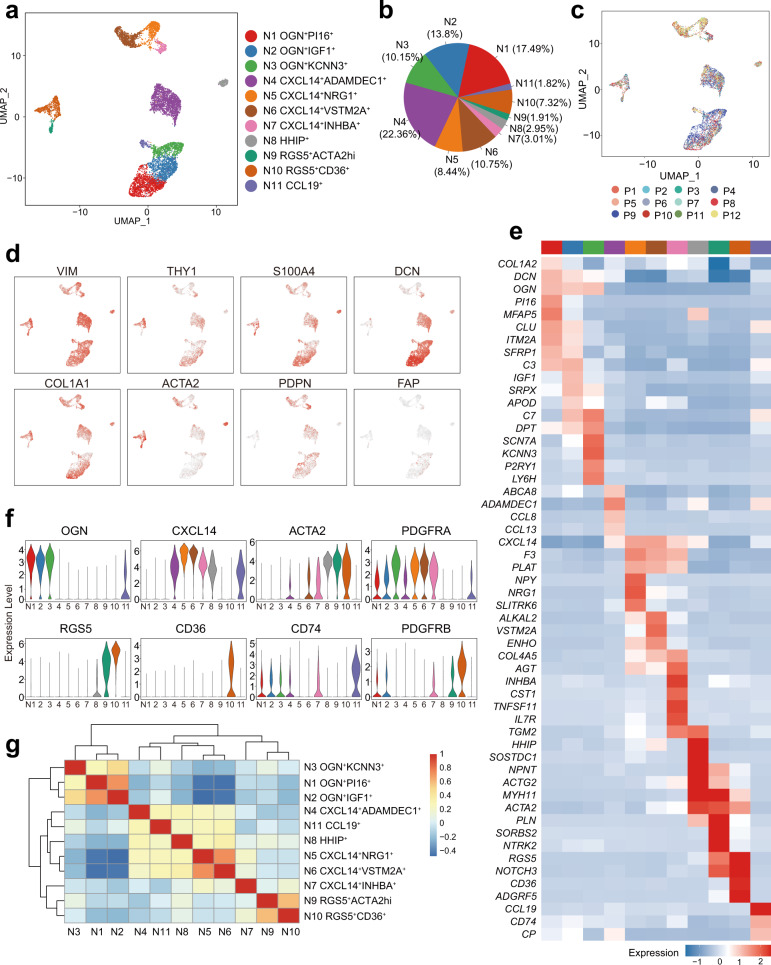
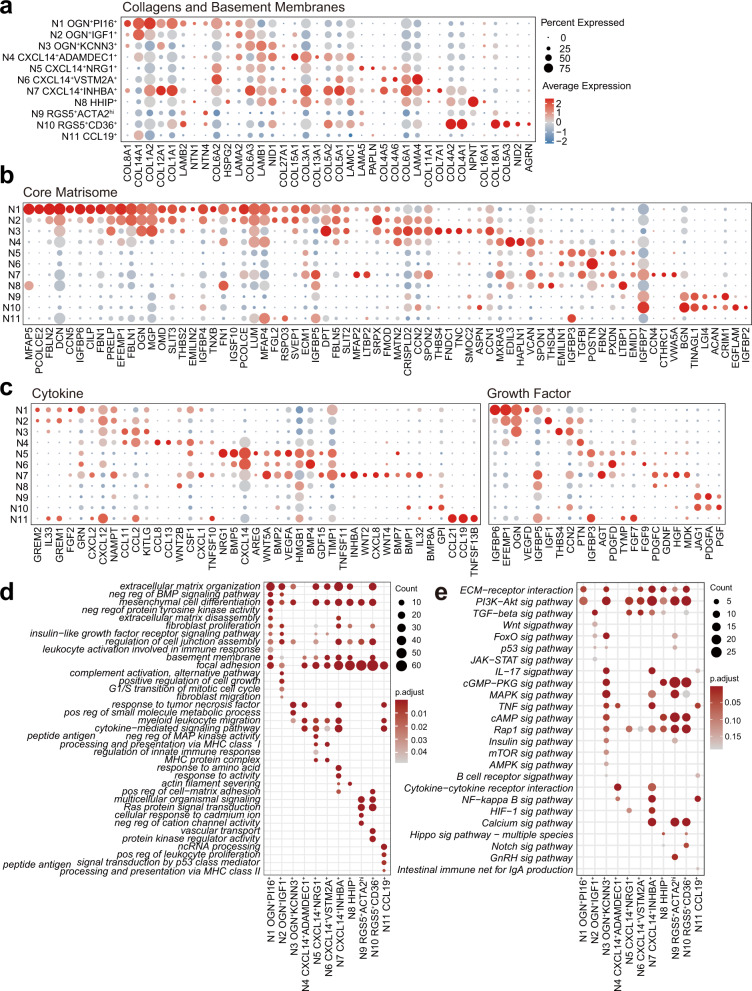
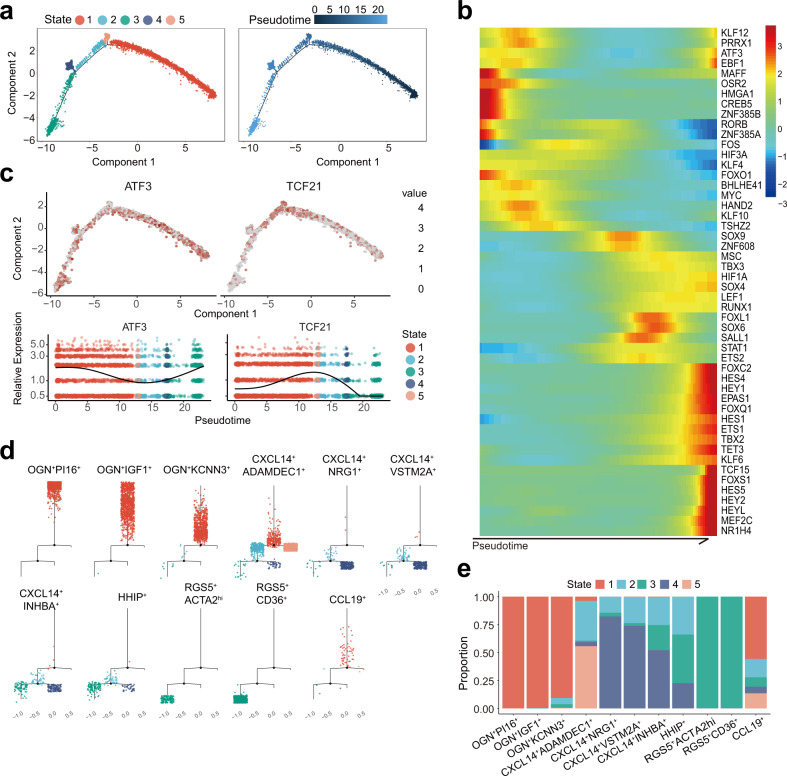
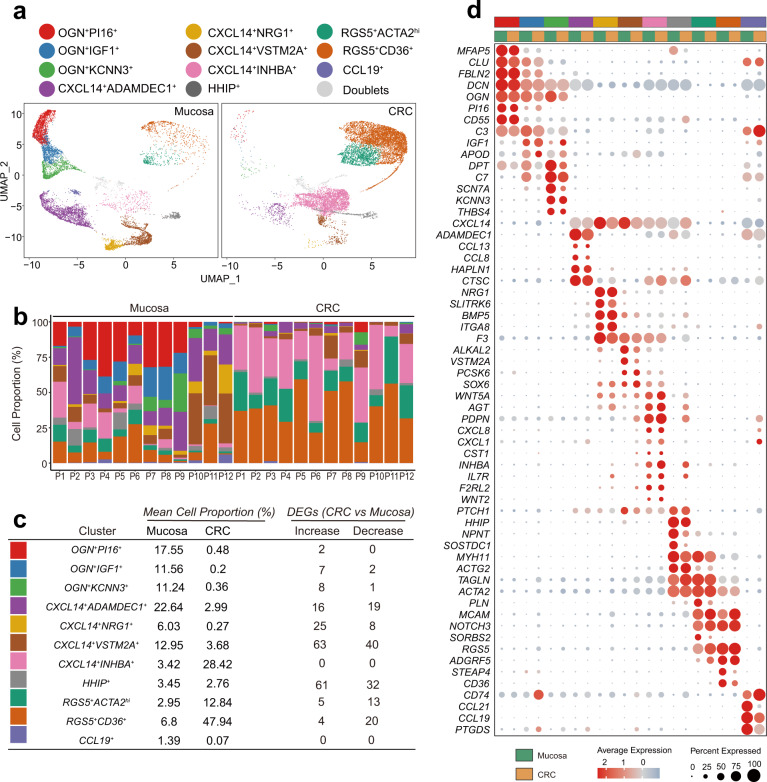
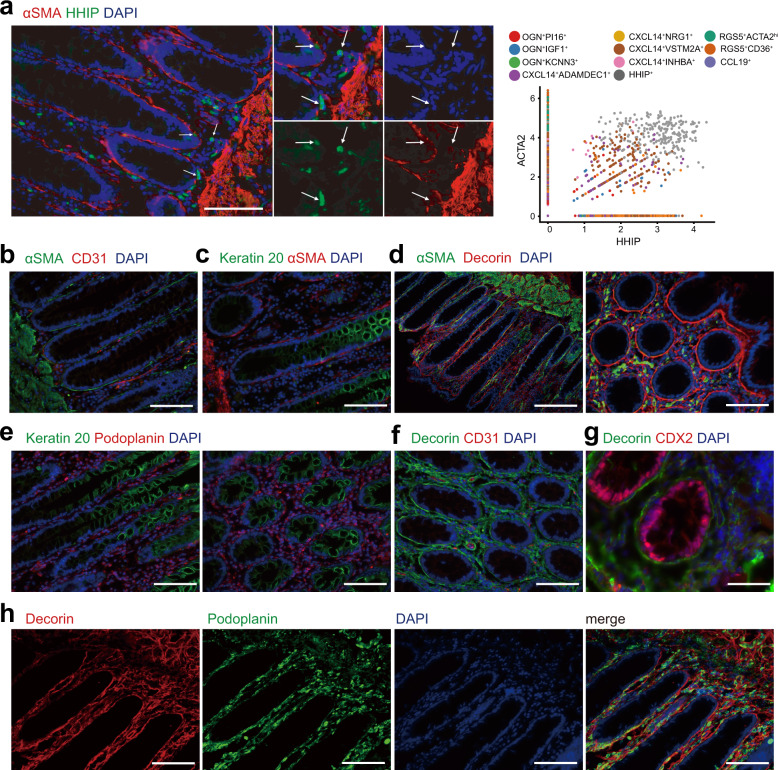
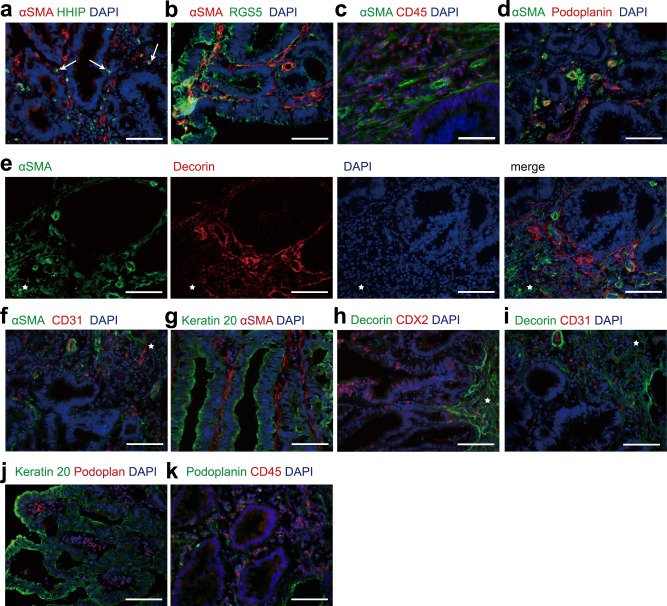
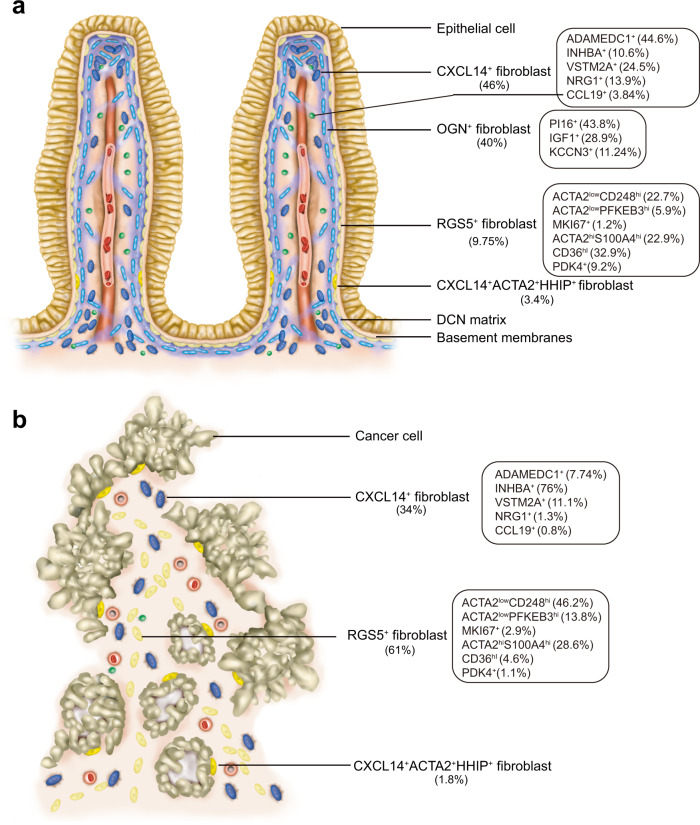
Fibroblasts and myofibroblasts are major mesenchymal cells in the lamina propria of colon mucosa and in colon cancer tissues. Detailed insight into the highly specific populations of fibroblasts and myofibroblasts is required to understand the integrity and homeostasis of human colon mucosa and colon cancer. Based on gene expression profiles of single cells, we identified fibroblast populations that produce extracellular matrix components, Wnt ligand- and BMP-secreting fibroblasts, chemokine- and chemokine ligand-generating fibroblasts, highly activated fibroblasts, immune-modulating fibroblasts, epithelial cell-modulating myofibroblasts, stimuli-responsive myofibroblasts, proliferating myofibroblasts, fibroblast-like myofibroblasts, matrix producing myofibroblasts, and contractile myofibroblasts in human colon mucosa. In colon cancer tissue, the compositions of fibroblasts and myofibroblasts were highly altered, as were the expressing patterns of genes including BMPs, Wnt ligands, chemokines, chemokine ligands, growth factors and extracellular matrix components in fibroblasts and myofibroblasts. Our work expands the working atlas of fibroblasts and myofibroblasts and provides a framework for interrogating the complexity of stromal cells in human healthy colon mucosa and colon cancer tissues.


Conflict of interest statement

The authors declare no competing interests.

Figures

Fig. 1
Fig. 1. scRNA-seq analysis defined types of fibroblasts and myofibroblasts in human colon mucosa.
a UMAP projection of fibroblasts from normal colon mucosa, colored by inferred cluster identity. b Proportions of the clusters in all fibroblasts. c UMAP projection of normal colon mucosa fibroblasts colored according to the patients (labeled P1 to P12, n = 12). d UMAP Feature plots of the expression distribution of classical fibroblast markers. e Heatmap showing the scaled expression of marker genes in each cluster of mucosal fibroblasts. f Violin plots showing selected distinct markers of clusters. g Heatmap of Pearson correlation coefficients between the normal colon mucosa fibroblast clusters. The dendrogram shows the inferred hierarchy of clusters according to the Pearson correlation coefficients of the average expression of marker genes among clusters. The color scale shows the Pearson correlation coefficient.
Fig. 2
Fig. 2. The patterns of gene expression profiles in human colonic mucosa fibroblasts and myofibroblasts.
ac Dot plot showing the scaled expression of several key biological function-related gene sets of each cluster in mucosa. Gene sets were downloaded from the Molecular Signatures Database (MSigDB). The color gradient represents the average expression of each gene in each cluster scaled across all clusters. The dot size represents the percentage of positive cells in each cluster. The colors representing each cluster in the color band correspond to those in Fig. 1a. a Genes encoding structural components of basement membranes (M5887) and collagen proteins (M3005). b Genes encoding core extracellular matrix components, including ECM glycoproteins, collagens and proteoglycans (M5884), excluding the genes contained in Fig. 4A. c Genes encoding cytokines (GO:0005125) and growth factors (GO:0008083). d Gene Ontology analysis of marker genes for each cluster. e KEGG enrichment analysis of marker genes for each cluster.
Fig. 3
Fig. 3. Trajectory analysis of fibroblasts and myofibroblasts in human colonic mucosa.
a Monocle trajectories of fibroblasts from normal mucosa. Cells are colored by Monocle state (left) and pseudotime (right). b Heatmap showing the dynamic changes in pseudotime-dependent transcription factors over pseudotime. c Feature plots of the expression distribution for selected transcription factors across pseudotime. d The stacked bar chart shows the percentage of fibroblasts from distinct clusters across the pseudotime states. e Plots of the minimum spanning tree on cells, split by cluster.
Fig. 4
Fig. 4. Integrated analysis of fibroblasts and myofibroblasts in human colonic mucosa and in human colon cancer tissues.
a Comparison of colonic mucosal fibroblasts and colon cancer fibroblasts. UMAP projection of integrated analysis displayed separately by sample type. b Comparison of cell composition between mucosa and cancer tissues in each patient. c Table displays comparison of mean cell proportion of each cluster between mucosa and cancer tissue and number of significantly differentially expressed genes (padj < 0.05 & Log2FC > 1, decrease Increase: padj < 0.05 & Log2FC < -1). d Dot plot showing the scaled expression of signature genes for each cluster in mucosa and CRC. The colors representing each cluster in the color band correspond to those in Fig. 4a.
Fig. 5
Fig. 5. Immunofluorescence staining of fibroblasts and myofibroblasts in human colonic mucosa.
a Left: HHIP+ fibroblasts in normal mucosa labeled by α-SMA (red) and HHIP (green). Arrows point at the cells expressing both markers. Scale bar indicates 100 μm. Right: The correlation between ACTA2 and HHIP expression in each cell. Fibroblasts in the HHIP+ cluster were double positive for both ACTA2 and HHIP. b Double labeling for α-SMA (green) and CD31 (red). Scale bar indicates 100 μm. c Double labeling for α-SMA (red) and Keratin 20 (green). Scale bar indicates 100 μm. d Double labeling for fibroblast markers α-SMA (green) and Decorin (red) in the colonic mucosa. Vertical section (left) and cross section (right) of the colonic mucosa. Scale bar indicates 200 μm (left) and 100 μm (right). e Double labeling for Keratin 20 (green) and Podoplanin (red). Vertical section (left) and cross section (right) of the colonic mucosa. Scale bar indicates 100 μm. f Double labeling for Decorin (green) and CD31(red). Scale bar indicates 100 μm. g Double labeling for Decorin (green) and CDX2(red) in the colonic mucosa. Scale bar indicates 50 μm. h Double labeling for Decorin (red) and Podoplanin (green). Each fluorescent channel was displayed separately. Scale bar indicates 100 μm. DAPI: 4′,6-diamidino-2-phenylindole, blue-fluorescent labeling nuclei; α-SMA, α-smooth muscle actin, encoded by ACTA2 gene; Decorin, encoded by DCN gene. Podoplanin encoded by PDPN. HHIP, Hedgehog interacting protein, encoded by HHIP gene. Keratin 20, labeling mature enterocytes. CDX2, Caudal Type Homeobox 2, an intestinal specific transcription factor labeling intestinal epithelial and cancer cell. CD31, Platelet and Endothelial Cell Adhesion Molecule 1, labeling endothelial cells. CD45, Protein Tyrosine Phosphatase Receptor Type C, labeling immune cells.
Fig. 6
Fig. 6. Immunofluorescence staining of fibroblasts and myofibroblasts in human colon cancer tissues.
a HHIP+ fibroblasts in CRC colon cancer tissues labeled with αSMA (red) and HHIP (green). Arrows point at the cells expressing both markers. Scale bar indicates 100 μm. b Double labeling for α-SMA (red) and RGS5 (green) in colon cancer tissues. Scale bar indicates 100 μm. c Double labeling for α-SMA (green) and CD45 (red) in colon cancer tissues. Scale bar indicates 100 μm. d Double labeling for α-SMA (green) and Podoplanin (red) in colon cancer tissues. Scale bar indicates 100 μm. e Double labeling for α-SMA (green) and Decorin (red) in colon cancer tissues. Each fluorescent channel was displayed separately. f Double labeling for α-SMA (green) and CD31 (red) in colon cancer tissues. g Double labeling for Keratin 20 (green) and α-SMA (red) in colon cancer tissues. h Double labeling for Decorin (green) and CDX2 (red) in colon cancer tissues. i Double labeling for Decorin (green) and CD31 (red) in colon cancer tissues. ae The star indicates submucosa adjacent to cancer cells. Scale bar indicates 100 μm. j Double labeling for Keratin 20 (green) and Podoplanin (red) in colon cancer tissues. Scale bar indicates 200 μm. k Double labeling for Podoplanin (green) and CD45 (red) in colon cancer tissues. Scale bar indicates 100 μm.
Fig. 7
Fig. 7. Fibroblastic populations in human colon mucosa and colon cancer tissues.
Schematic illustration of the composition and location of types of fibroblasts in a normal human colon mucosa and b colon cancer tissues. The cell composition ratio of the subpopulation is indicated in the rectangular box. The rest of the cell types are omitted in the schematic illustration.

References

    1. Mifflin RC, Pinchuk IV, Saada JI, Powell DW. Intestinal myofibroblasts: targets for stem cell therapy. Am. J. Physiol. Gastrointest. Liver Physiol. 2011;300:G684–G696. doi: 10.1152/ajpgi.00474.2010. - DOI - PMC - PubMed
    1. Roulis M, Flavell RA. Fibroblasts and myofibroblasts of the intestinal lamina propria in physiology and disease. Differentiation. 2016;92:116–131. doi: 10.1016/j.diff.2016.05.002. - DOI - PubMed
    1. Gabbiani G, Ryan GB, Majne G. Presence of modified fibroblasts in granulation tissue and their possible role in wound contraction. Experientia. 1971;27:549–550. doi: 10.1007/BF02147594. - DOI - PubMed
    1. Richman PI, Tilly R, Jass JR, Bodmer WF. Colonic pericrypt sheath cells: characterisation of cell type with new monoclonal antibody. J. Clin. Pathol. 1987;40:593–600. doi: 10.1136/jcp.40.6.593. - DOI - PMC - PubMed
    1. Eyden B, Curry A, Wang G. Stromal cells in the human gut show ultrastructural features of fibroblasts and smooth muscle cells but not myofibroblasts. J. Cell Mol. Med. 2011;15:1483–1491. doi: 10.1111/j.1582-4934.2010.01132.x. - DOI - PMC - PubMed

Publication types