. 2022 Dec 3;15(1):62.
doi: 10.1186/s12284-022-00608-x.

The PPR-Domain Protein SOAR1 Regulates Salt Tolerance in Rice

Affiliations

The PPR-Domain Protein SOAR1 Regulates Salt Tolerance in Rice

Kai Lu et al. Rice (N Y). .

Abstract

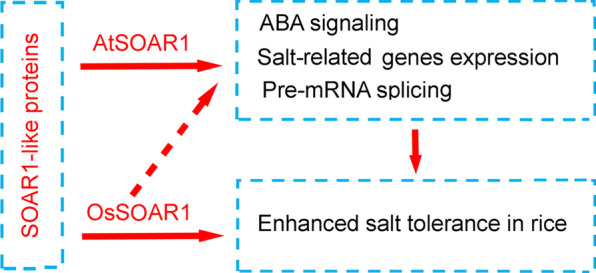
Previous studies in Arabidopsis reported that the PPR protein SOAR1 plays critical roles in plant response to salt stress. In this study, we reported that expression of the Arabidopsis SOAR1 (AtSOAR1) in rice significantly enhanced salt tolerance at seedling growth stage and promoted grain productivity under salt stress without affecting plant productivity under non-stressful conditions. The transgenic rice lines expressing AtSOAR1 exhibited increased ABA sensitivity in ABA-induced inhibition of seedling growth, and showed altered transcription and splicing of numerous genes associated with salt stress, which may explain salt tolerance of the transgenic plants. Further, we overexpressed the homologous gene of SOAR1 in rice, OsSOAR1, and showed that transgenic plants overexpressing OsSOAR1 enhanced salt tolerance at seedling growth stage. Five salt- and other abiotic stress-induced SOAR1-like PPRs were also identified. These data showed that the SOAR1-like PPR proteins are positively involved in plant response to salt stress and may be used for crop improvement in rice under salinity conditions through transgenic manipulation.

Keywords: Alternative splicing; Pentatricopeptide repeat (PPR) protein; Rice; SOAR1; Salt stress.


Conflict of interest statement

We declare that there are no competing interests.

Figures

Fig. 1
Fig. 1
Performance of AtSOAR1-transgenic plants under salt stress in early seedling stage. A Schematic diagram of the AtSOAR1-containing plant expression vector used for rice transformation. B Real-time PCR detection of AtSOAR1 transcripts level in wild-type and the two transgenic lines. Total RNA was extracted from two-week-old seedlings and used for cDNA synthesis. Actin1 was used for internal control and the expression level of AtSOAR1 in OE-1 was taken as 1. All the values are means ± SE from three independent biological determinations. C Western bolt analysis of AtSOAR1 expression in wild-type and two transgenic lines. Total protein was extracted from two-week-old seedlings and used for immunoblotting. Actin protein was taken as a loading control for immunoblotting. D Phenotypic comparison of wild-type and AtSOAR1-transgenic plants OE-1 and OE-2 grown under different concentration of NaCl solution (100 and 140 mM) at the seedling stage. Hydroponic cultured two-week-old seedlings were treated with 100 mM NaCl for 14d or 140 mM NaCl for 8d, and then recovered for 7 d. Three independent biological determinations were conducted and similar results were obtained. E, F Survival rates of the wild-type and transgenic plants as described in (d) after 7d recovery. All the values are means ± SE from three independent biological determinations. Student’s t test was used for comparing the survival rate of each overexpression line with those of wild-type plants (with significant differences at **P < 0.01). G, H Chlorophyll content G and relative ion leakage H of the wild-type and transgenic plants under normal and salt stress conditions. Two-week-old seedlings were treated with 100 mM NaCl for 9 d to assay chlorophyll content, or for 24 h to detect relative ion leakage. Student’s t test was used for comparing the chlorophyll content or relative ion leakage of each overexpression line with those of wild-type plants (with significant differences at **P < 0.01)
Fig. 2
Fig. 2
Growth status of the AtSOAR1-transgenic plants under salt stress at the reproductive stage. A Phenotypic comparison of wild-type and AtSOAR1-transgenic plants OE-1 and OE-2 grown under normal and salt stress at the reproductive stage. Two-week-old seedlings were transplanted to pot containing soil with or without 0.15% NaCl (ratio of salt weight to that of dry soil), which were then cultured for total growth period with common agriculture management. Three independent biological determinations were conducted and similar results were obtained. BD Statistics of the plant height B, tiller number C and productivity per plant D of wild-type, OE-1 and OE-2 under normal growth and salinity stress conditions. Student’s t test was used for comparing the plant height, tiller number or grain yield of each overexpression line with those of wild-type plants (with significant differences at **P < 0.01)
Fig. 3
Fig. 3
Phenotypes of AtSOAR1-transgenic plants in ABA-induced early seedling growth arrest. A Phenotypic comparison of wild-type and AtSOAR1-transgenic plants OE-1 and OE-2 in ABA-induced inhibition of seedling growth. Germinated seeds of different genotypes were cultured in ABA-free (0 μM) or ( ±) ABA-containing (4 and 8 μM) solutions for 9 d before investigation. The experiments were repeated for three times and similar results were obtained. B Quantitative evaluation of shoot and root length of the wild-type and transgenic plants as described in A. All the values are means ± SE from three independent biological determinations. Student’s t test was used for comparing the shoot length or root length of each overexpression line with those of wild-type plants (with significant differences at **P < 0.01). C Detection of ABA-responsive genes in wild-type and AtSOAR1-transgenic lines by qPCR and semi-quantitative RT-PCR. The bands from left to right indicates WT without treatment, OE-1 without treatment, OE-2 without treatment, ABA-treated WT, ABA-treated OE-1 and ABA-treated OE-2, respectively. Materials described in A was sampled for total RNA extraction and cDNA synthesis. Actin1 was used for internal control and all the values are means ± SE from three independent biological determinations
Fig. 4
Fig. 4
Expression of AtSOAR1 in rice alters global transcriptomic profiles as determined by RNA-seq analysis. A Volcano plots showing the status of differential expressed genes between different comparison groups. Red dots represent up-regulated genes and blue dots represent down-regulated genes. Horizontal axis and vertical axis represent the Log2 of fold change and the adjusted P value (FDR) of indicated genes, respectively. WT-S/WT, salt-treated WT relative to WT without treatment; OE/WT, OE-1 relative to WT without treatment; OE-S/OE, salt-treated OE-1 relative to OE-1 without treatment; OE-S/WT-S, salt-treated OE-1 relative to salt-treated WT. B Statistics of pathway enrichment of differential expressed genes between OE-1 and WT under salt treatment. Each dot represents a KEGG pathway as indicated at the vertical axis. Horizontal axis is rich factor of which value represent significance of enrich level to a certain pathway of differential expressed transcripts. C Heat map showing the clustering of the differentially expressed genes of the four comparisons groups. The clustering was drawn based on the normalized, log-scaled FPKM (fragments per kilo base of exon per million reads mapped) values. D Validation of the representative differential expressed genes by qPCR and semi-quantitative RT-PCR. The bands from left to right indicates WT without treatment, OE-1 without treatment, salt-treated WT and salt-treated OE-1, respectively. Hydroponic cultured two-week-old seedlings were treated with 140 mM NaCl for 2 d before sampled for total RNA extraction and cDNA synthesis. Actin1 was used for internal control and all the values are means ± SE from three independent biological determinations
Fig. 5
Fig. 5
Global alternative splicing analysis of wild-type and AtSOAR1-transgenic plants under salt stress. A Statistics of different kinds of alternative splicing (AS) events in wild-type and OE-1 under normal and salt stress conditions. B Statistics of genes corresponding to different kinds of AS events. The red, blue, green and grey bars indicate salt-treated OE-1, salt-treated WT, OE-1 without treatment and WT without treatment, respectively, in (A) and (B). C Representative differential alternative splicing between WT and WT-S, or WT-S and OE-S were validated by RT–PCR and showed by IGV browser. The retained intron regions were marked by red box. Hydroponic cultured two-week-old seedlings were treated with 0 or 140 mM NaCl for 2 d followed by RNA extraction and cDNA synthesis. WT, wild-type plants without NaCl treatment; WT-S, wild-type plants with NaCl treatment; OE, AtSOAR1-transgenic plants OE-1 without NaCl treatment; OE-S, AtSOAR1-transgenic plants OE-1 with NaCl treatment. Actin 1 was taken as control for RT-PCR. D Frequency distribution of nucleotides around the splicing sites. The nucleotide sequences represent the consensus sequences of 5′- and 3′- splicing sites and the size of the letter indicates frequency of certain nucleotide. WT, WT-S and OE-S means nucleotides distribution around the splicing sites in wild-type, salt-treated wild-type and salt-treated OE-1 plants. WT-S/WT means nucleotides distribution around the splicing sites of salt-induced splicing events in wild-type. OE-S/WT-S means nucleotides distribution around the splicing sites of the new salt-induced splicing events in OE-1 compared with that of wild-type plants. Red boxes marked the altered frequency of the dominant A at position − 1 of 3′ splicing sites or the frequency of the C and G at position − 1 of the 5′ splicing sites
Fig. 6
Fig. 6
Performance of OsSOAR1-transgenic plants under salt stress at early seedling stage. A Phylogenic analysis of AtSOAR1 with the homozygous PPR genes in rice using the neighbor-joining method with MEGA version 11 by alignment of the gene sequences with ClustalW. B Real-time PCR detection of OsSOAR1 transcripts level in wild-type and the two transgenic lines OsSOAR1-OE1 and OsSOAR1-OE2. Total RNA was extracted from two-week-old seedlings and used for cDNA synthesis. Actin1 was used for internal control and the expression level of OsSOAR1 in WT was taken as 1. All the values are means ± SE from three independent biological determinations. C Phenotypic comparison of wild-type and OsSOAR1-transgenic plants OsSOAR1-OE1 and OsSOAR1-OE2 grown under 140 mM NaCl solution at the seedling stage. Hydroponic cultured two-week-old seedlings were treated with 140 mM NaCl for 8d, and then recovered for 7d. Three independent biological determinations were conducted and similar results were obtained. D Survival rates of the wild-type and transgenic plants as described in C after 7d recovery. All the values are means ± SE from three independent biological determinations. Student’s t test was used for comparing the survival rate of each overexpression line with those of wild-type plants (with significant differences at **P < 0.01). E, F Chlorophyll content E and relative ion leakage F of the wild-type and transgenic plants under normal and salt stress conditions. Two-week-old seedlings were treated with 100 mM NaCl for 9 d to assay chlorophyll content, or for 24 h to detect relative ion leakage. Student’s t test was used for comparing the chlorophyll content or relative ion leakage of each overexpression line with those of wild-type plants (with significant differences at **P < 0.01)
Fig. 7
Fig. 7
Expression pattern of the five salt-induced PPR genes. A Phylogenic analysis of the rice PPR genes identified in this study using the neighbor-joining method with MEGA version 11 by alignment of the gene sequences with MUSCLE algorithm. B Confirmation of the salt-induced PPR genes of RNA-seq data by qPCR assays. Hydroponic cultured two-week-old seedlings were treated with 0 or 140 mM NaCl for 2d followed by RNA extraction and cDNA synthesis. Expression level of each gene without salt stress was taken as 1. Actin1 was used for internal control and all the values are means ± SE from three independent biological determinations. Student’s t test was used for comparing the relative expression of each PPR genes of wild-type plants under salt stress with those of wild-type plants grown under non-stressful conditions. C Expression of the five salt-induced PPR genes in response to ABA, PEG, drought and cold treatment. Hydroponic cultured two-week-old seedlings were treated with 0 or 10 µM ( ±) ABA, 100 mM PEG and cold stress for 5 h or drought stress for 2 h. The material was collected at the indicated time and used for total RNA extraction. Expression level of each gene without stress treatment was taken as 1. Actin1 was used for internal control and all the values are means ± SE from three independent biological determinations. Student’s t test was used for comparing the relative expression of each PPR genes of wild-type plants under stress treatments with those of wild-type plants grown under non-stressful conditions. D Expression level the five PPR genes were detected in different tissues by qPCR assays. Expression level of each gene in root was taken as 1. Actin1 was used for internal control and all the values are means ± SE from three independent biological determinations. Duncan’s multiple range test was used and different letters represent significant differences at P < 0.05
Fig. 8
Fig. 8
A schematic diagram of SOAR1-like proteins function under salt stress. SOAR1-like proteins positively modulate plants response to salt stress through influencing ABA signaling, salt-responsive genes expression and pre-mRNA splicing. Solid lines indicate confirmed results and dotted lines indicate unconfirmed results

References

    1. Barkan A, Small I. Pentatricopeptide repeat proteins in plants. Annu Rev Plant Biol. 2014;65:415–442. doi: 10.1146/annurev-arplant-050213-040159. - DOI - PubMed
    1. Bi C, Ma Y, Jiang SC, Mei C, Wang XF, Zhang DP. Arabidopsis translation initiation factors eIFiso4G1/2 link repression of mRNA cap-binding complex eIFiso4F assembly with RNA-binding protein SOAR1-mediated ABA signaling. New Phytol. 2019;223(3):1388–1406. doi: 10.1111/nph.15880. - DOI - PubMed
    1. Chen G, Zou Y, Hu J, Ding Y. Genome-wide analysis of the rice PPR gene family and their expression profiles under different stress treatments. BMC Genomics. 2018;19(1):720. doi: 10.1186/s12864-018-5088-9. - DOI - PMC - PubMed
    1. Cheng S, Gutmann B, Zhong X, Ye Y, Fisher MF, Bai F, et al. Redefining the structural motifs that determine RNA binding and RNA editing by pentatricopeptide repeat proteins in land plants. Plant J. 2016;85(4):532–547. doi: 10.1111/tpj.13121. - DOI - PubMed
    1. Emami H, Kumar A, Kempken F. Transcriptomic analysis of poco1, a mitochondrial pentatricopeptide repeat protein mutant in Arabidopsis thaliana. BMC Plant Biol. 2020;20(1):1–21. doi: 10.1186/s12870-020-02418-z. - DOI - PMC - PubMed

LinkOut - more resources