. 2022 Dec 3;12(1):20883.
doi: 10.1038/s41598-022-25378-w.

Comprehensive sequence and expression profile analysis of the phosphate transporter gene family in soybean

Affiliations

Comprehensive sequence and expression profile analysis of the phosphate transporter gene family in soybean

Xiaoshuang Wei et al. Sci Rep. .

Abstract

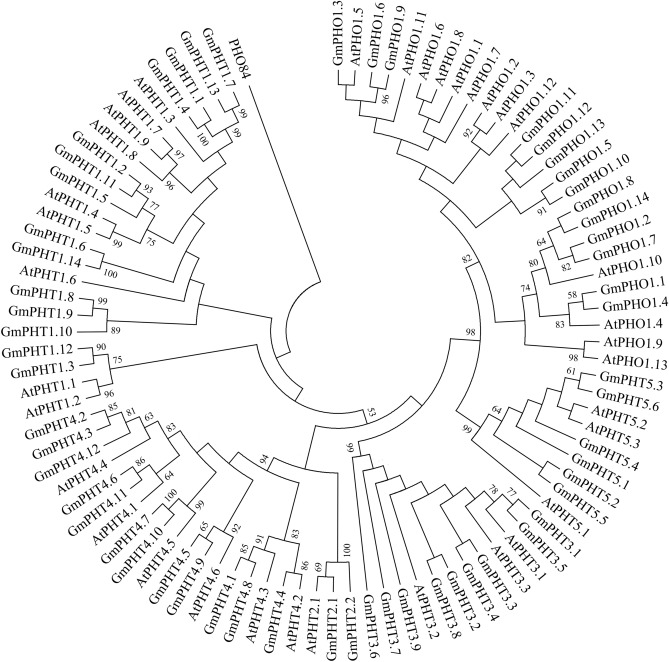
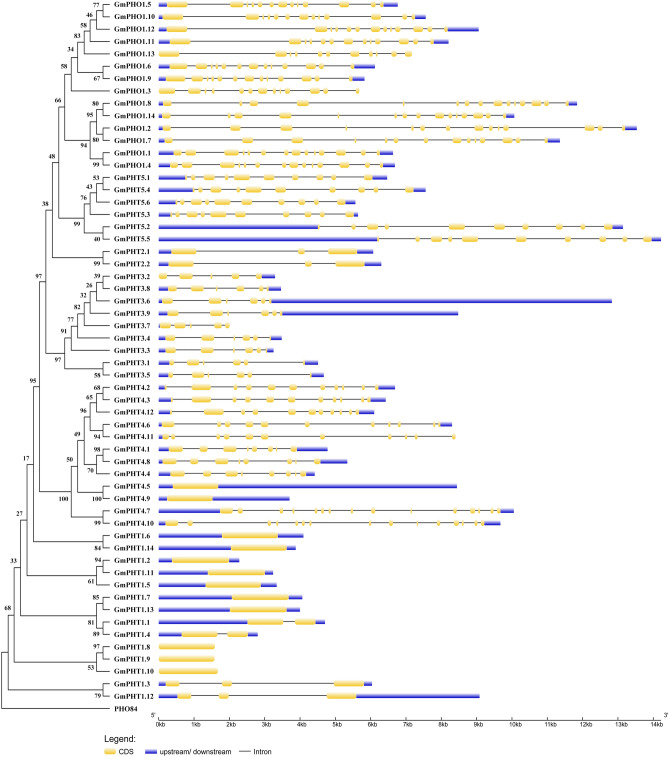
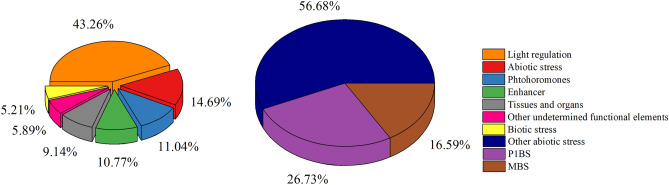
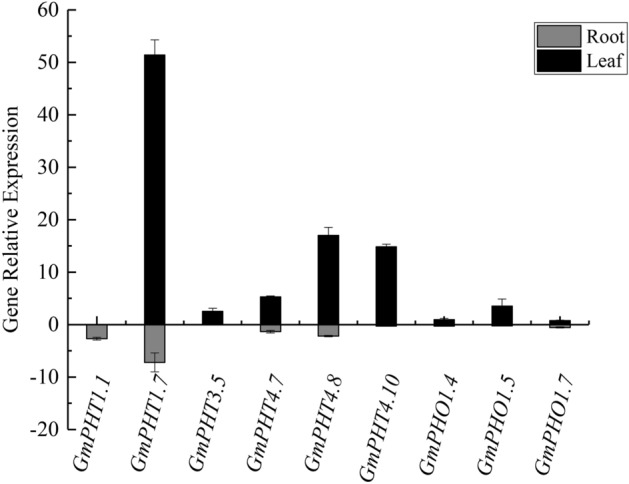
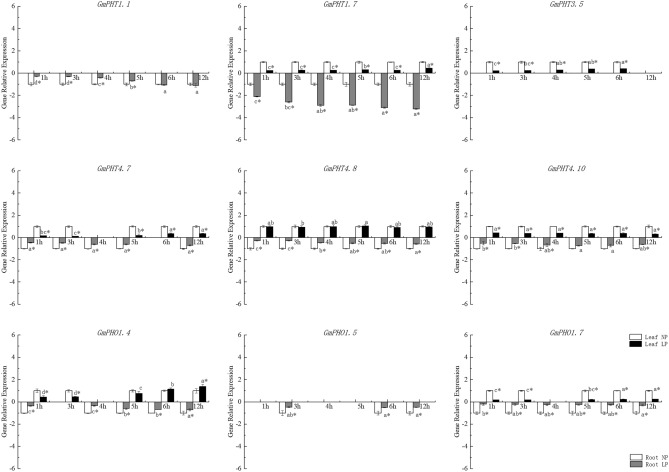
The family of phosphate transporters (PHTs) mediates the uptake and translocation of Pi inside the plants. However, little is known about transporters in soybean. Therefore, Searched the Genome Database for Soybean, 57 GmPHTs family members were identified in soybean, Phylogenetic analysis suggested that members of the PHTs gene family can be divided into six clades. Collinearity analysis revealed that most of the GmPHT genes shared syntenic relationships with PHTs members in Arabidopsis thaliana and that large segment duplication played a major driving force for GmPHTs evolution in addition to tandem duplication. Further analysis of the promoter revealed that light-responsive elements and abiotic stress-responsive elements were widely distributed within the promoter regions of GmPHT genes. Based on RNA-seq data, GmPHTs showed different expression patterns in roots and leaves of soybean treated with long-term low phosphorus and short-term low phosphorus, in addition, the expression levels of GmPHT genes can be regulated by drought stresses, it was implied that the induced expression of GmPHTs could promote phosphorus uptake and transport in soybean and thus adapt to low phosphorus and drought stress, which is the first step dissection of Pi transport system and probably refers to new roles of PHTs genes in soybean.


Conflict of interest statement

The authors declare no competing interests.

Figures

Figure 1
Figure 1
Phylogenetic tree of coding nucleotide sequences of the phosphate transporter family (PHT) in soybean and Arabidopsis thaliana. Note: The names of the genes used in soybean are referred to Table 1, and the names of the genes used in Arabidopsis are as follows. At1g68740(AtPHO1.1), At2g03260(AtPHO1.2), At1g14040(AtPHO1.3), At4g25350(AtPHO1.4), At2g03240(AtPHO1.5), AT2G03240(AtPHO1.6), At1g26730(AtPHO1.7), At1g35350(AtPHO1.8), At3g29060(AtPHO1.9), At1g69480(AtPHO1.10), AT3G29060(AtPHO1.11), AT4G25350(AtPHO1.12), AT5G35730(AtPHO1.13), AT5G43350(AtPHT1;1), AT5G43370(AtPHT1;2), AT5G43360(AtPHT1;3), AT2G38940(AtPHT1;4), AT2G32830(PHT1;5), AT5G43340(AtPHT1;6), AT3G54700(AtPHT1;7), AT1G20860(AtPHT1;8), AT1G76430(AtPHT1;9), AT3G26570(AtPHT2;1), AT5G14040(AtPHT3;1), AT3G48850(AtPHT3;2), AT2G17270(AtPHT3;3), AT2G29650(AtPHT4;1), AT2G38060(AtPHT4;2), AT3G46980(AtPHT4;3), AT4G00370(PHT4;4), AT5G20380(AtPHT4;5), AT5G44370(AtPHT4;6), AT1G63010(AtPHT5;1), AT4G11810(PHT5;2), AT4G22990(AtPHT5;3),
Figure 2
Figure 2
GmPHTs collinearity analysis results. Note: Members of the same subfamily are represented by the same color. Solid lines between genes indicate collinearity between the two. The genes enclosed in boxes are formed in the form of tandem repeats. The covariance data between chromosomes are cited Liu, et al. 2015.
Figure 3
Figure 3
Analysis of the gene structure and protein-specific motifs of GmPHTs.
Figure 4
Figure 4
The promoter element composition of GmPHTs gene.
Figure 5
Figure 5
qRT-PCR results of GmPHT genes in soybean roots and leaves.
Figure 6
Figure 6
qRT-PCR results of nine GmPHT genes in roots and leaves of soybean treated with low phosphorus as well as drought.
Figure 7
Figure 7
Coexpression networks of 2 PHTs family genes in soybean. (A), Glyma02G005800 (GmPHT1.1) coexpression network diagram; (B), Glyma02G130200 (GmPHO1.4) coexpression network diagram; The size of the node is proportional to the degree of the node, the more edges connected to the node, the greater its degree and the larger the node; the color indicates the strength of the interaction, the redder the color the stronger the interaction. The PHTs family genes located in the center of the network, while the most coexpressed genes were displayed in each network.

References

    1. Roch GV, Maharajan T, Ceasar SA, Ignacimuthu S. The role of PHT1 family transporters in the acquisition and redistribution of phosphorus in plants. CRC. Crit. Rev. Plant Sci. 2019;38:171–198. doi: 10.1080/07352689.2019.1645402. - DOI
    1. Razaq M, Zhang P, Shen H, Salahuddin S. Influence of nitrogen and phosphorous on the growth and root morphology of Acer mono. PLoS ONE. 2017;12:e0171321. doi: 10.1371/journal.pone.0171321. - DOI - PMC - PubMed
    1. Hui Y, Dong L. Signaling components involved in plant responses to phosphate starvation. J. Chin. Bot. (Engl. Vers.) 2010;50(7):849–859. - PubMed
    1. Raghothama KG. Phosphate transport and signaling. Curr. Opin. Plant Biol. 2000;3(3):182–187. doi: 10.1016/S1369-5266(00)00062-5. - DOI - PubMed
    1. Tingting S, Mingjun Li, Yun S, Lingyan Yu, Fengwang Ma. Comprehensive genomic identification and expression analysis of the phosphate transporter (PHT) gene family in apple. J. Front. Plant Sci. 2017;8:426. - PMC - PubMed

Publication types