. 2023 Jan;193(1):84-102.
doi: 10.1016/j.ajpath.2022.09.007. Epub 2022 Dec 1.

Esr1 but Not CYP19A1 Overexpression in Mammary Epithelial Cells during Reproductive Senescence Induces Pregnancy-Like Proliferative Mammary Disease Responsive to Anti-Hormonals

Affiliations

Esr1 but Not CYP19A1 Overexpression in Mammary Epithelial Cells during Reproductive Senescence Induces Pregnancy-Like Proliferative Mammary Disease Responsive to Anti-Hormonals

Priscilla A Furth et al. Am J Pathol. 2023 Jan.

Abstract

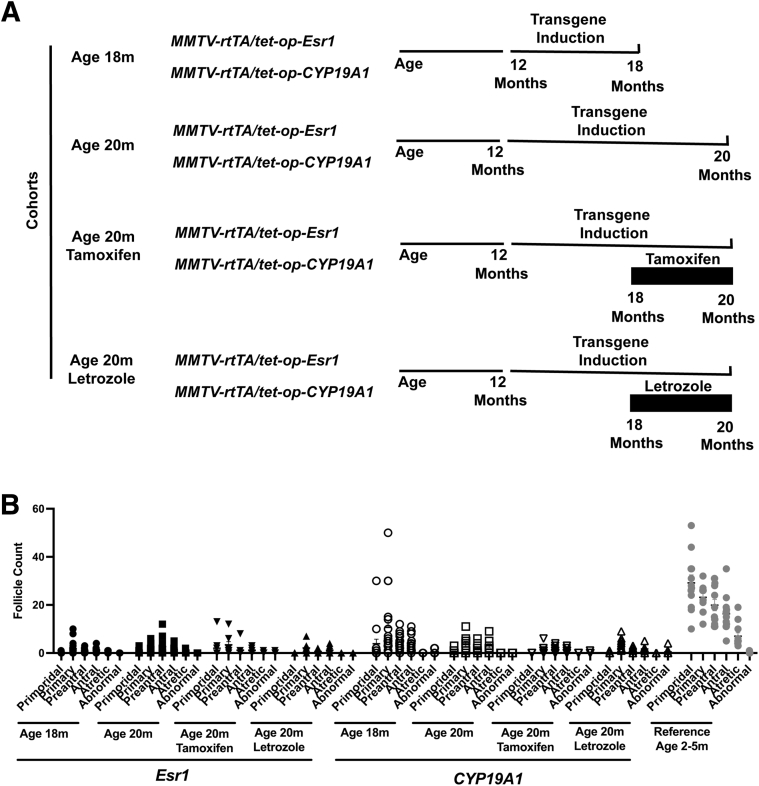
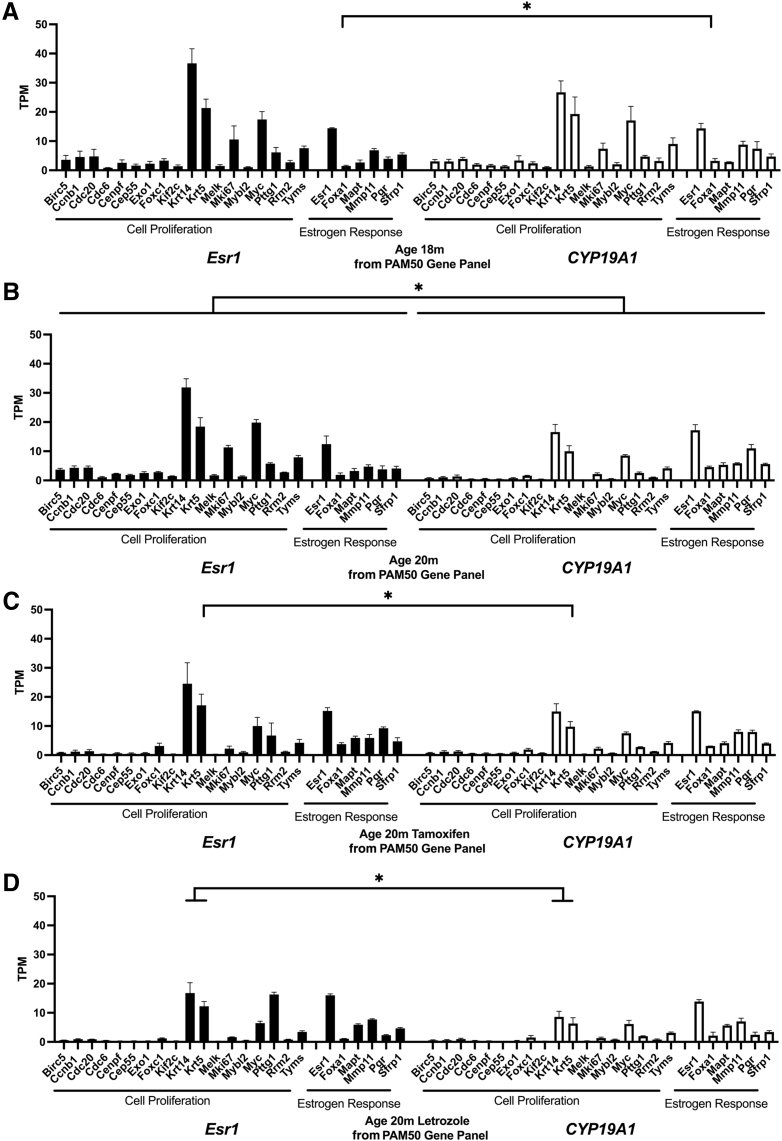
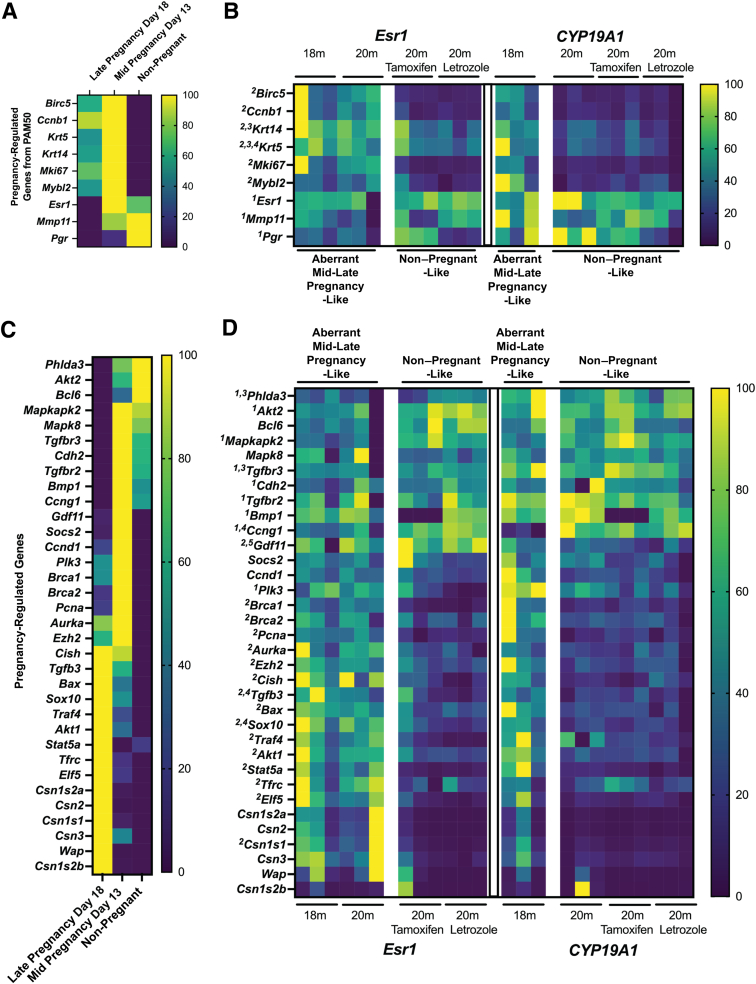
Molecular-level analyses of breast carcinogenesis benefit from vivo disease models. Estrogen receptor 1 (Esr1) and cytochrome P450 family 19 subfamily A member 1 (CYP19A1) overexpression targeted to mammary epithelial cells in genetically engineered mouse models induces largely similar rates of proliferative mammary disease in prereproductive senescent mice. Herein, with natural reproductive senescence, Esr1 overexpression compared with CYP19A1 overexpression resulted in significantly higher rates of preneoplasia and cancer. Before reproductive senescence, Esr1, but not CYP19A1, overexpressing mice are tamoxifen resistant. However, during reproductive senescence, Esr1 mice exhibited responsiveness. Both Esr1 and CYP19A1 are responsive to letrozole before and after reproductive senescence. Gene Set Enrichment Analyses of RNA-sequencing data sets showed that higher disease rates in Esr1 mice were accompanied by significantly higher expression of cell proliferation genes, including members of prognostic platforms for women with early-stage hormone receptor-positive disease. Tamoxifen and letrozole exposure induced down-regulation of these genes and resolved differences between the two models. Both Esr1 and CYP19A1 overexpression induced abnormal developmental patterns of pregnancy-like gene expression. This resolved with progression through reproductive senescence in CYP19A1 mice, but was more persistent in Esr1 mice, resolving only with tamoxifen and letrozole exposure. In summary, genetically engineered mouse models of Esr1 and CYP19A1 overexpression revealed a diversion of disease processes resulting from the two distinct molecular pathophysiological mammary gland-targeted intrusions into estrogen signaling during reproductive senescence.


Figures

None
Graphical abstract
Figure 1
Figure 1
Experimental design and characterization of ovarian follicle counts during reproductive senescence at 18 and 20 months (m) of age. A: Study cohort design: Esr1 and CYP19A1 transgene expression was induced at age 12 months. The end point at age 18 months had no intervention. The end point at age 20 months was with s.c. pellet placement surgery at age 18 months for anti-hormonal exposure [none, tamoxifen (25 mg/60-day release), or letrozole (2.5 mg/60-day release)]. B: Scatterplots illustrate distribution of ovarian follicle counts of Esr1 and CYP19A1 mice at 18 and 20 months of age without and with tamoxifen or letrozole exposure. Follicle counts of wild-type mice at 2 to 5 months of age shown for reference. Black fill: Esr1. White fill: CYP19A1. Circles: age 18m (n = 18 Esr1, n = 22 CYP19A1). Squares: age 20m (n = 11 Esr1, N = 10 CYP19A1). Inverted triangle: age 20m with 2 months tamoxifen exposure (n = 9 Esr1, n = 10 CYP19A1). Triangle: age 20m with 2 months letrozole exposure (n = 9 Esr1, n = 11 CYP19A1). Gray circles: wild type (n = 12). Primordial, primary, preantral, antral, and atretic follicle counts significantly lower in all cohorts of 18- and 20-month–old mice compared with 2- to 5-month–old mice (P < 0.005, multiple unpaired t-tests, GraphPad Prism version 9.3.1). Data are presented as means ± SEM (B). MMTV, mouse mammary tumor virus; rtTA, reverse tetracycline–controlled transactivator; tet-op, tet-operator.
Figure 2
Figure 2
Impact of reproductive senescence and anti-hormonal exposure on patterns of mammary gland branching and lobular growth in mouse estrogen receptor 1 (Esr1) and human cytochrome P450 family 19 subfamily A member 1 (aromatase; CYP19A1) mice. A: Bar graphs illustrating percentage of Esr1 and CYP19A1 mice with secondary and tertiary branching in each cohort. Esr1: age 18 months (m) n = 20; age 20m n = 19; age 20m tamoxifen n = 24; age 20m letrozole n = 20. CYP19A1: age 18m n = 21; age 20m n = 18; age 20m tamoxifen n = 23; age 20m letrozole n = 24. B: Bar graphs illustrating percentage of Esr1 and CYP19A1 mice with and without lobular growth in each cohort. Esr1: age 18m n = 20; age 20m n = 19; age 20m tamoxifen n = 24; age 20m letrozole n = 20. CYP19A1: age 18m n = 21; age 20m n = 18; age 20m tamoxifen n = 23; age 20m letrozole n = 24. CJ: Representative mammary gland whole mounts of 18-month–old Esr1 (C) and CYP19A1 (D) mice, 20-month–old Esr1 (E) and CYP19A1 (F) mice, tamoxifen-exposed 20-month–old Esr1 (G) and CYP19A1 (H) mice, and letrozole-exposed Esr1 (I) and CYP19A1 (J) mice, with right-hand arrow indicating generally decreasing lobular growth prevalence with age and anti-hormonal exposure. All images scaled identically. White asterisks indicate presence of lobular growth to varying degrees in different cohorts. ∗P < 0.05, ∗∗P < 0.01, and ∗∗∗P < 0.001 (Fisher exact test, two sided, GraphPad Prism version 9.3.1). Scale bar = 1000 μm (CJ). Original magnification, ×0.5 (CJ).
Figure 3
Figure 3
Effect of reproductive senescence and anti-hormonal exposure on mammary gland cellularity, preneoplasia, and cancer in Esr1 and CYP19A1 mice. A: Bar graphs illustrate percentage of mice with low, medium, or high epithelial cellularity in Esr1 and CYP19A1 cohorts. Esr1: age 18 months (m) n = 20; age 20m n = 19; age 20m tamoxifen n = 24; age 20m letrozole n = 20. CYP19A1: age 18m n = 22; age 20m n = 18; age 20m tamoxifen n = 23; age 20m letrozole n = 24. P values determined by Fisher exact test, Freeman-Halton extension (http://vassarstats.net/fisher2x3.html, last accessed August 7, 2022). B: Bar graphs illustrate percentage of mice with at least one hyperplastic alveolar nodule (HAN) detected in Esr1 and CYP19A1 cohorts. Esr1: age 18m n = 20; age 20m n = 19; age 20m tamoxifen n = 24; age 20m letrozole n = 20. CYP19A1: age 18m n = 21; age 20m n = 18; age 20m tamoxifen n = 23; age 20m letrozole n = 24. P values determined by Fisher exact test, two sided, GraphPad Prism version 9.3.1. C: Bar graphs illustrate percentage of Esr1 and CYP19A1 mice with completely normal versus preneoplastic versus cancer findings. Esr1: age 18m n = 20; age 20m n = 19; age 20m tamoxifen n = 24; age 20m letrozole n = 20. CYP19A1: age 18m n = 22; age 20m n = 18; age 20m tamoxifen n = 23; age 20m letrozole n = 24. P values determined by Fisher exact test, Freeman-Halton extension (http://vassarstats.net/fisher2x3.html, last accessed August 7, 2022). D: Bar graphs illustrating numbers of combinations of preneoplasia and cancer found in Esr1 and CYP19A1 mice. Total number of mice in each cohort listed on x axis. P values determined by Fisher exact test, two sided, GraphPad Prism version 9.3.1, number of mice with preneoplasia/cancer versus those with only normal findings. ∗P < 0.05, ∗∗P < 0.01, and ∗∗∗∗P < 0.0001. DCIS, ductal carcinoma in situ; DH, ductal hyperplasia; LH, lobular hyperplasia.
Figure 4
Figure 4
Comparison of histology and estrogen receptor α (ER) immunohistochemistry in mouse estrogen receptor 1 (Esr1) and human cytochrome P450 family 19 subfamily A member 1 (aromatase; CYP19A1) mice. Representative images of ER immunohistochemistry of normal ducts (AC), ductal hyperplasia (DH; D and E), lobular hyperplasia (LH; F and G), ductal carcinoma in situ (DCIS; HJ), adenosis (KM), adenosquamous cancers (NP), and adenocarcinomas (Q and R). For comparison, representative images of ER immunohistochemistry of normal ducts from CYP19A1 20-month–old, tamoxifen-exposed CYP19A1 20-month–old, and letrozole-exposed Esr1 mice shown in Supplemental Figure S1. Black arrows indicate representative cells with nuclear-localized ER staining. Scale bar = 10 μm (AR).
Figure 5
Figure 5
RNA-sequencing analyses indicating mouse estrogen receptor 1 (Esr1) and human cytochrome P450 family 19 subfamily A member 1 (aromatase; CYP19A1) mice with the highest numbers of differentially expressed genes (DEGs) at age 20 months (m), and Esr1 mice with significant enrichment in HALLMARK gene sets related to cell cycle progression. A: Bar graphs presenting numbers of statistically significantly differentially expressed protein-coding genes between Esr1 and CYP19A1 mice at age 18m. P-value adjusted (Padj) < 0.05 (DESeq2). B: Bar graphs showing three HALLMARK gene sets with smallest –LOG10 false discovery rate (FDR) q-values following Gene Set Enrichment Analysis (GSEA) of protein-coding genes significantly up-regulated in Esr1 mice at age 18m. C: Bar graphs showing three HALLMARK gene sets with smallest –LOG10 FDR q-values following GSEA of protein-coding genes significantly up-regulated in CYP19A1 mice at age 18m. D: Bar graphs presenting numbers of statistically significantly differentially expressed protein-coding genes between Esr1 and CYP19A1 mice at age 20m. Padj < 0.05 (DESeq2). E: Bar graphs showing three HALLMARK gene sets with smallest –LOG10 FDR q-values following GSEA of protein-coding genes significantly up-regulated in Esr1 mice at age 20m. F: Bar graphs showing three HALLMARK gene sets with smallest –LOG10 FDR q-values following GSEA of protein-coding genes significantly up-regulated in CYP19A1 mice at age 20m. G: Bar graphs presenting numbers of statistically significantly differentially expressed protein-coding genes between Esr1 and CYP19A1 mice at age 20m following 2 months tamoxifen exposure. Padj < 0.05 (DESeq2). H: Bar graphs showing three HALLMARK gene sets with smallest –LOG10 FDR q-values following GSEA of protein-coding genes significantly up-regulated in Esr1 mice at age 20m following 2 months tamoxifen exposure. I: Bar graphs showing three HALLMARK gene sets with smallest –LOG10 FDR q-values following GSEA of protein-coding genes significantly up-regulated in CYP19A1 mice at age 20m following 2 months tamoxifen exposure. J: Bar graphs presenting numbers of statistically significantly differentially expressed protein-coding genes between Esr1 and CYP19A1 mice at age 20m following 2 months letrozole exposure. Padj < 0.05 (DESeq2). K: Bar graphs showing three HALLMARK gene sets with smallest –LOG10 FDR q-values following GSEA of protein-coding genes significantly up-regulated in Esr1 mice at age 20m following 2 months tamoxifen exposure. L: Bar graphs showing three HALLMARK gene sets with smallest –LOG10 FDR q-values following GSEA of protein-coding genes significantly up-regulated in CYP19A1 mice at age 20m following 2 months tamoxifen exposure. n = 3 mice per cohort (AL). E2, estrogen; E2F, E2 transcription factor; EMT, epithelial-mesenchymal transition; IFN, interferon; KRAS, Kirsten rat sarcoma viral oncogene homolog.
Figure 6
Figure 6
Significant differences in expression levels of cell proliferation and estrogen response genes between mouse estrogen receptor 1 (Esr1) and human cytochrome P450 family 19 subfamily A member 1 (aromatase; CYP19A1) mice at age 20 months (m) were generally resolved by anti-hormonal exposure. Bar graphs showing comparative expression levels of cell proliferation and estrogen signaling genes from the human Prediction Analysis of Microarray 50 (PAM50) prognostic gene panel for estrogen receptor α–positive (ER+) breast cancer in Esr1 and CYP19A1 mice at age 18m (A), age 20m (B), age 20m following 2 months of tamoxifen exposure (C), and age 20m following 2 months of letrozole exposure (D). Data are given as means ± SEM (AD). n = 3 mice per cohort (AD). ∗P-value adjusted < 0.05 (DESeq2). Birc5, baculoviral IAP repeat containing 5; Ccnb1, cyclin B1; Cdc20, cell division cycle 20; Cdc6, cell division cycle 6; Cenpf, centromere protein F; Cep55, centrosomal protein 55; Exo1, exonuclease 1; Foxa1, forkhead box A1; Foxc1, forkhead box C1; Kif2c, kinesin family member 2; Krt14, keratin 14; Krt5, keratin 5; Mapt, microtubule-associated protein tau; Melk, maternal embryonic leucine zipper kinase; Mki67, marker of proliferation Ki-67; Mmp11, matrix metallopeptidase 11; Mybl2, MYB proto-oncogene like 2; Myc, MYC proto-oncogene, BHLH transcription factor; Pgr, progesterone receptor; Pttg1, PTTG1 regulator of sister chromatid separation, securin; Rrm2, ribonucleotide reductase regulatory subunit M2; Sfrp1, secreted frizzled related protein 1; TPM, transcripts per million; Tyms, thymidylate synthetase.
Figure 7
Figure 7
Mouse estrogen receptor 1 (Esr1) overexpression associated with abnormal expression patterns of pregnancy-related genes. A: Heat map showing relative expression levels of nine pregnancy-regulated genes identified as differentially expressed between Esr1 and human cytochrome P450 family 19 subfamily A member 1 (aromatase; CYP19A1) mice age 20 months (m) that are also members of the human Prediction Analysis of Microarray 50 (PAM50) prognostic gene panel for estrogen receptor α–positive (ER+) breast cancer at late pregnancy (day 18), mid-pregnancy (day 13), and in non-pregnant mice (downloaded data from 2-month–old mice: GSE70440, https://www.ncbi.nlm.nih.gov/geo/query/acc.cgi?acc=GSE70440, last accessed September 17, 2022). B: Heat map highlighting end points with aberrant pregnancy-like and non–pregnant-related expression patterns of the nine pregnancy-related genes across all four end points in the Esr1 and CYP19A1 mice. 1Genes expressed at significantly higher levels in CYP19A1 mice age 20m: Esr1, matrix metallopeptidase 11 (Mmp11), and progesterone receptor (Pgr). 2Genes expressed at significantly higher levels in Esr1 mice age 20m: baculoviral IAP repeat containing 5 (Birc5), cyclin B1 (Ccnb1), keratin 14 (Krt14), keratin 5 (Krt5), marker of proliferation Ki-67 (Mki67), and MYB proto-oncogene like 2 (Mybl2). 3Krt14, Krt5, P-value adjusted (Padj) < 0.05, DESeq2, higher Esr1 age 20m with 2 months letrozole exposure. 4Krt5, Padj < 0.05, DESeq2, higher Esr1 age 20m with 2 months tamoxifen exposure. C: Heat map illustrating relative expression levels of an additional 34 pregnancy-regulated genes at late pregnancy (day 18), mid-pregnancy (day 13), and in non-pregnant mice. D: Heat map highlighting end points with aberrant pregnancy-like and non–pregnant-related expression patterns of the 34 additional pregnancy-related genes across all four end points in the Esr1 and CYP19A1 mice. 1Genes expressed at significantly higher levels in CYP19A1 mice age 20m: Pleckstrin homology-like domain family A member 3 (Phlda3), AKT serine/threonine kinase 2 (Akt2), mitogen-activated protein kinase activated protein kinase 2 (Mapkapk2), transforming growth factor-β receptor 3 (Tgfbr3), cadherin 2 (Cdh2), transforming growth factor-β receptor 2 (Tgfbr2), bone morphogenetic protein 1 (Bmp1), cyclin G1 (Ccng1), and Polo-like kinase 3 (Plk3), Padj < 0.05, DESeq2. 2Genes expressed at significantly higher levels in Esr1 mice age 20m: growth differentiation factor 11 (Gdf11), BRCA1 DNA repair associated (Brca1), BRCA2 DNA repair associated (Brca2), proliferating cell nuclear antigen (Pcna), Aurora kinase A (Aurka), enhancer of zeste 2 polycomb repressive complex 2 subunit (Ezh2), cytokine-inducible SH2 containing protein (Cish), Tgfb3, BCL2-associated X, apoptosis regulator (Bax), SRY-box transcription factor 10 (Sox10), tumor necrosis factor receptor-associated factor 4 (Traf4), AKT serine/threonine kinase 1 (Akt1), Stat5a, transferrin receptor (Tfrc), E74-like ETS transcription factor 5 (Elf5), and casein α S1 (Csn1s1), Padj < 0.05, DESeq2. 3Phlda3, Tgfbr3 Padj < 0.05, DESeq2, higher CYP19A1 age 18m. 4Tgfb3, Sox10, Ccng1 Padj < 0.05, DESeq2, higher Esr1 age 18m. 5Gdf11 Padj < 0.05, DESeq2, higher Esr1 age 20m with both 2 months exposure to tamoxifen and letrozole. Yellow indicates highest expression level, and dark blue indicates lowest expression level, for each gene. Relative expression levels shown for unique individual samples. n = 3 for each cohort (B and D). Bcl6, BCL6 transcription repressor; Ccnd1, cyclin D1; Csn1s2a, casein α s2-like A; Csn1s2b, casein α s2-like B; Csn2, casein β; Csn3, casein κ; Mapk8, mitogen-activated protein kinase 8; Socs2, suppressor of cytokine signaling 2; Wap, whey acidic protein.
Figure 8
Figure 8
Higher prevalence of dense uniform pregnancy-like alveolar growth and increased overall mammary gland density in mouse estrogen receptor 1 (Esr1) mice is resolved by tamoxifen exposure. A: Bar graphs illustrate percentage of mice with dense uniform pregnancy-like alveolar development in Esr1 and human cytochrome P450 family 19 subfamily A member 1 (aromatase; CYP19A1) cohorts. Esr1: age 18 months (m) n = 20; age 20m n = 19; age 20m tamoxifen n = 24; age 20m letrozole n = 20. CYP19A1: age 18m n = 21; age 20m n = 18; age 20m tamoxifen n = 23; age 20m letrozole n = 24. P values determined by Fisher exact test, two sided, GraphPad Prism version 9.3.1. B: Scatterplots illustrate distribution of relative mean mammary gland density scores in each cohort of Esr1 and CYP19A1 mice. Esr1: age 18m n = 18; age 20m n = 13; age 20m tamoxifen n = 15; age 20m letrozole n = 9. CYP19A1: age 18m n = 17; age 20m n = 14; age 20m tamoxifen n = 16; age 20m letrozole n = 16. Median indicated. P values determined by U-test, two tailed, GraphPad Prism version 9.3.1. Black arrow indicates that lower mammary gland density scores, which are based on pixel intensity readings of mammary gland whole mount images, correlate with higher mammary gland density. C: Heat map illustrating expression patterns of immune-related genes significantly differentially expressed between Esr1 and CYP19A1 mice at 12 months with transgene expression from birth [P-value adjusted (Padj) < 0.05, DESeq2] versus 18- and 20-month–old cohorts with transgene expression initiated at age 12 months. Differentially expressed genes (DEGs; Padj < 0.05, DESeq2) higher in Esr1 compared with CYP19A1 mice at age 18 m1, age 20 m2, age 20m following 2 months tamoxifen exposure3, and age 20m following 2 months of letrozole exposure4. DEGs (Padj < 0.05, DESeq2) higher in CYP19A1 compared with Esr1 mice at age 20 m5 and age 20m following 2 months of letrozole exposure6. Yellow indicates highest expression level, and dark blue indicates lowest expression level, for each gene. Relative expression levels shown for unique individual samples. 12m cohorts: n = 2. 18m and 20m cohorts: n = 3. ∗P < 0.05, ∗∗P < 0.01, and ∗∗∗P < 0.001. Dio2, iodothyronine deiodinase; Ear2, eosinophil-associated, ribonuclease A family, member 2; Fosb, FosB proto-oncogene, AP-1 transcription factor subunit; Gbp8, guanylate-binding protein 8; Gbp9, guanylate-binding protein 9; Gzmb, granzyme B; H2-Q7, histocompatibility 2, Q region locus 7; IFNG, interferon-γ; Il2rb, IL-2 receptor subunit β; Irf7, interferon regulatory factor 7; Irs2, insulin receptor substrate 2; Kbtdb12, Kelch repeat and BTB domain containing 12; NFKB, NF-κB; Nlrc5, NLR family CARD domain-containing 5; Nr4a1, nuclear receptor subfamily 4 group A member 1; Per1, period circadian regulator 1; Sectm1b, secreted and transmembrane protein 1b; Tap1, transporter 1, ATP binding cassette subfamily B member; Tfcp2l1, transcription factor CP2-like 1; Tgtp2, T-cell–specific GTPase 2; TNFA, tumor necrosis factor-α; Wnk4, WNK lysine-deficient protein kinase 4; Zbp1, Z-DNA binding protein 1.
Supplemental Figure S1
Transgene expression validation and representative images of estrogen receptor α (ER) immunohistochemistry of mammary gland ducts from cohorts not shown in Figure 3, E–G. A: Bar graphs illustrate relative percentage transgene expression levels in mammary tissue from each cohort compared with age 18 months (m; set at 100%). Two unique primer pairs (Sp3 and Sp4) are presented for mouse estrogen receptor 1 (Esr1) mice, and one primer pair is presented for human cytochrome P450 family 19 subfamily A member 1 (aromatase; CYP19A1) mice. Esr1: age 18m n = 2; age 20m n = 2; age 20m tamoxifen n = 3; age 20m letrozole n = 1. CYP19A1: age 18m n = 3; age 20m n = 1; age 20m tamoxifen n = 1; age 20m letrozole n = 1. BF: ER immunohistochemistry of ducts from 18-month–old Esr1 (B), 18-month–old CYP19A1 (C), 20-month–old CYP19A1 (D), 20-month–old CYP19A1 with 2 months tamoxifen exposure (E), and 20-month–old Esr1 with 2 months letrozole exposure mice (F). Black arrows indicate representative cells with nuclear-localized ER staining. All images scaled identically. Scale bar = 10 μm (BF). Original magnification, ×40 (BF).
Supplemental Figure S2
Most cell proliferation genes from the Prediction Analysis of Microarray 50 (PAM50) panel that were significantly differentially expressed between mouse estrogen receptor 1 (Esr1) and human cytochrome P450 family 19 subfamily A member 1 (aromatase; CYP19A1) mice at age 20 months (m) were also significantly down-regulated with tamoxifen and letrozole in Esr1 mice. Bar graphs illustrating relative transcripts per million (TPM) in each cohort for each gene expressed at significantly different levels between Esr1 and CYP19A1 mice at age 20 months (Figure 6B). Significant differences between cohorts within each genotype are indicated. Relative TPM values shown for baculoviral IAP repeat containing 5 (Birc5; A), cyclin B1 (Ccnb1; B), cell division cycle 20 (Cdc20; C), cell division cycle 6 (Cdc6; D), centromere protein F (Cenpf; E), centrosomal protein 55 (Cep55; F), exonuclease 1 (Exo1; G), forkhead box C1 (Foxc1; H), kinesin family member 2 (Kif2ca; I), maternal embryonic leucine zipper kinase (Melk; J), marker of proliferation Ki-67 (Mki67; K), MYB proto-oncogene like 2 (Mybl2; L), MYC proto-oncogene, BHLH transcription factor (Myc; M), PTTG1 regulator of sister chromatid separation, securin (Pttg1; N), ribonucleotide reductase regulatory subunit M2 (Rrm2; O), and thymidylate synthetase (Tyms; P). Relative expression levels shown for unique individual samples. Data are given as means ± SEM (AP). n = 3 for each cohort (AP). ∗P-value adjusted (Padj) < 0.05, ∗∗Padj < 0.01, ∗∗∗Padj < 0.001, and ∗∗∗∗Padj < 0.0001 (DESeq2).
Supplemental Figure S3
Estrogen response genes from Prediction Analysis of Microarray 50 (PAM50) panel showed variable behavior with exposure to tamoxifen and letrozole in both mouse estrogen receptor 1 (Esr1) and human cytochrome P450 family 19 subfamily A member 1 (aromatase; CYP19A1) mice. Bar graphs illustrating relative transcripts per million (TPM) in each cohort for each gene expressed at significantly different levels between Esr1 and CYP19A1 mice at age 20 months (Figure 6B). Significant differences between cohorts within each genotype indicated. Relative TPM values shown for Esr1 (A), forkhead box A1 (Foxa1; B), microtubule-associated protein tau (Mapt; C), matrix metallopeptidase 11 (Mmp11; D), progesterone receptor (Pgr; E), and secreted frizzled-related protein 1 (Sfrp1; F). Relative expression levels shown for unique individual samples. Data are given as means ± SEM (AF). n = 3 for each cohort (AF). ∗P-value adjusted (Padj) < 0.05, ∗∗Padj < 0.01, and ∗∗∗∗Padj < 0.0001 (DESeq2).
Supplemental Figure S4
Relative expression levels of luminal and basal cytokeratins across cohorts. Bar graphs illustrating relative transcripts per million (TPM) in each cohort for keratin (Krt) 7 (A), Krt8 (B), Krt18 (C), Krt19 (D), Krt5 (E), and Krt14 (F). Relative expression levels shown for unique individual samples. Data are given as means ± SEM (AF). n = 3 for each cohort (AF). ∗P-value adjusted (Padj) < 0.05, ∗∗Padj < 0.01, ∗∗∗Padj < 0.001, and ∗∗∗∗Padj < 0.0001 (DESeq2). CYP19A1, human cytochrome P450 family 19 subfamily A member 1 (aromatase); Esr1, mouse estrogen receptor 1; m, months.
Supplemental Figure S5
Selected genes previously linked to estrogen receptor α (ER) genomic signaling showed significant down-regulation following exposure to an anti-hormonal. Bar graphs illustrating relative transcripts per million (TPM) in each cohort for genes associated with ER genomic signaling. Significant differences between cohorts within each genotype indicated. Relative TPM values shown for MYC proto-oncogene, BHLH transcription factor (Myc; A), cyclin D1 (Ccnd1; B), cyclin-dependent kinase 2 (Cdk2; C), bcl2-like 1 (Bcl2l1; D), cyclin E1 (Ccne1; E), cyclin-dependent kinase inhibitor 1a (Cdkn1a; F), and Bcl2 apoptosis regulator (Bcl2; G). Relative expression levels shown for unique individual samples. Data are given as means ± SEM (AG). n = 3 for each cohort (AG). ∗P-value adjusted (Padj) < 0.05, ∗∗Padj < 0.01, ∗∗∗Padj <0.001, and ∗∗∗∗Padj < 0.0001 (DESeq2). CYP19A1, human cytochrome P450 family 19 subfamily A member 1 (aromatase); Esr1, mouse estrogen receptor 1; m, months.
Supplemental Figure S6
Selected genes previously linked to estrogen receptor α (ER) nongenomic signaling were expressed in mammary tissue but not generally down-regulated following exposure to an anti-hormonal. Bar graphs illustrating relative transcripts per million (TPM) in each cohort for genes associated with ER genomic signaling. Significant differences between cohorts within each genotype indicated. Relative TPM values shown for insulin growth factor receptor 1 (Igf1r; A), matrix metallopeptidase 2 (Mmp2; B), matrix metallopeptidase 9 (Mmp9; C), epidermal growth factor receptor (Egfr; D), mitogen-activated protein kinase 1 (Mapk1; E), SHC adaptor protein 1 (Shc1; F), growth factor receptor-bound protein 2 (Grb2; G), and SOS Ras/Rac guanine nucleotide exchange factor 1 (Sos1; H). Relative expression levels shown for unique individual samples. Data are given as means ± SEM (AH). n = 3 for each cohort (AH). ∗P-value adjusted (Padj) < 0.05, ∗∗∗∗Padj < 0.0001 (DESeq2). CYP19A1, human cytochrome P450 family 19 subfamily A member 1 (aromatase); Esr1, mouse estrogen receptor 1; m, months.

Similar articles

Cited by

References

    1. Trapani D., Ginsburg O., Fadelu T., Lin N.U., Hassett M., Ilbawi A.M., Anderson B.O., Curigliano G. Global challenges and policy solutions in breast cancer control. Cancer Treat Rev. 2022;104:102339. - PubMed
    1. Thu K., Soria-Bretones I., Mak T., Cescon D. Targeting the cell cycle in breast cancer: towards the next phase. Cell Cycle. 2018;17:1871–1885. - PMC - PubMed
    1. Maharjan C.K., Mo J., Wang L., Kim M.-C., Wang S., Borcherding N., Vikas P., Zhang W. Natural and synthetic estrogens in chronic inflammation and breast cancer. Cancers (Basel) 2021;14:206. - PMC - PubMed
    1. Schuler L.A., Murdoch F.E. Endogenous and therapeutic estrogens: maestro conductors of the microenvironment of ER+ breast cancers. Cancers (Basel) 2021;13:3725. - PMC - PubMed
    1. Walker R.A., Martin C.V. The aged breast. J Pathol. 2007;211:232–240. - PubMed

Publication types