. 2023 Jun;37(3):829-837.
doi: 10.1007/s10877-022-00948-5. Epub 2022 Dec 5.

Automated electrocardiogram signal quality assessment based on Fourier analysis and template matching

Affiliations

Automated electrocardiogram signal quality assessment based on Fourier analysis and template matching

Kartikeya M Menon et al. J Clin Monit Comput. 2023 Jun.

Abstract

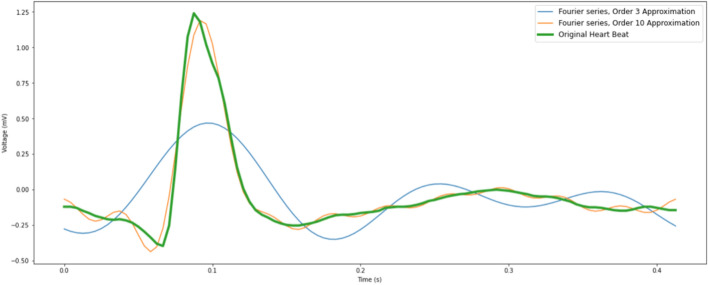
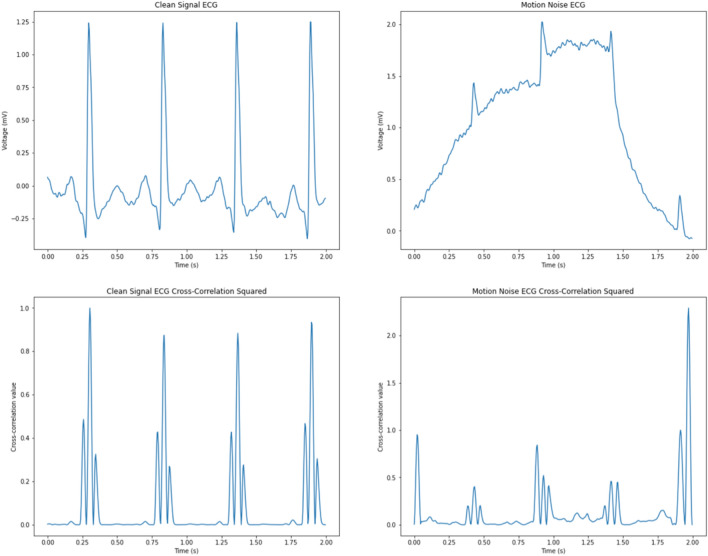
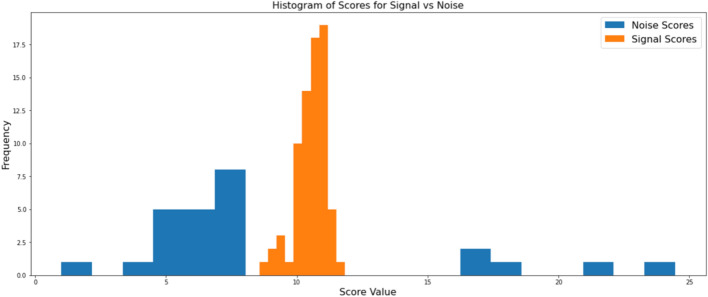
We developed and tested a novel template matching approach for signal quality assessment on electrocardiogram (ECG) data. A computational method was developed that uses a sinusoidal approximation to the QRS complex to generate a correlation value at every point of an ECG. The strength of this correlation can be numerically adapted into a 'score' for each segment of an ECG, which can be used to stratify signal quality. The algorithm was tested on lead II ECGs of intensive care unit (ICU) patients admitted to the Mount Sinai Hospital (MSH) from January to July 2020 and on records from the MIT BIH arrhythmia database. The algorithm was found to be 98.9% specific and 99% sensitive on test data from the MSH ICU patients. The routine performs in linear O(n) time and occupies O(1) heap space in runtime. This approach can be used to lower the burden of pre-processing in ECG signal analysis. Given its runtime (O(n)) and memory (O(1)) complexity, there are potential applications for signal quality stratification and arrhythmia detection in wearable devices or smartphones.

Keywords: AI; ECG; Electrocardiogram; Fourier; ML.


Conflict of interest statement

None of the authors have financial or non-financial interests related to this work.

Figures

Fig. 1
Fig. 1
Example of noisy signals (left) and high-quality signals (right). Regions of interference, demonstrated on the left, are not reparable through typical signal processing techniques, like Butterworth or Kalman filtering
Fig. 2
Fig. 2
Example of kernel. The original heartbeat (shown in green, the peak is the QRS complex) can be approximated by a Fourier series. Two approximations (N = 3—blue and N = 10—orange) are shown. The higher the N, the better the approximation to the actual heartbeat
Fig. 3
Fig. 3
Visualization of template matching. On the left, an ECG segment with baseline wander, and on the right, the template (approximation to QRS complex) is shown in green with the noisy ECG peaks overlaid in grey. There is significant variation in the morphology of these QRS complexes versus the template
Fig. 4
Fig. 4
Cross-correlation plots with the pre-computed kernel. Cross-correlation of ECG data with a pre-computed sinusoidal kernel specific to the QRS complex produces peak values at regions of consistent signal, and irregular values at regions of inconsistent signal. On the left, a clean ECG signal and the squared value of its cross-correlation with the Fourier approximation. On the right, motion artifact and baseline wander add noise to the signal. The cross-correlation peaks are visibly irregular compared with those of the clean signal
Fig. 5
Fig. 5
Score distributions. The scores si are normally distributed so the central tendency can be used to distinguish noise from signal. In the clean signal, the integral of the cross-correlation peaks gives a score of 9.8. In the noisy signal, the integral of the peaks yields a score of 15.5
Fig. 6
Fig. 6
Example histogram of scores. The high-quality signal scores cluster around the distribution mean, where the noisy signal scores lie further away
Fig. 7
Fig. 7
Runtime analysis. As expected, the algorithm performs in O(n) time under evaluation with varying data size. The size of the ECG file in megabytes is on the right axis, and the corresponding length of the ECG recording (in hours) is on the left

References

    1. Cohen-Shelly M, et al. Electrocardiogram screening for aortic valve stenosis using artificial intelligence. Eur Heart J. 2021;42(30):2885–2896. doi: 10.1093/eurheartj/ehab153. - DOI - PubMed
    1. Adedinsewo DA, et al. Detecting cardiomyopathies in pregnancy and the postpartum period with an electrocardiogram-based deep learning model. Eur Heart J Digit Health. 2021;2(4):586–596. doi: 10.1093/ehjdh/ztab078. - DOI - PMC - PubMed
    1. Akbilgic O, et al. ECG-AI: electrocardiographic artificial intelligence model for prediction of heart failure. Eur Heart J Digit Health. 2021;2(4):626–634. doi: 10.1093/ehjdh/ztab080. - DOI - PMC - PubMed
    1. D’Aloia M, Longo A, Rizzi M. Noisy ECG signal analysis for automatic peak detection. Information. 2019;10(2):35. doi: 10.3390/info10020035. - DOI
    1. Pan J, Tompkins WJ. A real-time QRS detection algorithm. IEEE Trans Biomed Eng. 1985;32(3):230–236. doi: 10.1109/TBME.1985.325532. - DOI - PubMed

Publication types

LinkOut - more resources