

Prospective validation of a dynamic prognostic model for identifying COVID-19 patients at high risk of rapid deterioration
- PMID: 36464785
- PMCID: PMC9877647
- DOI: 10.1002/pds.5580
Prospective validation of a dynamic prognostic model for identifying COVID-19 patients at high risk of rapid deterioration
Abstract
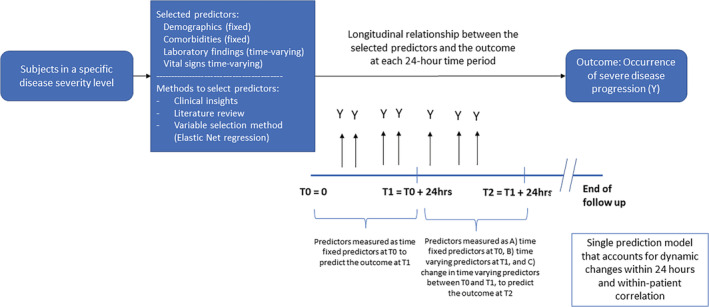
Background: We sought to develop and prospectively validate a dynamic model that incorporates changes in biomarkers to predict rapid clinical deterioration in patients hospitalized for COVID-19.
Methods: We established a retrospective cohort of hospitalized patients aged ≥18 years with laboratory-confirmed COVID-19 using electronic health records (EHR) from a large integrated care delivery network in Massachusetts including >40 facilities from March to November 2020. A total of 71 factors, including time-varying vital signs and laboratory findings during hospitalization were screened. We used elastic net regression and tree-based scan statistics for variable selection to predict rapid deterioration, defined as progression by two levels of a published severity scale in the next 24 h. The development cohort included the first 70% of patients identified chronologically in calendar time; the latter 30% served as the validation cohort. A cut-off point was estimated to alert clinicians of high risk of imminent clinical deterioration.
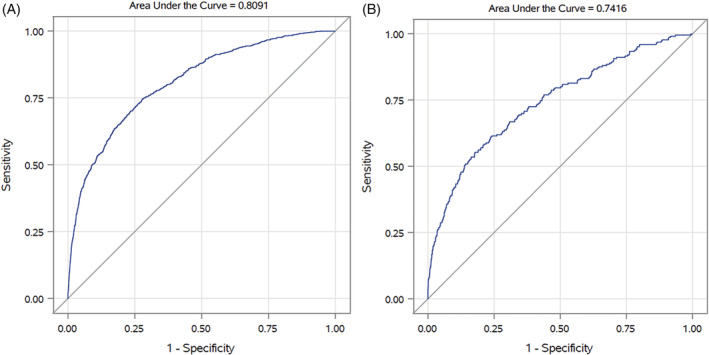
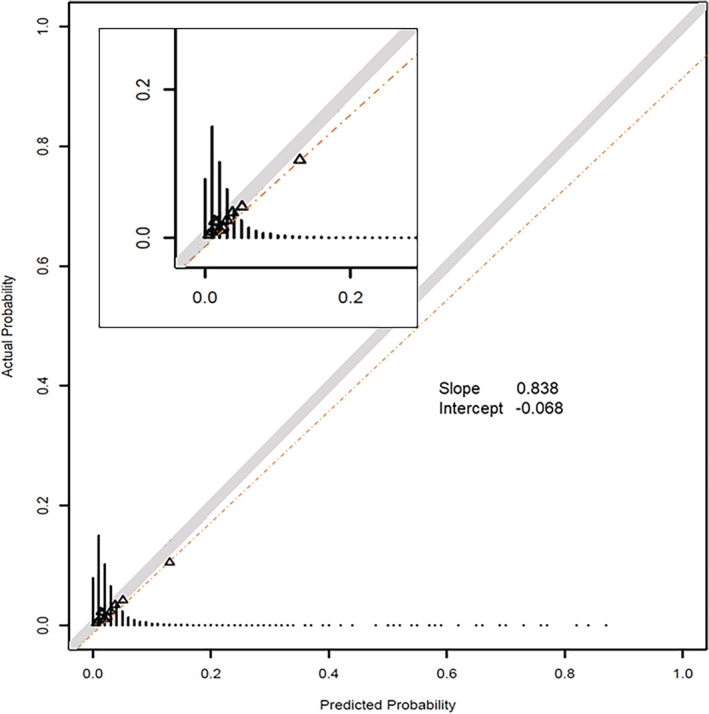
Results: Overall, 3706 patients (2587 in the development and 1119 in the validation cohort) met the eligibility criteria with a median of 6 days of follow-up. Twenty-four variables were selected in the final model, including 16 dynamic changes of laboratory results or vital signs. Area under the ROC curve was 0.81 (95% CI, 0.79-0.82) in the development set and 0.74 (95% CI, 0.71-0.78) in the validation set. The model was well calibrated (slope = 0.84 and intercept = -0.07 on the calibration plot in the validation set). The estimated cut-off point, with a positive predictive value of 83%, was 0.78.
Conclusions: Our prospectively validated dynamic prognostic model demonstrated temporal generalizability in a rapidly evolving pandemic and can be used to inform day-to-day treatment and resource allocation decisions based on dynamic changes in biophysiological factors.
Keywords: COVID-19; dynamic model; model development; model validation; prognosis; time-varying.
© 2022 John Wiley & Sons Ltd.
Conflict of interest statement
Dr. Kueiyu Joshua Lin, Elvira D'Andrea, Liu, Rishi J. Desai and Shirley V. Wang have no conflicts of interest to disclose. Joshua J. Gagne is currently employed at and owns stock in Johnson & Johnson.
Figures
Similar articles
-
A predictive model of clinical deterioration among hospitalized COVID-19 patients by harnessing hospital course trajectories.J Biomed Inform. 2021 Jun;118:103794. doi: 10.1016/j.jbi.2021.103794. Epub 2021 Apr 30. J Biomed Inform. 2021. PMID: 33933654 Free PMC article.
-
The Development and Validation of Simplified Machine Learning Algorithms to Predict Prognosis of Hospitalized Patients With COVID-19: Multicenter, Retrospective Study.J Med Internet Res. 2022 Jan 21;24(1):e31549. doi: 10.2196/31549. J Med Internet Res. 2022. PMID: 34951865 Free PMC article.
-
Development and validation of a risk prediction model for hospital admission in COVID-19 patients presenting to primary care.Eur J Gen Pract. 2024 Dec;30(1):2339488. doi: 10.1080/13814788.2024.2339488. Epub 2024 Apr 29. Eur J Gen Pract. 2024. PMID: 38682305 Free PMC article.
-
Development of Severe COVID-19 Adaptive Risk Predictor (SCARP), a Calculator to Predict Severe Disease or Death in Hospitalized Patients With COVID-19.Ann Intern Med. 2021 Jun;174(6):777-785. doi: 10.7326/M20-6754. Epub 2021 Mar 2. Ann Intern Med. 2021. PMID: 33646849 Free PMC article.
-
Development and external validation of a prediction risk model for short-term mortality among hospitalized U.S. COVID-19 patients: A proposal for the COVID-AID risk tool.PLoS One. 2020 Sep 30;15(9):e0239536. doi: 10.1371/journal.pone.0239536. eCollection 2020. PLoS One. 2020. PMID: 32997700 Free PMC article.
Cited by
-
A Dynamic Prognostic Model for Identifying Vulnerable COVID-19 Patients at High Risk of Rapid Deterioration.Pharmacoepidemiol Drug Saf. 2024 Aug;33(8):e5872. doi: 10.1002/pds.5872. Pharmacoepidemiol Drug Saf. 2024. PMID: 39135513 Free PMC article.
References
-
- Dong E, Du H, Gardner L. An interactive web‐based dashboard to track COVID‐19 in real time. Lancet Infect Dis. 2020;S1473‐3099(20)30120‐1. Accessed September 13, 2022. https://www.arcgis.com/apps/dashboards/bda7594740fd40299423467b48e9ecf6 - PMC - PubMed
-
- Wei EK, Long T, Katz MH. Nine lessons learned from the COVID‐19 pandemic for improving hospital care and health care delivery. JAMA Intern Med. 2021;181(9):1161‐1163. - PubMed
-
- World Health Organization . Essential health services face continued disruption during COVID‐19 pandemic. 2022. Accessed September 13, 2022. https://www.who.int/news/item/07-02-2022-essential-health-services-face-...
-
- Ritchie H, Mathieu E, Rodés‐Guirao L, et al. Coronavirus Pandemic (COVID‐19). 2020. Accessed September 13, 2022. https://ourworldindata.org/coronavirus
-
- Myers LC, Liu VX. The COVID‐19 pandemic strikes again and again and again. JAMA Netw Open. 2022;5(3):e221760. - PubMed
Publication types
MeSH terms
Grants and funding
LinkOut - more resources
Full Text Sources
Medical
Miscellaneous
