. 2022 Nov 7;25(12):105528.
doi: 10.1016/j.isci.2022.105528. eCollection 2022 Dec 22.

Blockage of lamin-A/C loss diminishes the pro-inflammatory macrophage response

Affiliations

Blockage of lamin-A/C loss diminishes the pro-inflammatory macrophage response

Johanna L Mehl et al. iScience. .

Abstract

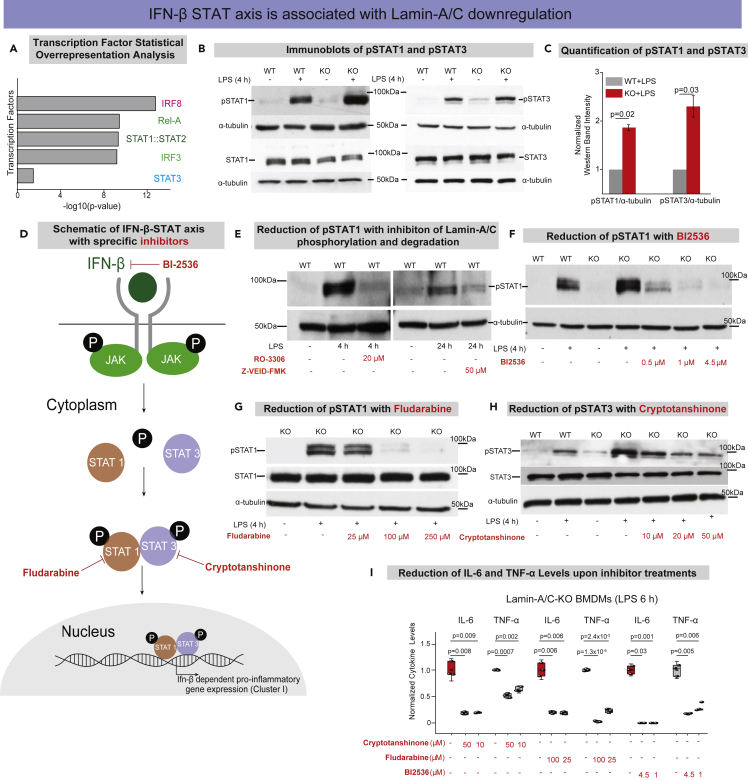
Mutations and defects in nuclear lamins can cause major pathologies, including inflammation and inflammatory diseases. Yet, the underlying molecular mechanisms are not known. We now report that the pro-inflammatory activation of macrophages, as induced by LPS or pathogenic E. coli, reduces Lamin-A/C levels thereby augmenting pro-inflammatory gene expression and cytokine secretion. We show that the activation of bone-marrow-derived macrophages (BMDMs) causes the phosphorylation and degradation of Lamin-A/C, as mediated by CDK1 and Caspase-6, respectively, necessary for upregulating IFN-β expression. Enhanced IFN-β expression subsequently increases pro-inflammatory gene expression via the IFN-β-STAT axis. Pro-inflammatory gene expression was also amplified in the complete absence of Lamin-A/C. Alternatively, pharmacological inhibition of either Lamin-A/C phosphorylation or degradation significantly downregulated pro-inflammatory gene expression, as did the targeting of IFN-β-STAT pathway members, i.e. phospho-STAT1 and phospho-STAT3. As Lamin-A/C is a previously unappreciated regulator of the pro-inflammatory macrophage response, our findings suggest novel opportunities to treat inflammatory diseases.

Keywords: Cell biology; Functional aspects of cell biology; Immune response; Immunology.


Conflict of interest statement

The authors declare that there is no conflict of interest regarding the publication of this article.

Figures

None
Graphical abstract
Figure 1
Figure 1
Pro-inflammatory macrophage activation results in a Lamin-A/C downregulation in mice and humans, independent of the organ or sex of the donors (A) Color coded map shows the mRNA expression levels of various pro-inflammatory genes and Lamin-A/C in microglia of LPS-injected mice, in LPS-treated mouse peritoneal macrophages, microglia, bone marrow-derived macrophages isolated from rodents of different species (mouse and rat29) and of different mouse strains (BALB/C and C57BL/6), as well as in LPS-treated human monocyte and alveolar macrophage. The same is seen in LPS-treated macrophage cell line J774.A1 (mouse) and THP-1 (human). Expression data were obtained from public repositories as cited. (B) Scheme of the experimental setup, BMDMs were treated with LPS for different durations of time. (C) Violin plots show the normalized levels of Lamin-A/C mRNA in Untreated (UT), and LPS-treated BMDMs as determined by qPCR. Levels were further normalized to the UT BMDM conditions to find the fold change. (D) Scheme of experimental setup to illustrate the reversibility of the process. BMDMs were treated with LPS for 24 h for pro-inflammatory activation followed by culturing in media without LPS for 24 h (Wash out) to shed light on inflammation and resolution in macrophages. (E) Time course quantification shows a reversal in the gene expression levels of pro-inflammatory gene IL-6 in UT, 24 h LPS-treated BMDMs, and after 24 h LPS Wash out. Data are presented as Mean ± S.E and normalized to the UT BMDM condition to find the fold change. (F) Box plots show reversal of secreted IL-6 cytokine levels in UT, 24 h LPS-treated BMDMs, and after 24 h LPS Wash out. Levels were normalized to the UT BMDM condition to find the fold change. (G) Time course quantification shows a reversal in the expression levels of Lamin-A/C in UT, 24 h LPS-treated BMDMs and after 24 h LPS Wash out. Data are presented as Mean ± S.E and normalized to the UT BMDM condition to find the fold change. (H) Representative orthogonal views of nucleus in UT and LPS-treated (24 h) BMDM nuclei stained with Lamin-A/C (green) antibody. Scale Bar = 5 μm. (I) Line-intensity profiles (corresponding to white lines in H) of Lamin-A/C in UT, and 24 h LPS-treated BMDMs. (J) Box plots show normalized protein levels of Lamin-A/C in UT, and LPS-treated (24 h) BMDMs determined using antibodies binding to different epitopes of the Lamin-A/C protein, as shown in the cartoon. Levels were quantified by immunofluorescence and normalized to the UT BMDM condition. All the plots p-values were obtained with the two-sided Student’s t-test. In all the box plots, the boxes show 25th and 75th percentiles, the middle horizontal lines show the median, small open squares show the mean, and whiskers indicate S.D. All the experiments were independently repeated three or more times.
Figure 2
Figure 2
Pro-inflammatory macrophage activation induces Lamin-A/C phosphorylation and degradation (A) Immunoblot shows total levels of Lamin-A and Lamin-C in Untreated (UT), and LPS-treated BMDMs. α-tubulin served as a loading control. (B) Time course quantifications of Lamin-A and Lamin-C normalized with α-tubulin over three independent immunoblotting experiments. Calculated values were further normalized to the UT BMDM condition to find the fold change. Data are presented as Mean ± S.E. (C) Longer exposure of immunoblots against Lamin-A/C in UT, and LPS-treated BMDMs to detect lower fragmented Lamin-A/C bands (50kDa and 40kDa). α-tubulin served as a loading control. (D) Box plots show degraded Lamin-A/C fragments (50kDa and 40kDa) normalized to α-tubulin between UT and LPS-treated BMDMs. Calculated values were further normalized to the UT BMDM condition to find the fold change. (E) Immunoblots against Lamin-A/C in UT, LPS-treated, LPS Wash-out BMDMs to detect fragmented Lamin-A/C bands (∼50kDa and ∼40kDa). α-tubulin served as a loading control. (F) Immunoblot shows total levels of p-(Ser22)-Lamin-A and p-(Ser22)-Lamin-C along with a phosphorylated fragmented band of Lamin-A/C (∼28kDa) in UT, and LPS-treated BMDMs. α-tubulin served as a loading control. (G) Time course quantification of total p-(Ser22)-Lamin-A+C normalized to the total Lamin-A/C over three independent immunoblotting experiments. Calculated values were further normalized to the UT BMDM condition to find the fold change. (H) (Top) Schematic shows the direct or indirect CDK1-mediated Lamin-A/C phosphorylation, which is known from other cells to be blocked by PP2A during the cell cycle. Also shown are the drugs used in this study to selectively inhibit the activity of the respective enzymes. (Bottom) Schematic shows Caspase-6 mediated Lamin-A/C degradation as inhibited by Z-VEID-FMK. (I) Box plots show the lowering of pro-inflammatory gene expression (qPCR) (Left) and secreted cytokine levels (ELISA) (Right) in LPS-treated BMDMs, also treated with RO-3306 or Z-VEID-FMK to inhibit Lamin-A/C phosphorylation and degradation, respectively. Levels were normalized to the 6 h LPS-treated BMDM condition to find the fold change. (J) Box plots show an increase in the pro-inflammatory gene expression (qPCR) (Left) and secreted cytokine levels (ELISA) (Right) in LPS-treated BMDMs, also treated with LB-100, a PP2A inhibitor, as compared to BMDMs treated with only LPS for 24 h. Levels were normalized to the 24 h LPS-treated BMDM condition to find the fold change. For all the plots p-values were obtained with the two-sided Student’s t-test. In all the box plots, the boxes show 25th and 75th percentiles, the middle horizontal lines show the median, small open squares show the mean, and whiskers indicate S.D. All the experiments were independently repeated three or more times.
Figure 3
Figure 3
Lamin-A/C knockout augments pro-inflammatory genomic programs (A) Scheme shows the experimental RNA-Sequencing and ELISA setup between wild-type (WT) and Lamin-A/C knockout (KO) BMDMs. (B) Heatmap shows the top 25 upregulated and downregulated genes between WT- and KO- BMDMs (Fold change>2 and p-value<0.05). (C) Heatmap shows the top 25 upregulated and downregulated genes between LPS-treated (6 h) WT- and KO-BMDMs (Fold change>2 and p-value<0.05). (D) Heat map shows the levels of selected pro-inflammatory genes upregulated in LPS-treated KO-BMDMs as compared to LPS-treated WT-BMDMs. (E) Box plots show the differences in secreted cytokine levels of TNF-α and IL-6 between WT vs. WT + LPS, and WT + LPS vs. KO + LPS-treated BMDMs. Levels were normalized to the untreated WT-BMDM condition to find the fold change. (F) Venn-diagram shows the number of overlapped genes (Fold change>2 and p < 0.05) between LPS induced genes in WT-BMDMs and genes which get further induced (241) or repressed (160) in LPS-treated KO-BMDMs. (G) Tables show Gene Ontology analysis of different gene clusters. (H) Venn-diagram shows the number of overlapped genes (Fold change>2 and p < 0.05) between LPS repressed genes in WT-BMDMs and genes which further get repressed (140) or induced (153) in LPS-treated KO-BMDMs. (I) Venn-diagram shows the overlapped genes (Fold change>2 and p < 0.05) between LPS-induced and Lamin-A/C dependent (Cluster-I) and Interferon-β (IFN-β) dependent genes. (J) Scheme shows the experimental setup of RNA-Sequencing and data analysis to used to identify how Lamin-A/C reduction influenced pro-inflammatory transcription factors. For all the plots, p values were obtained with the two-sided Student’s t-test. In all the box plots, the boxes show 25th and 75th percentiles, the middle horizontal lines show the median, small open squares show the mean, and whiskers indicate S.D. Triplicate samples were used for RNA-Sequencing. All the other experiments were independently repeated two or more times.
Figure 4
Figure 4
Degradation or knockout of Lamin-A/C augments the IFN-β-STAT axis during pro-inflammatory activation (A) Bar graphs show transcription factors with corresponding -log10(p-value) found by statistical overrepresentation analysis to detect enriched transcription factor binding sites in the promoter of the 168 genes (LPS induced, and Lamin-A/C influenced Interferon-Beta dependent Genes). (B) Immunoblots show p-(Tyr701)-STAT1 (upper) and total-STAT1 (lower) (Left), and p-(Tyr705)-STAT3 (upper), and total-STAT3 (lower) (Right) levels in wild-type (WT), WT + LPS, Lamin-A/C knockout (KO), and KO + LPS-treated BMDMs. (C) Bar graphs show the quantification of pSTAT1 and pSTAT3 levels normalized with α-tubulin. Calculated values were further normalized to the WT + LPS-treated BMDM condition over three independent experiments. Data are presented as Mean ± S.E. (D) Scheme shows the IFN-β-STAT axis and how the selective inhibitors used in this study inhibit the phosphorylation of different STATs and thus inhibit pro-inflammatory gene expression. (E) Immunoblots show pSTAT1 levels in WT, WT + LPS-treated BMDMs with RO-3306 and Z-VEID-FMK. (F) Immunoblot shows pSTAT1 levels in WT, WT + LPS, KO, KO + LPS and KO + LPS-treated BMDMs with different concentrations of BI-2536. (G) Immunoblot shows pSTAT1 and total STAT1 levels in KO, KO + LPS and KO + LPS-treated BMDMs with different concentrations of Fludarabine. (H) Immunoblot shows pSTAT3 and total STAT3 levels in WT, WT + LPS, KO, KO + LPS, and KO + LPS-treated BMDMs with different concentrations of Cryptotanshinone. (I) Box plots show the lowering of secreted cytokine levels (IL-6 and TNF-α) in LPS-treated KO-BMDMs, treated with multiple concentration of Cryptotanshinone, Fludarabine, and BI-2536, as compared to only LPS-treated KO-BMDMs. Levels were normalized to the 6 h LPS-treated BMDM condition to find the fold change. In all the Immunoblots, α-tubulin served as loading control. In all the box plots, boxes show 25th and 75th percentiles, the middle horizontal lines show the median, small open squares show the mean, and whiskers indicate S.D. For all the plots p-values were obtained with the two-sided Student’s t-test. All experiments were independently repeated three or more times.
Figure 5
Figure 5
Inhibiting Lamin-A/C phosphorylation downregulates the inflammatory response of E. coli infected macrophages (A) Scheme shows the experimental setup: wild-type BMDMs were infected with either heat inactivated (HI) or active (Act) E. coli. (B) Box plot shows mRNA levels of Lamin-A/C in uninfected (UI) or E. coli infected BMDMs (HI or Act) as determined by qPCR. Levels were normalized to UI BMDMs condition to find the fold change. (C) Immunoblot shows Lamin-A/C degradation in E. coli infected BMDMs (HI or Act) as compared to UI BMDMs. α-tubulin served as a loading control. (D) Scheme shows the experimental setup: wild-type BMDMs were infected with E. coli (HI or Act) and treated with RO-3306. (E) Box plots show normalized mRNA levels of IL-6 and TNF-α in UI and E. coli infected BMDMs (HI or Act) also treated with RO-3306. Values were further normalized to the UI BMDM condition to find the fold change. (F) Box plots show normalized secreted IL-6 and TNF-α cytokine levels in UI and E. coli infected BMDMs (HI or Act) also treated with RO-3306. Values were normalized to the UI BMDM condition to find the fold change. (G) Immunoblots show pSTAT1 and pSTAT3 in BMDMs infected with E. coli (HI or Act) and treated with RO-3306 as compared to only E. coli infected BMDMs (HI or Act). α-tubulin served as loading control. (H) Schematic overview shows how pro-inflammatory activation by LPS or infection with E. coli of primary bone-marrow derived macrophages results in the phosphorylation and degradation of Lamin-A/C and its regulatory role in the pro-inflammatory gene expression and cytokine secretion via the IFN-β-STAT axis. In all the box plots, boxes show 25th and 75th percentiles, the middle horizontal lines show the median, small open squares show the mean, and whiskers indicate S.D. p values were obtained with the two-sided Student’s t-test. All experiments were independently repeated three or more times.

Similar articles

Cited by

References

    1. Osmanagic-Myers S., Dechat T., Foisner R. Lamins at the crossroads of mechanosignaling. Genes Dev. 2015;29:225–237. doi: 10.1101/gad.255968.114. - DOI - PMC - PubMed
    1. Lammerding J. Mechanics of the nucleus. Compr. Physiol. 2011;1:783–807. doi: 10.1002/cphy.c100038. - DOI - PMC - PubMed
    1. de Leeuw R., Gruenbaum Y., Medalia O. Nuclear lamins: thin filaments with major functions. Trends Cell Biol. 2018;28:34–45. doi: 10.1016/j.tcb.2017.08.004. - DOI - PubMed
    1. Ho C.Y., Lammerding J. Lamins at a glance. J. Cell Sci. 2012;125:2087–2093. doi: 10.1242/JCS.087288. - DOI - PMC - PubMed
    1. Andrés V., González J.M. Role of A-type lamins in signaling, transcription, and chromatin organization. J. Cell Biol. 2009;187:945–957. doi: 10.1083/JCB.200904124. - DOI - PMC - PubMed