A spatiotemporal steroidogenic regulatory network in human fetal adrenal glands and gonads
- PMID: 36465633
- PMCID: PMC9713933
- DOI: 10.3389/fendo.2022.1036517
A spatiotemporal steroidogenic regulatory network in human fetal adrenal glands and gonads
Abstract
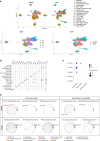
Human fetal adrenal glands produce substantial amounts of dehydroepiandrosterone (DHEA), which is one of the most important precursors of sex hormones. However, the underlying biological mechanism remains largely unknown. Herein, we sequenced human fetal adrenal glands and gonads from 7 to 14 gestational weeks (GW) via 10× Genomics single-cell transcriptome techniques, reconstructed their location information by spatial transcriptomics. Relative to gonads, adrenal glands begin to synthesize steroids early. The coordination among steroidogenic cells and multiple non-steroidogenic cells promotes adrenal cortex construction and steroid synthesis. Notably, during the window of sexual differentiation (8-12 GW), key enzyme gene expression shifts to accelerate DHEA synthesis in males and cortisol synthesis in females. Our research highlights the robustness of the action of fetal adrenal glands on gonads to modify the process of sexual differentiation.
Keywords: Sc-RNA sequencing; adrenal glands; sexual differentiation; spatial transcriptomics; steroidogenic regulation network.
Copyright © 2022 Wang, Guo, Guo, Qi, Lv, Ye, Huang, Long, Chen, Su, Zhang, Zhang, Li, Liao, Yan, Mao, Zeng, Jiang, Chen, Guo, Gao, Cheng, Jiang and Mo.
Conflict of interest statement
The authors declare that the research was conducted in the absence of any commercial or financial relationships that could be construed as a potential conflict of interest.
Figures


Similar articles
-
Equine fetal adrenal, gonadal and placental steroidogenesis.Reproduction. 2017 Oct;154(4):445-454. doi: 10.1530/REP-17-0239. Reproduction. 2017. PMID: 28878092
-
DHEA and estradiol levels in brain, gonads, adrenal glands, and plasma of developing male and female European starlings.J Comp Physiol A Neuroethol Sens Neural Behav Physiol. 2011 Oct;197(10):949-58. doi: 10.1007/s00359-011-0655-4. Epub 2011 Jun 21. J Comp Physiol A Neuroethol Sens Neural Behav Physiol. 2011. PMID: 21691747
-
Dependence of fetal hairs and sebaceous glands on fetal adrenal cortex and possible control from adrenal medulla.Med Hypotheses. 2004;62(4):486-92. doi: 10.1016/j.mehy.2004.01.001. Med Hypotheses. 2004. PMID: 15050094
-
Dehydroepiandrosterone and dehydroepiandrosterone sulfate production in the human adrenal during development and aging.Steroids. 1999 Sep;64(9):640-7. doi: 10.1016/s0039-128x(99)00046-x. Steroids. 1999. PMID: 10503722 Review.
-
Mutation of HSD3B2 Gene and Fate of Dehydroepiandrosterone.Vitam Horm. 2018;108:75-123. doi: 10.1016/bs.vh.2018.05.002. Epub 2018 Jun 30. Vitam Horm. 2018. PMID: 30029738 Review.
Cited by
-
Application of single-cell RNA sequencing on human testicular samples: a comprehensive review.Int J Biol Sci. 2023 Apr 9;19(7):2167-2197. doi: 10.7150/ijbs.82191. eCollection 2023. Int J Biol Sci. 2023. PMID: 37151874 Free PMC article. Review.
-
Biomimetic Gland Models with Engineered Stratagems.Research (Wash D C). 2023 Sep 15;6:0232. doi: 10.34133/research.0232. eCollection 2023. Research (Wash D C). 2023. PMID: 37719047 Free PMC article. Review.
-
Human-like adrenal features in Chinese tree shrews revealed by multi-omics analysis of adrenal cell populations and steroid synthesis.Zool Res. 2024 May 18;45(3):617-632. doi: 10.24272/j.issn.2095-8137.2023.280. Zool Res. 2024. PMID: 38766745 Free PMC article.
-
An integrated single-cell analysis of human adrenal cortex development.JCI Insight. 2023 Jul 24;8(14):e168177. doi: 10.1172/jci.insight.168177. JCI Insight. 2023. PMID: 37440461 Free PMC article.
References
Publication types
MeSH terms
Substances
LinkOut - more resources
Full Text Sources

