. 2022 Nov 16:9:1013660.
doi: 10.3389/fmed.2022.1013660. eCollection 2022.

Follicular dendritic cell differentiation is associated with distinct synovial pathotype signatures in rheumatoid arthritis

Affiliations

Follicular dendritic cell differentiation is associated with distinct synovial pathotype signatures in rheumatoid arthritis

Mohey Eldin M El Shikh et al. Front Med (Lausanne). .

Abstract

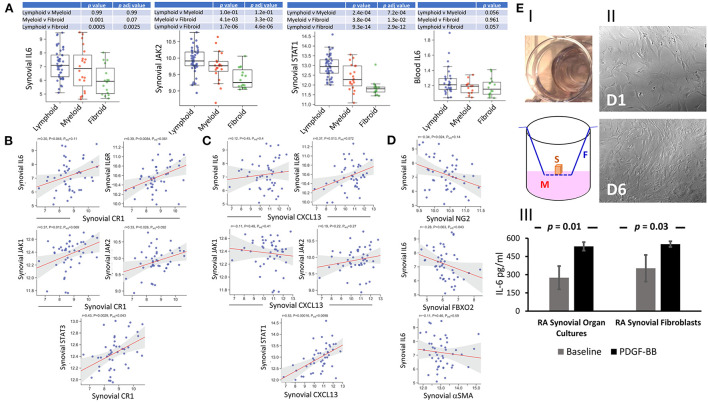
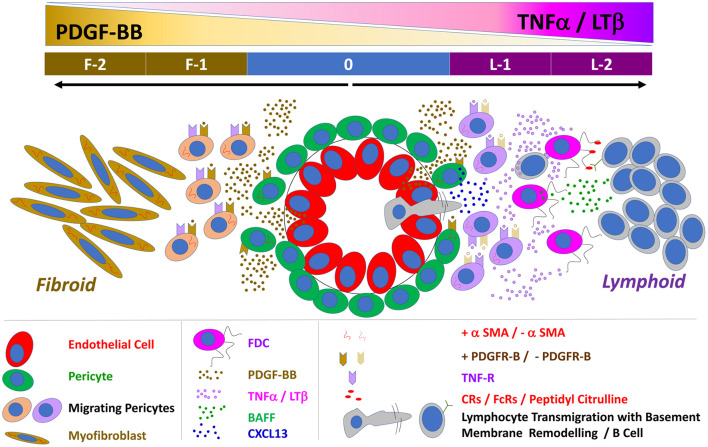
Follicular dendritic cells (FDCs) fundamentally contribute to the formation of synovial ectopic lymphoid-like structures in rheumatoid arthritis (RA) which is associated with poor clinical prognosis. Despite this critical role, regulation of FDC development in the RA synovium and its correlation with synovial pathotype differentiation remained largely unknown. Here, we demonstrate that CNA.42+ FDCs distinctively express the pericyte/fibroblast-associated markers PDGFR-β, NG2, and Thy-1 in the synovial perivascular space but not in established follicles. In addition, synovial RNA-Seq analysis revealed that expression of the perivascular FDC markers was strongly correlated with PDGF-BB and fibroid synovitis, whereas TNF-α/LT-β was significantly associated with lymphoid synovitis and expression of CR1, CR2, and FcγRIIB characteristic of mature FDCs in lymphoid follicles. Moreover, PDGF-BB induced CNA.42+ FDC differentiation and CXCL13 secretion from NG2+ synovial pericytes, and together with TNF-α/LT-β conversely regulated early and late FDC differentiation genes in unsorted RA synovial fibroblasts (RASF) and this was confirmed in flow sorted stromal cell subsets. Furthermore, RASF TNF-αR expression was upregulated by TNF-α/LT-β and PDGF-BB; and TNF-α/LT-β-activated RASF retained ICs and induced B cell activation in in vitro germinal center reactions typical of FDCs. Additionally, FDCs trapped peptidyl citrulline, and strongly correlated with IL-6 expression, and plasma cell, B cell, and T cell infiltration of the RA synovium. Moreover, synovial FDCs were significantly associated with RA disease activity and radiographic features of tissue damage. To the best of our knowledge, this is the first report describing the reciprocal interaction between PDGF-BB and TNF-α/LT-β in synovial FDC development and evolution of RA histological pathotypes. Selective targeting of this interplay could inhibit FDC differentiation and potentially ameliorate RA in clinically severe and drug-resistant patients.

Keywords: ectopic lymphoid-like structures (ELSs); follicular dendritic cells (FDCs); germinal center (GC); pericyte and perivascular; platelet-derived growth factor (PDGF); rheumatoid arthritis; synovial pathotypes; tumor necrosis factor-α (TNF-α).


Conflict of interest statement

The authors declare that the research was conducted in the absence of any commercial or financial relationships that could be construed as a potential conflict of interest.

Figures

Figure 1
Figure 1
Immunohistochemical localization of human synovial and tonsillar FDCs in the perivascular space vs. established follicles. (A) CNA.42 distribution in the tonsil (A-I) and RA synovium (A-II). Labeling of human FDCs with the mAb CNA.42 (red) colocalizes with an Ab specific for the FDC-restricted CD21 long isoform (CD21L, green) in FDC reticula. The white bracket borders extra-reticular FDCs that are CNA.42+/CD21L. (B) RA synovial CNA.42+ cells (red) are: (B-I) associated with CD20+ B cells (green) and do not colocalize with CD45 (blue). The inset in the lower left corner shows the synovial intima with CNA.42+ fibroblasts (red/white arrow) arranged side by side with CD45+ intimal macrophages (green) in the lining layer. (B-II) directly related to the CD31+ BVs (blue) within CD20+ B cell follicles (green), and (B-III) directly located in juxtaposition with the CD31+ (blue)/PNAd+ (red) HEVs (white rectangle). The white circle borders established CNA.42+ FDC reticulum (green) detached/distant from the vascular walls. (C) Early FDC markers in the RA synovial perivascular space: (C-I) Synovial labeling with the FDC marker CNA.42 together with the pericyte markers NG2, αSMA, and PDGFR-β shows that CNA.42 is expressed by cells immediately adjacent to the pericyte layer of the BVs (white arrows). (C-II) The CNA.42+/PDGFR-β+ early FDCs also express the fibroblasts marker Thy-1 (white rectangle) which is similarly expressed on the BV-associated type-1 pericytes (dashed while circle) but not on the dissociated type-2 pericytes (complete white circle) (C-III). (C-IV) Pericyte-derived differentiating FDCs progressively acquire CNA.42 and CD21/CR2 expression. NG2+ pericytes (green) are marked by a star (*); and differentiating NG2+ (green)/CNA.42+ (blue) and CNA.42+ (blue)/CD21+ (red) FDCs are indicated by dashed and complete white boxes, respectively. (D) Co-labeling of the FDC marker CNA.42 and the fibroblast marker Thy-1 in established follicles (mature FDCs) of RA synovial ELS (D-I) and tonsils (D-II). The fibroblast marker is significantly lost in mature FDCs populating established CD20+ B cell follicles. (D-III) Co-localization of CNA.42 (Blue), Thy-1 (green), and PDGFR-β (red) in the follicular (F) and inter-follicular areas. The dotted oval demarcates the loss of PDGFR-β and Thy-1 expression at the follicular border. Single channel, dual and triple overlays are shown in the different panels. Scale bare = 100 um.
Figure 2
Figure 2
RNA-Seq analysis of the PEAC cohort illustrates the differential correlation of the FDC genes associated with early perivascular and late mature developmental stages in the RA synovium. Strong positive correlations of the pericyte/fibroblast markers NG2, THY1 and αSMA with the PDGFR-β/PDGF-BB axis (A-I), NG2 and FDC-CNA.42/FBXO2 (A-II), and NG2, THY1 and αSMA (A-III) in RA. (B) Correlations of PDGF-BB and TNFα/LTβ with the expression of each other's receptors and early FDC developmental genes. PDGF-BB positively correlates with its receptor and the TNFα/LTβ receptors (B-I), TNFα and LTβ negatively correlate with PDGFR-β expression and the early FDC markers NG2 and αSMA (B-II). (C) Converse correlations of the PDGF-BB/PDGFR-β and the TNF-α/LT-β axes with the expression of mature FDC markers. PDGF-BB/PDGFR-β and TNF-α/LT-β differently correlate with the mature FDC related genes CXCL13 (B cell chemoattractant), BAFF (B cell survival factor), and antigen display and presentation to B cells namely complement receptors (CR1/CD35, CR2/CD21), and Fcg receptors (FcγRIIA/CD32A, FcγRIIB/CD32A). (D) Correlation of the RA synovial pathotypes with the expression of PDGF-BB, PDGFR-β, TNF-α, and LT-β. Person correlation coefficient (r) and adjusted p-values are shown with the corresponding plots and tables.
Figure 3
Figure 3
Regulation of synovial stromal cell gene expression by PDGF-BB and TNFα/LTβ. RA synovial stromal cells expressing Thy-1 on the cell membrane and displaying intracellular αSMA labeling (A) were treated with 300 ng/ml PDGF-BB or 100 ng/ml TNF-α + 100 ng/ml LT-αβ and the fold change in gene expression compared to untreated cells was calculated by Livak's DD equation. (B–I) Show the fold change in PDGFR-β, CSGP4 (NG2), ACTA2 (αSMA), TNFRSF1A (TNF-R), THY1, CR1 (CD35), CR2 (CD21L), FcγRIIB (CD32), and TNF-αR, respectively. Error bars represent the SEM of three different cell cultures.
Figure 4
Figure 4
Activation of sorted tonsillar stromal cell subsets with PDGF-BB and TNF-α/LT-β induces early and mature FDC markers in vitro. (A) The CD45 tonsillar stromal subsets were sorted using combinations of NG2/αSMA, NG2/CNA.42, CNA.42/αSMA and CNA.42/CR2 Abs. (B) Type-1 Pericytes [NG2+/αSMA+; indicated by red * in (A,B)], early FDCs; (CNA.42+/NG2+, CNA.42+/αSMA+, CNA.42+/CR2; indicated in A and B by blue, magenta, and green *, respectively) and mature FDCs [CNA.42+/CR2+, indicated by brown * in (A,B)] were treated with 300 ng/ml PDGF-BB or 100 ng/ml TNF-α+ 100 ng/ml LT-αβ and the fold change in FBXO2 (CNA.42), αSMA, Collagen 1, CR2, and FcγRIIB gene expression compared to untreated cells was calculated by Livak's DD equation and shown in bar graphs. (C) Treatment of the NG2+/αSMA+ type-1 pericyte subset with PDGF-BB in slide cultures for 6 days induced the expression of the FDC marker CNA.42 compared to untreated cells as demonstrated by Immunocytochemistry. Image J quantification of the mean fluorescence intensity (MFI) of CNA-42 of the different conditions is shown in the histogram. Data is representative of three different experiments and is expressed as the mean ± SEM.
Figure 5
Figure 5
PDGF-BB-induces pericyte-CXCL13 secretion and RASF migration; and TNF-α/LT-β-activated RASF trap ICs and induce B cell activation. (A) RNA-Seq analysis of the PEAC cohort demonstrating the correlation of synovial and blood TNF-α, LT-β, and CXCL13 in the different RA synovial pathotypes (A-I), and the correlation of synovial CXCL13 with serum TNF-α and LT-β in the synovial pathotypes in general and the lymphoid pathotype in specific (A-II). (B-I) Immunohistochemical colocalization of CXCL13 (green) with NG2+ pericytes (red) [nuclei are stained blue] in the RA synovium and tonsils. Single, dual, and triple overlays are presented, and the areas surrounded by white circles are shown at higher magnification in the lower panel. (B-II) NG2+ pericytes were treated with 300 ng/ml PDGF-BB and the fold change in CXCL13 gene expression compared to untreated cells was calculated by Livak's DD equation and shown in bar graph. (C) Stromal/endothelial dissociation at the sites of B cell influx into the rheumatoid synovium. (C-I) The effect of PDGF-BB and TNF-α/LT-β on the trans well migration of RASF. Image J was used to process, segment, and automatically count the number of migrating RASF in 100× magnified fields after treatment with PDGF-BB with and without TNF-α/LT-β. The averages were calculated and displayed ± the SEM. (C-II) Transmission electron micrograph of the RA synovial HEVs showing concentric zones of the vascular lumen (dashed red circle), high cuboidal vascular lining (zone between the red and magenta dashed circles), multi-layered basement membrane (zone between the magenta and yellow dashed circles, red arrows), and zone showing mural cell displacement (between the yellow and green dashed circles). Plasma cell (PC) with cartwheel nucleus is seen adjacent to the HEV. (C-III) Immunohistochemical analysis showing the proportion of perivascular CNA.42 immature FDCs (red) to vascular CD31 (blue) at sites associated with (a) or devoid from (b) CD20+ B cells (green). The CD31+ endothelium in (a) is relatively of high phenotype [white arrows], and the white rectangle shows B cells insinuated between the endothelium and the CNA.42+ perivascular early FDCs. (C-IV) Image J quantification of the CNA.42 to CD31 ratio at the sites of B cell influx and no influx. (D) Induction of Ig secretion in in vitro GCRs supported by IC-loaded TNF-α/LT-β-stimulated RASF. (D-I) Transmission electron micrograph of HRP-loaded TNF-α/LT-β-stimulated RASF. The ultra-thin sections were left unstained to maximize visibility of the HRP-DAB deposition on the membranes. (a) A cluster of RA synovial fibroblasts showing surface deposition of the HRB substrate DAB (black, yellow arrows). (b) The periodic deposition of DAB (white bracket) is interrupted at certain sites (white arrows) due to internalization of the HRP antigen, and the distance between the antigen clusters range between 200 and 600Å. (D-II) Setup of BCR-mediated polyclonal B cell activation using anti-IgM BCR cross-linker. The anti IgM ICs formed of rabbit anti IgM Abs (green) + anti human IgM Abs (red) are loaded on the activated RA synovial fibroblasts to cross-link the IgM BCR (blue). Relatively, soluble anti human IgM Abs (red) do not effectively cross link the BCRs as they lack periodicity. (D-III) ELISA measurement of secreted human IgM in the culture supernatants at day 6. Data expressed as the mean ± SEM. Significance was calculated using 2-tailed unpaired student T-test and the p-value between soluble IgM and IgM ICs is shown.
Figure 6
Figure 6
Retention of peptidyl citrulline on synovial FDCs and correlation of the FDC gene module with synovial pathotypes and cellular infiltrates. (A) Colocalization of peptidyl citrulline with FDCs in the synovial tissues (A-I), and tonsillar control (A-II). (A-III,IV) peptidyl citrulline trapping on CD21+ synovial FDCs but not CD21/αSMA+ myofibroblasts (A-III), and colocalization of PAD4 with CD21+ synovial FDCs and peptidyl citrulline [(A-IV), insets: Upper intracellular PAD4, Lower, extracellular PAD4]. Scale bars, overlays and single channels are shown with the relevant panels. (B) Correlation of the FDC module genes with synovial pathotypes and cellular infiltrates. (B-I) Heatmap showing hierarchical clustering of the synovial FDC module gene expression (variance stabilizing transformed counts) against different synovial pathotypes. Upper tracks show histological scores for CD3, CD20, CD68L (lining), CD68SL (sublining), and CD138 and overall pathotype. Tracks on the left-hand side indicate the relationships between the FDC genes expression across all the pathotypes. (B-II) Correlation of the synovial FDC gene module with synovial plasma cells (CD138), B cells (CD20), and T cells (CD3). r = Spearman rho correlation coefficient, p = significance value.
Figure 7
Figure 7
Correlation of synovial FDCs with the RA clinical parameters: (A-I) Correlation plot of the individual FDC genes against baseline CCP (anti-cyclic citrullinated peptide antibody titer) and RF (rheumatoid factor titer). (A-II) Boxplots demonstrating the correlation of RF and CCP titers with the overall synovial FDC genes module. (B-I) Correlation plot of the individual FDC genes against DAS28-ESR (28-joint Disease Activity Score for rheumatoid arthritis with Erythrocyte Sedimentation Rate); DAS28-CRP (C Reactive Protein), and Sharp van der Heijde score (SHSS). (B-II) Correlation of DAS28-ESR; DAS28-CRP, and SHSS with the overall synovial FDC genes module. p-values were calculated using Spearman rank test, *P < 0.05, **P < 0.01, ***P < 0.001. r = Spearman rho correlation coefficient, p = significance value.
Figure 8
Figure 8
Correlation of IL-6 expression with synovial pathotypes and FDC markers. (A) Boxplots displaying the correlation of synovial IL-6, JAK2, STAT1, and blood IL-6 expression with synovial pathotypes. (B,C) Correlation blots of synovial IL-6, IL-6R, JAK1, and JAK2 expression with the FDC markers complement receptor 1 (CR1/CD35) and CXCL13, respectively. Correlation of STAT3 and STAT1 with CR1 and CXCL13 respectively are also shown. (D) Correlation of synovial IL-6 expression with the markers associated with early FDC differentiation including NG2 (pericytes), αSMA (myofibroblasts), and FBXO2 (CNA.42). (E) IL-6 release from synovial organ and fibroblast cultures stimulated with 300 ng/ml PDGF-BB for 24 hrs and 6 days respectively. (E-I) Synovial organ culture showing a piece of synovial tissue placed in cell culture inserts mounted in 24-well plates (Upper). Diagrammatic representation of the synovial organ culture setup (S = Synovial Tissue, M = Culture Medium, F = Filter Device). (E-II) Rheumatoid arthritis synovial fibroblasts (RASFs) at base line (Day 1 = D1) and after 6-day (D6) stimulation with PDGF-BB. IL-6 levels at baseline and after stimulation are shown in (E-III). Cultures were run in triplicates and data is expressed as the mean ± SEM. Significance was calculated using 2-tailed unpaired student T test and the p-value between baseline and PDGF-BB stimulation is shown.
Figure 9
Figure 9
The FDC mAb CNA.42 recognizes FBXO2. (A) Immunoprecipitation (IP) and characterization of the CNA-42 binding protein. (A-I) Western blotting of total cell lysate (a), negative control (agarose beads only) and the CNA.42-immunoprecipitated proteins (c and d, 1.5 and 6 uls/lane respectively) from tonsillar single cell suspension probed with CNA-42. A single band is detectable at 120 Kd. (A-II) the reactivity of the CNA.42 mAb on the HuProt™ human proteome microarray showing subarray 9-1 of array 1300017931 (used for the CNA.42) with fluorescence detection at 633 nm excitation (a) and 543 nm excitation (b). (a) Staining with biotinylated anti-GST and Streptavidin-647. Rows 1-28 show generic staining of the GST-tagged immobilized human proteins, among them FBXO2 in row 11. (b) Probing with CNA.42 and Cy3 labeled anti-mouse IgM shows one hit, the human protein FBXO2 in the subarray. (A-III) Western blotting of tonsillar lysates with FBXO2 and CNA-42-specific antibodies recognize 120 Kd bands in the lysates [CNA.42 BP = CNA.42 binding protein]. (B) In situ hybridization of FBXO2 mRNA (green) showing intracellular signal in tonsillar CD21+ FDC reticula (red). (C) Western blotting of lysates from the CAN.42 expressing CEM cell line using mAb CAN.42 and anti FBXO2. CEM were untreated or treated either with Accell human FBXO2 siRNA (1 uM), or non-targeting control (NTC). GAPDH is used as a loading control. Compared to untreated cells, densitometric analysis with Image J indicates that FBXO2 siRNA-treated cells expressed 50% (*) and 35% (**) less FBXO2 and CNA.42, respectively.
Figure 10
Figure 10
Schematic representation of the proposed interaction between PDGF-BB and TNF-α/LT-β in FDC development and induction of lymphoid vs. fibroid RA pathotypes: 0 = Neo-angiogenesis in the inflamed synovium is regulated by the reciprocal activation of the endothelial cells and their covering pericytes. PDGF-BB is mainly produced by endothelial cells and activates the PDGFR-β + pericytes whereas pericytes are the main source of VEGF that stimulates endothelial growth and sprouting. PDGF-BB induces αSMA expression, pericyte migration, TNF-R expression, and the FDC marker CNA.42 on the ubiquitously available perivascular FDC precursors. F-1 = In the absence of TNF-α/LT-β, the TNF-R is not engaged, and the effect of PDGF-BB is maintained leading to extensive generation of αSMA+ myofibroblasts. F-2 = Myofibroblasts further divide, migrate and invade bones and cartilage, the vasculature degenerates due to loss of the stimulatory effect of the pericyte-derived VEGF and a fibroid pathotype of RA synovitis is instituted. L-1 = Pericyte activation by PDGF-BB induces CXCL13 expression and dissociation from the vessel wall thus facilitating B cell influx which extensively remodel of the vascular basement membrane. In the presence of B cell derived TNF-α/LT-β, the TNF-R is engaged leading to (1) downregulation of PDGFR-β and αSMA expression (2) upregulation of the FDC maturation markers like the antigen retaining complement and Fc receptors and BAFF. L-2 = Synovial retention of the circulating auto ICs on the mature FDC reticula induces B cell activation, proliferation, and local autoantibody production, thus establishing a fully functional ectopic lymphoid-like structure.

References

    1. Humby F, Bombardieri M, Manzo A, Kelly S, Blades MC, Kirkham B, et al. . Ectopic lymphoid structures support ongoing production of class-switched autoantibodies in rheumatoid synovium. PLoS Med. (2009) 6:e1. 10.1371/journal.pmed.0060001 - DOI - PMC - PubMed
    1. Pitzalis C, Jones GW, Bombardieri M, Jones SA. ectopic lymphoid-like structures in infection, cancer and autoimmunity. Nat Rev Immunol. (2014) 14:447–62. 10.1038/nri3700 - DOI - PubMed
    1. Humby F, Lewis M, Ramamoorthi N, Hackney JA, Barnes MR, Bombardieri M, et al. . Synovial cellular and molecular signatures stratify clinical response to Csdmard therapy and predict radiographic progression in early rheumatoid arthritis patients. Ann Rheum Dis. (2019) 78:761–72. 10.1136/annrheumdis-2018-214539 - DOI - PMC - PubMed
    1. Lewis MJ, Barnes MR, Blighe K, Goldmann K, Rana S, Hackney JA, et al. . Molecular portraits of early rheumatoid arthritis identify clinical and treatment response phenotypes. Cell Rep. (2019) 28:2455–70.e5. 10.1016/j.celrep.2019.07.091 - DOI - PMC - PubMed
    1. El Shikh ME, El Sayed RM, Szakal AK, Tew JG. T-Independent antibody responses to t-dependent antigens: a novel follicular dendritic cell-dependent activity. J Immunol. (2009) 182:3482–91. 10.4049/jimmunol.0802317 - DOI - PubMed