. 2022 Jun:108:102665.
doi: 10.1016/j.jmp.2022.102665. Epub 2022 Apr 23.

Adaptive Design Optimization for a Mnemonic Similarity Task

Affiliations

Adaptive Design Optimization for a Mnemonic Similarity Task

Manuel Villarreal et al. J Math Psychol. 2022 Jun.

Abstract

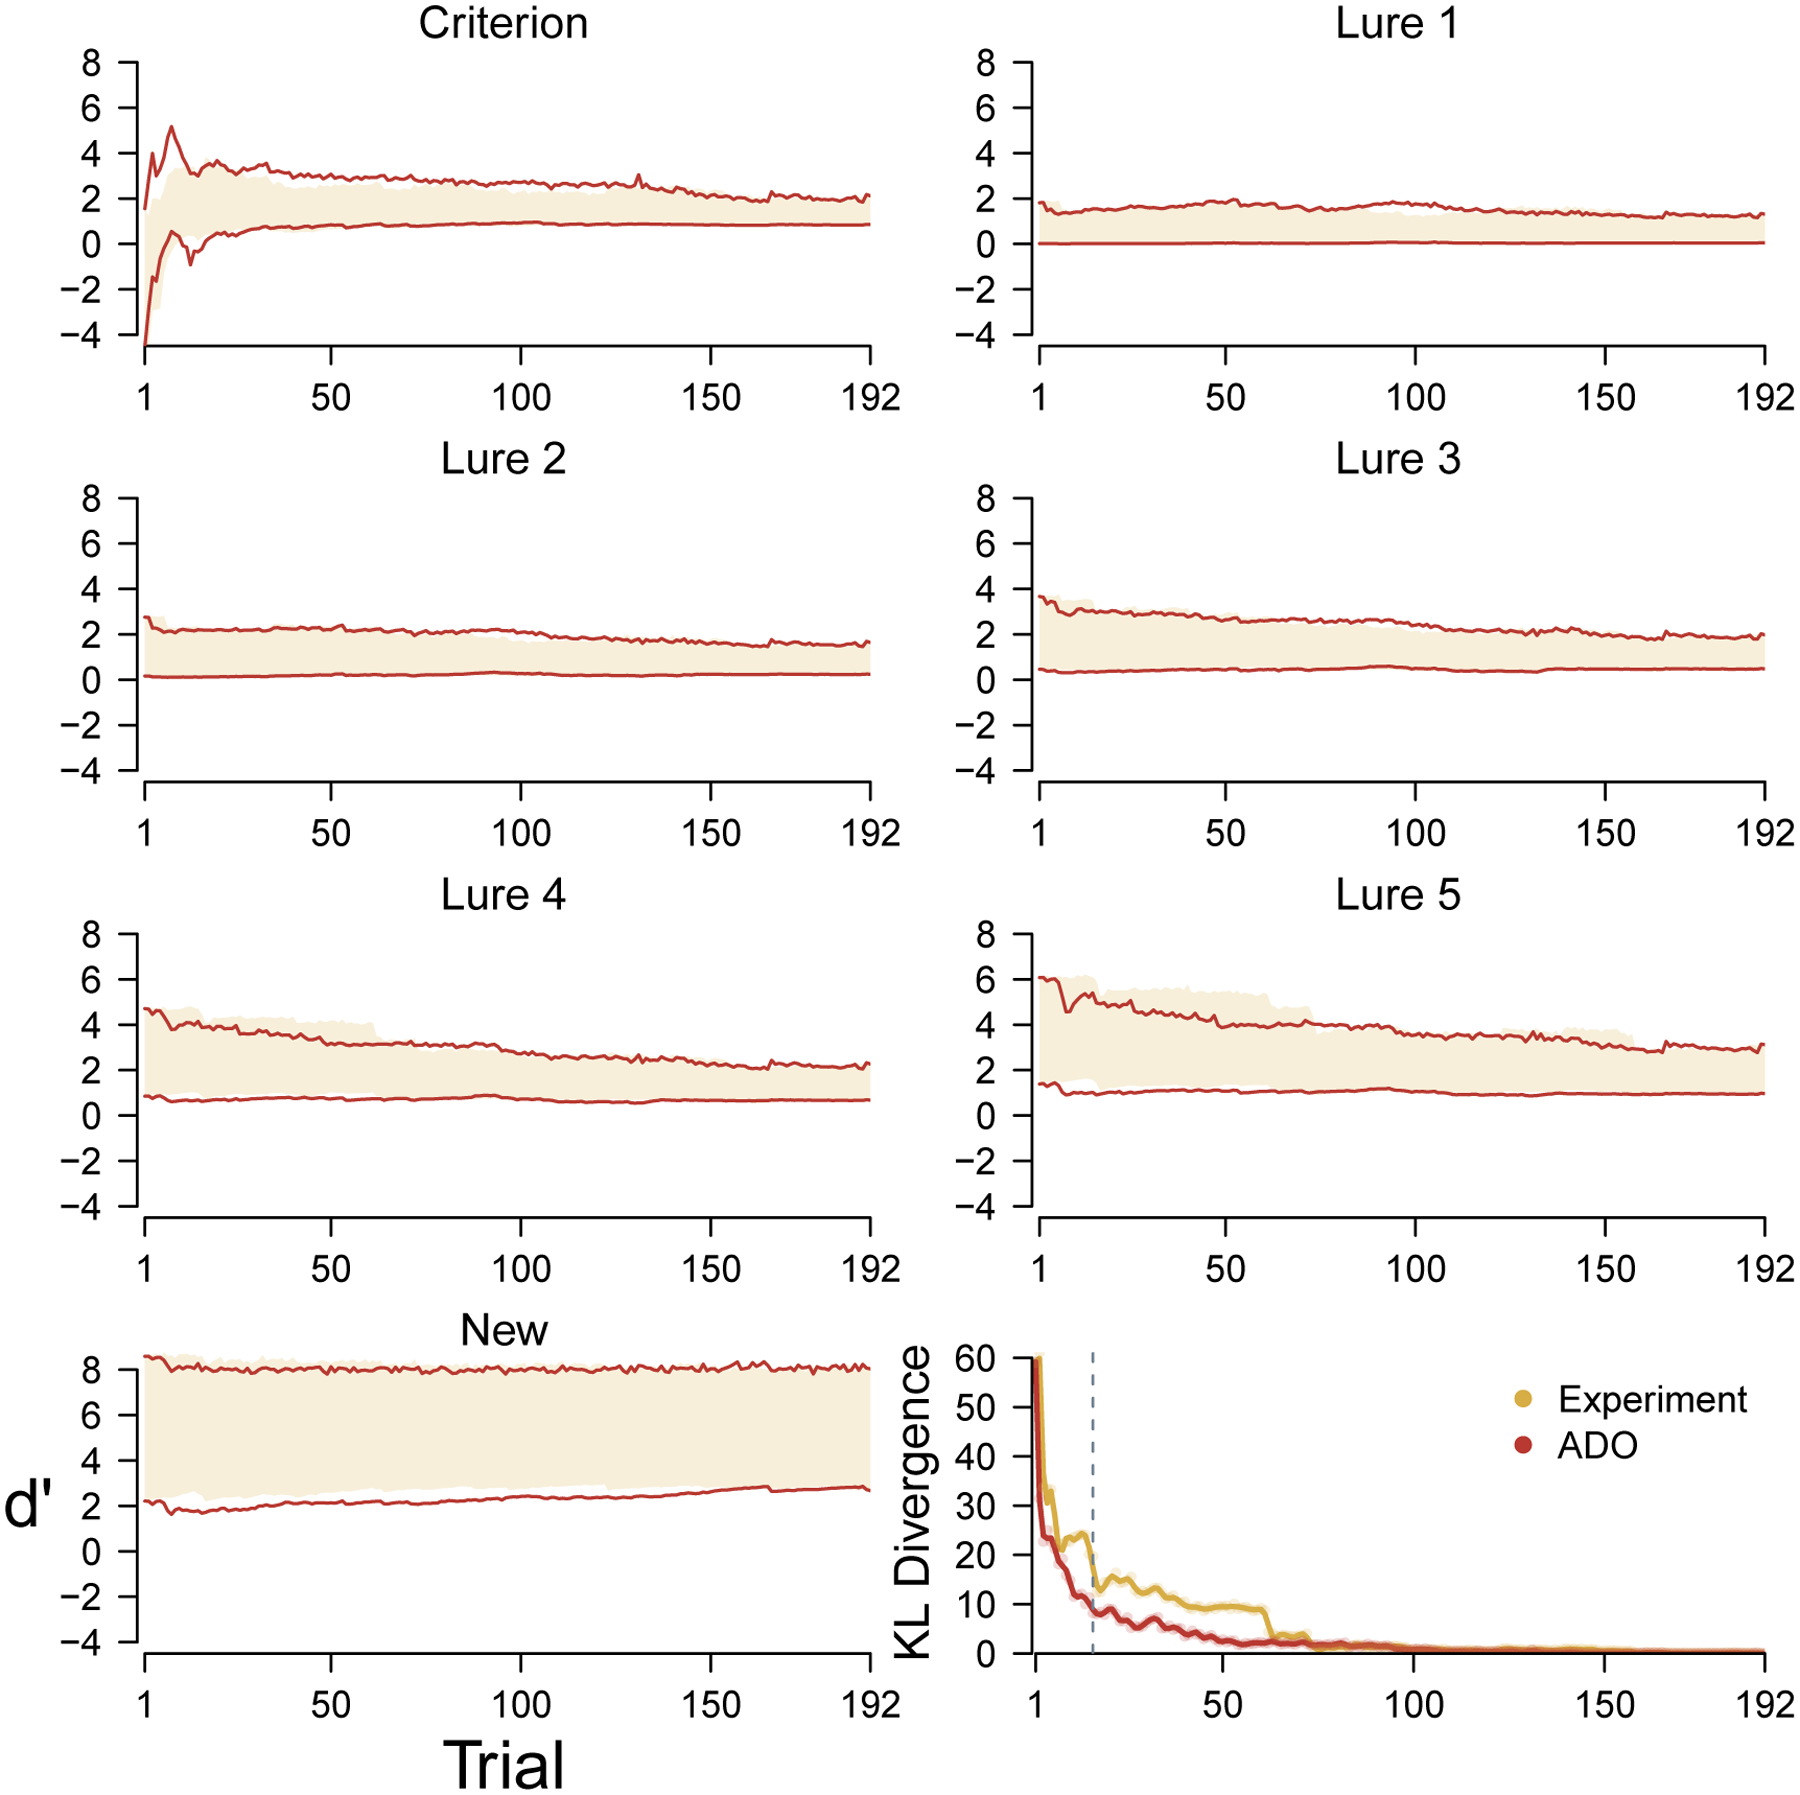
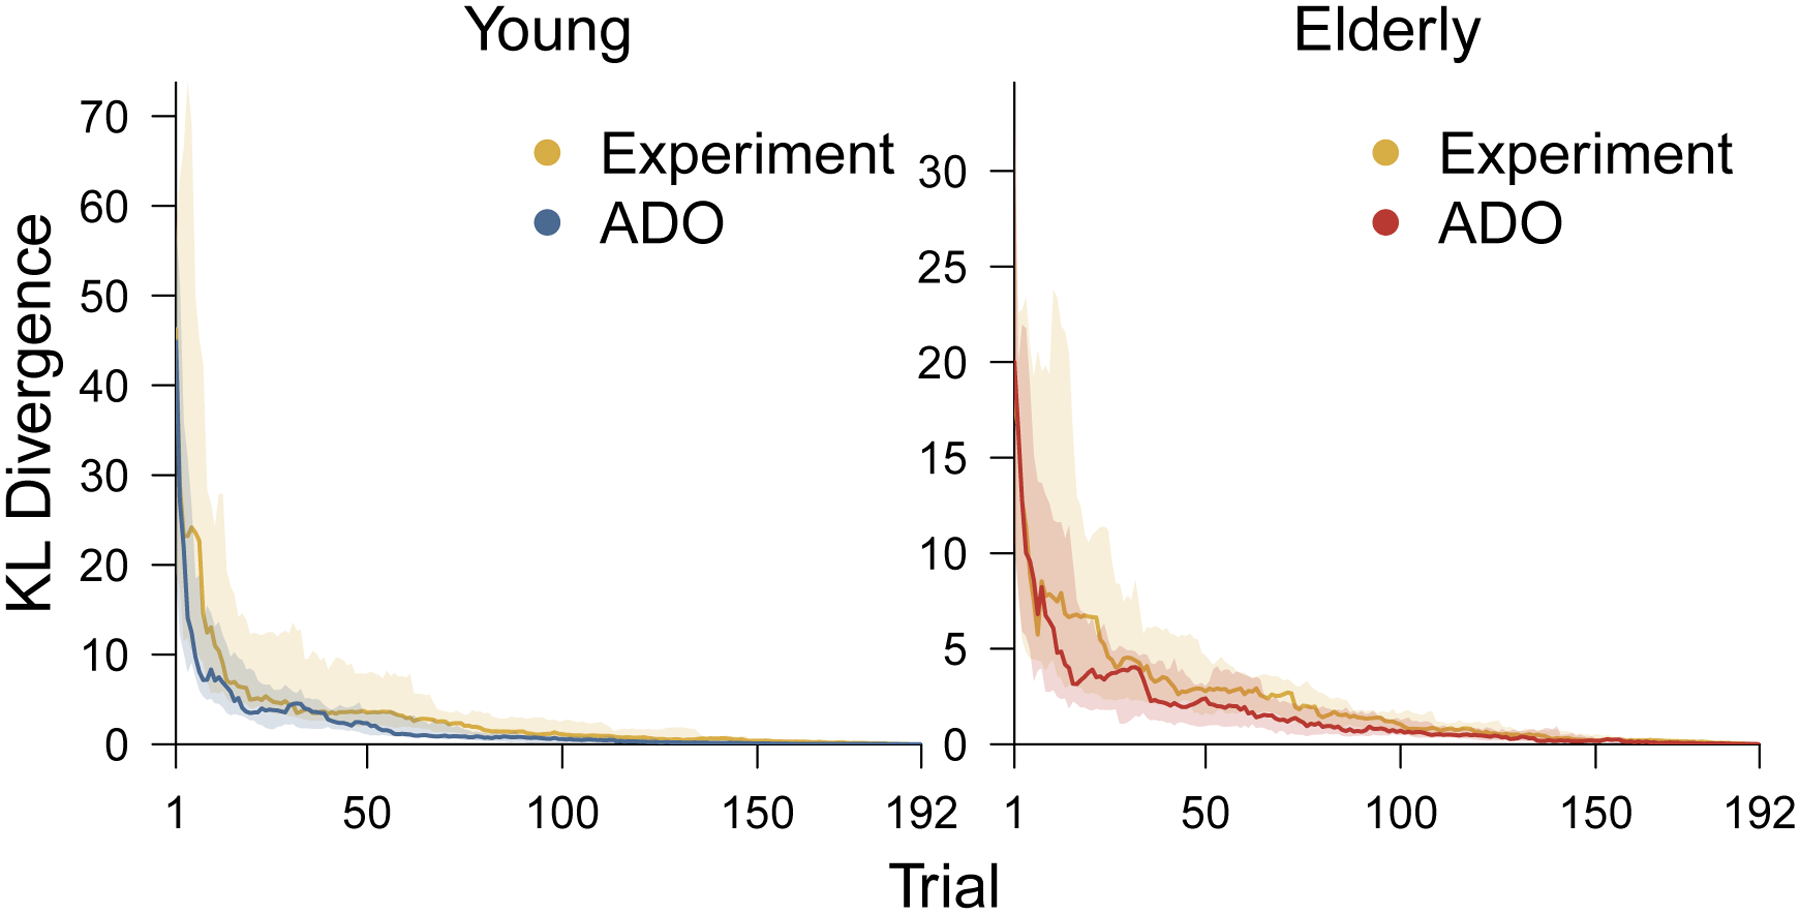
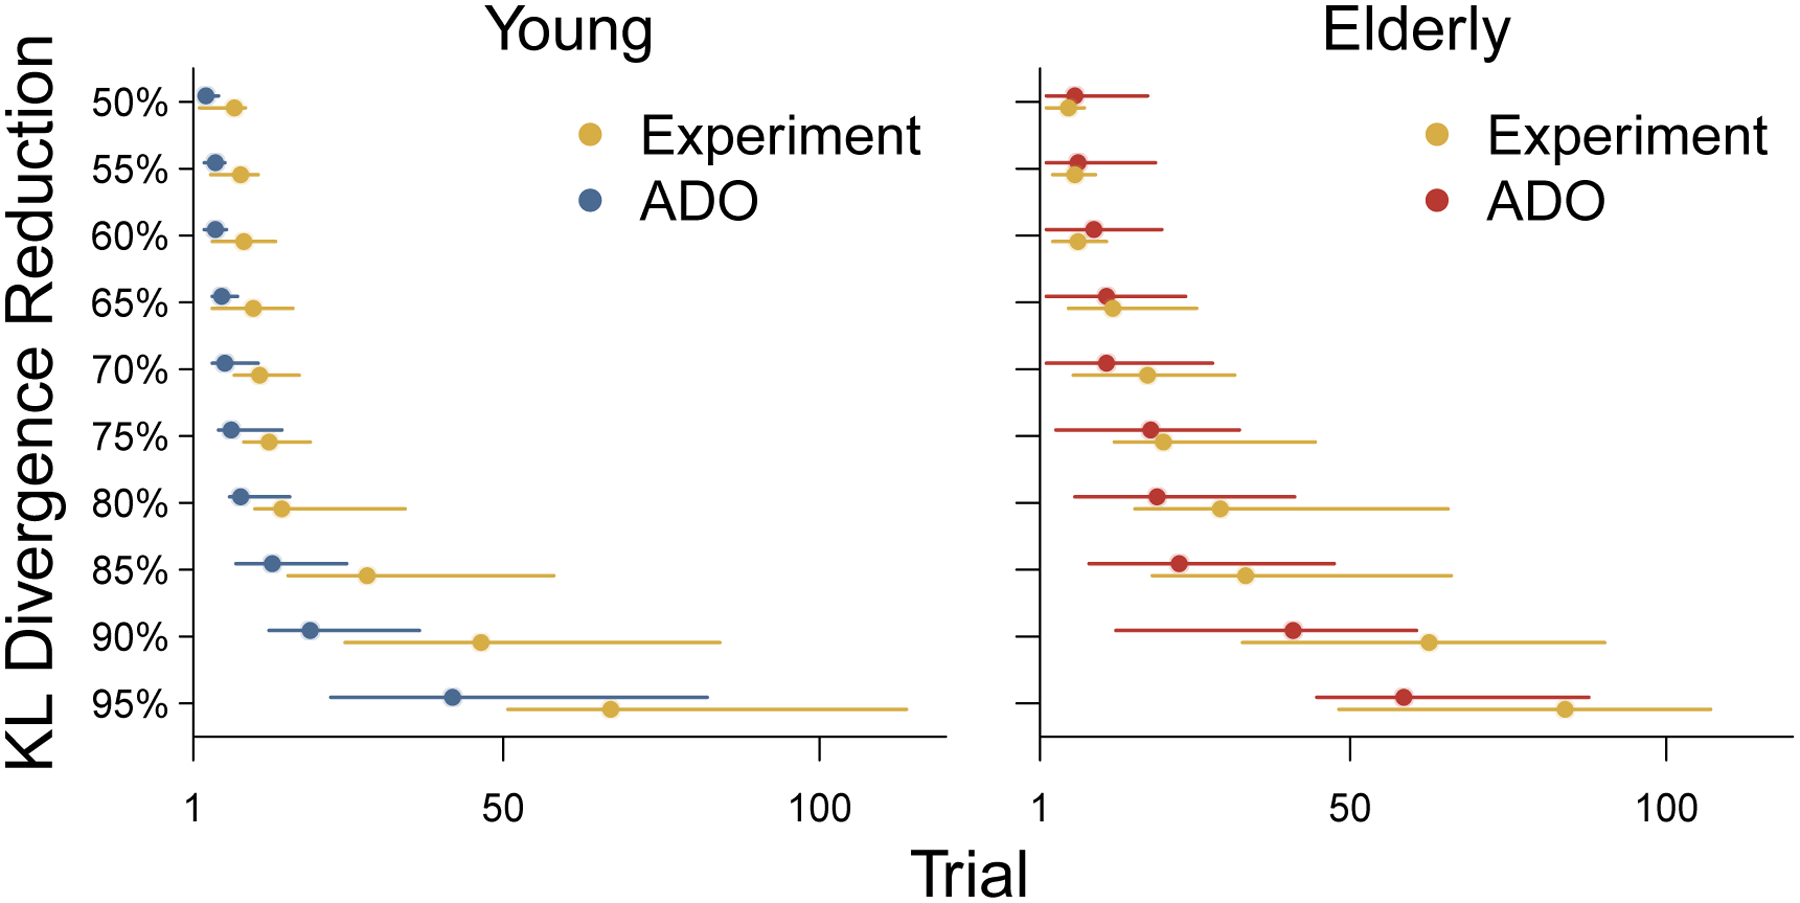
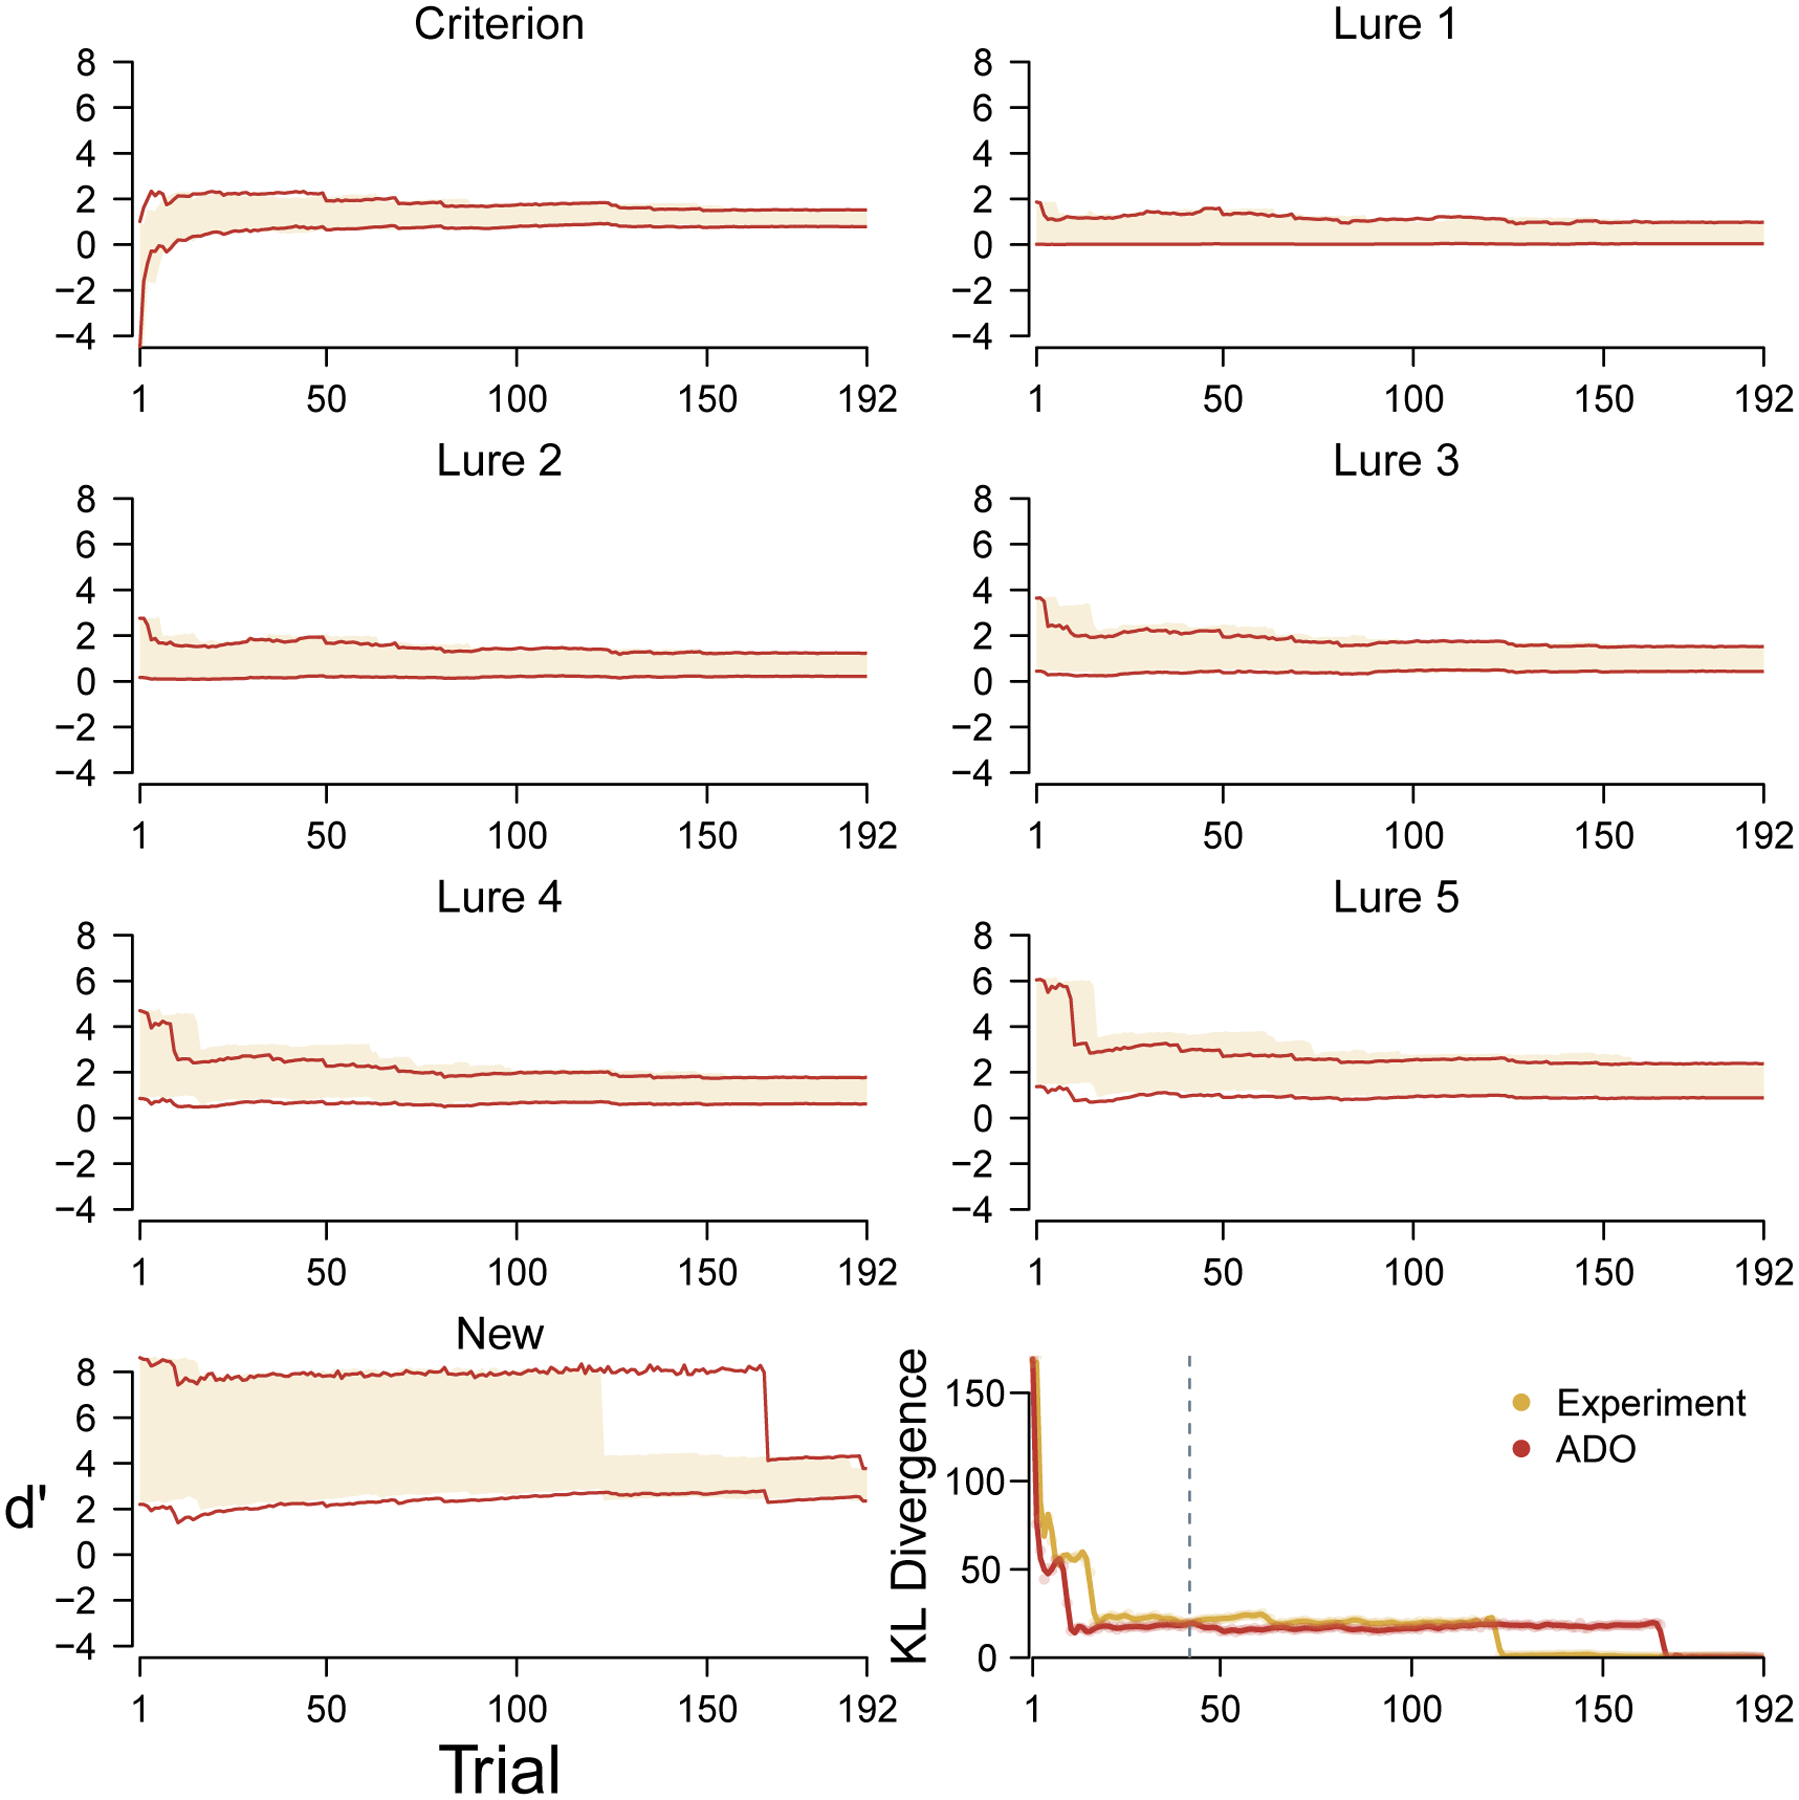
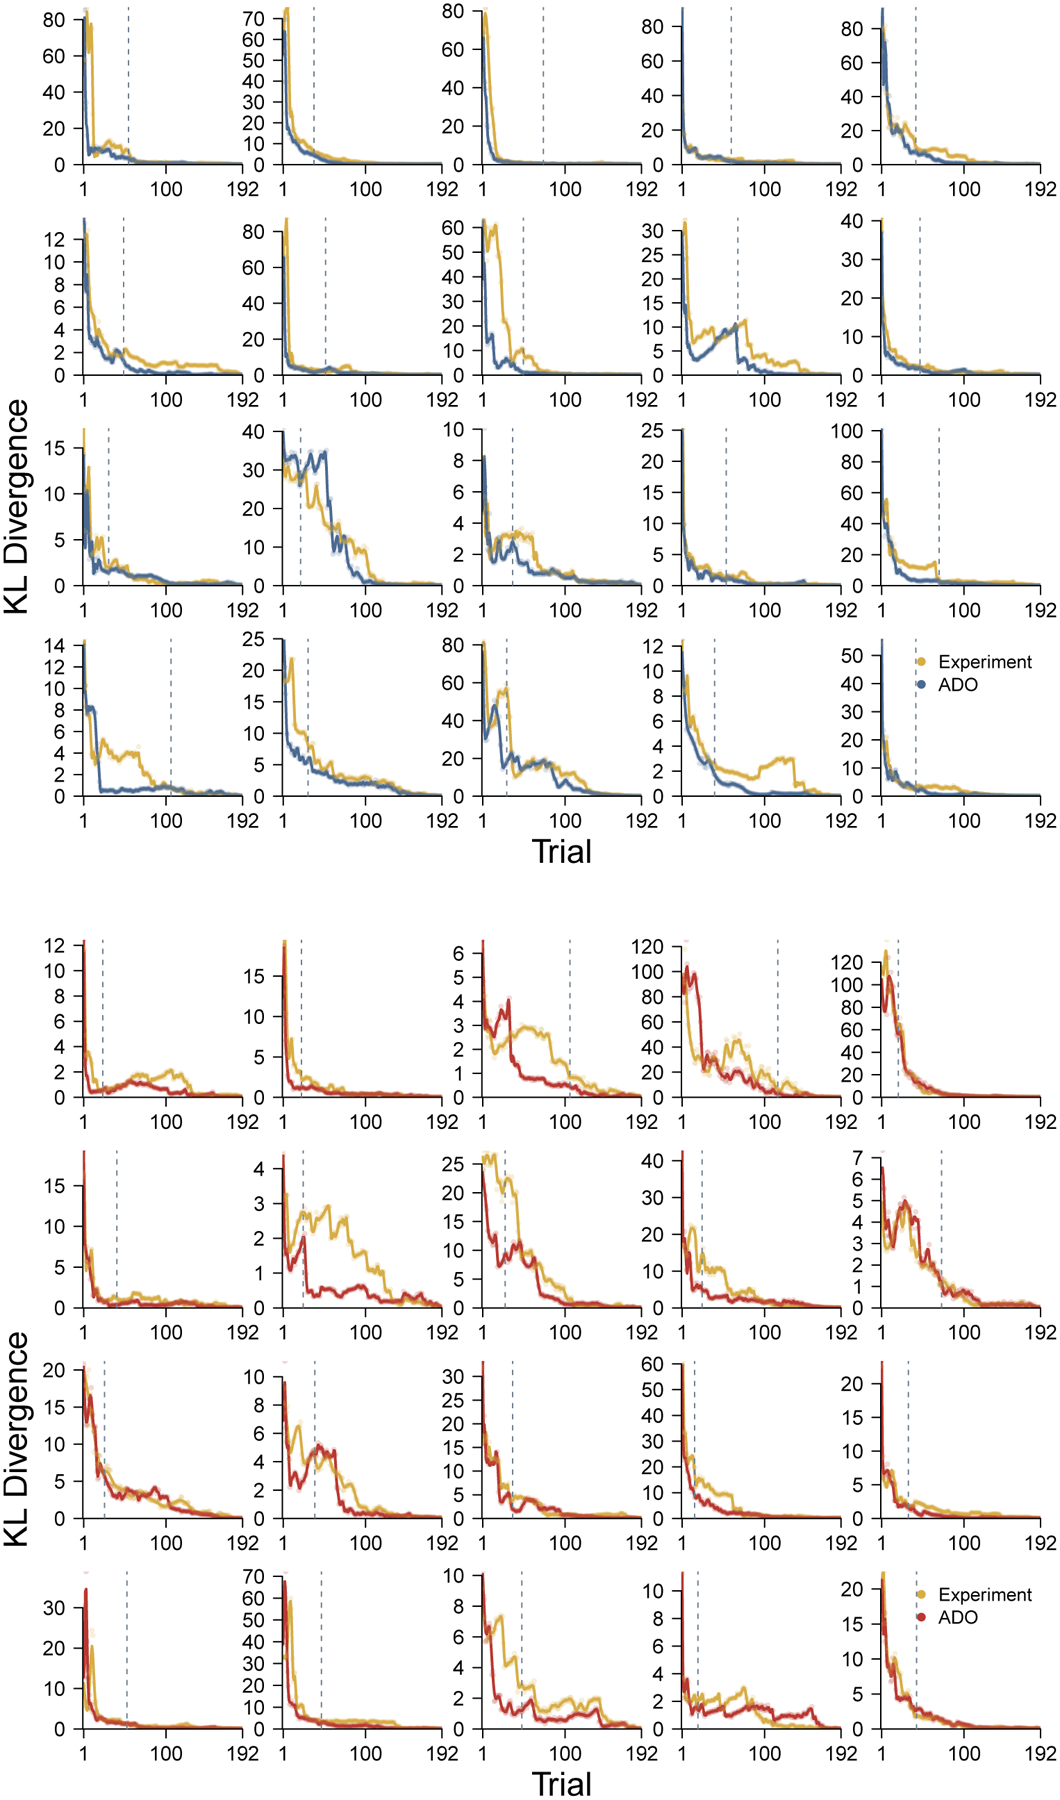
The Mnemonic Similarity Task (MST: Stark et al., 2019) is a modified recognition memory task designed to place strong demand on pattern separation. The sensitivity and reliability of the MST make it an extremely valuable tool in clinical settings, where it has been used to identify hippocampal dysfunction associated with healthy aging, dementia, schizophrenia, depression, and other disorders. As with any test used in a clinical setting, it is especially important for the MST to be administered as efficiently as possible. We apply adaptive design optimization methods (Lesmes et al., 2015; Myung et al., 2013) to optimize the presentation of test stimuli in accordance with previous responses. This optimization is based on a signal-detection model of an individual's memory capabilities and decision-making processes. We demonstrate that the adaptive design optimization approach generally reduces the number of test stimuli needed to provide these measures.

Keywords: Adaptive Design Optimization; Bayesian graphical models; Mnemonic Similarity Task; Signal Detection Theory; recognition memory.


Figures

Figure 1.
Figure 1.
Summary of the MST recognition behavior for young and elderly participants in the Stark et al. (2015) MST task. Box-and-whisker representations of the distribution of the proportion of “new” responses for each stimulus type, for both young and elderly participants, aggregated over all trials.
Figure 2.
Figure 2.
A signal detection theory cognitive model of recognition memory for the MST. Each distribution corresponds to a stimulus type, from which mental samples for specific stimuli are drawn on a trial. If the sample is above the criterion k a “new” response is generated, otherwise an “old” response is generated.
Figure 3.
Figure 3.
Graphical model representation of the signal detection theory cognitive model, including a latent-mixture trial-level contaminant process.
Figure 4.
Figure 4.
Change in posterior distributions for the discriminability and criterion of the cognitive model over trials, for both the original experimental and hypothetical ADO ordering of trials, for a young participant. The yellow shading and blue lines represent the 95% credible intervals of the marginal posterior distributions for the experimental and ADO orderings, respectively. The bottom-right panel shows the change in overall Kullback-Leibler divergence for both orderings. The broken line shows the first trial at which ADO was not able to use a stimulus from the highest-ranked type.
Figure 5.
Figure 5.
Change in posterior distributions for the discriminability and criterion of the cognitive model over trials, for both the original experimental and hypothetical ADO ordering of trials, for an elderly participant. The yellow shading and blue lines represent the 95% credible intervals of the marginal posterior distributions for the experimental and ADO orderings, respectively. The bottom-right panel shows the change in overall Kullback-Leibler divergence for both orderings. The broken line shows the first trial at which ADO was not able to use a stimulus from the highest-ranked type.
Figure 6.
Figure 6.
The distribution of change in KL divergence over trials for the ADO and experimental orders. The left panel corresponds to young participants and the right panel corresponds to elderly participants. Within each panel the blue (for young) and red (for elderly) shaded region shows the interquartile range of KL divergence across all participants, and the solid blue and red lines show the median. In both panels, the shaded yellow region shows the interquartile range of KL divergence for the experimental order and the solid line shows the median.
Figure 7.
Figure 7.
The rate of reduction in KL divergence for both the original experimental and hypothetical ADO ordering of trials for young and elderly participants. Circular markers show the mean number of trials across participants needed to achieve 50%, 55%, …, 95% reduction in KL divergence towards its final value when all trials are incorporated. Error bars show interquartile intervals of the distribution of the number of trials needed.
Figure 8.
Figure 8.
Analysis of both the original experimental and hypothetical ADO ordering of trials based on a version of the cognitive model that does not include a contaminant, for the same elderly participant as Figure 5.
Figure 9.
Figure 9.
Order in which stimulus types are presented by ADO for a young participant. The panels correspond to the different stimulus types. Blue lines show the proportion of stimuli of that type that have been presented after each trial by ADO. Blue circular markers on the line indicate that the stimulus type was the one with maximum expected information gain according to ADO. Yellow lines show the proportion of stimuli of that type after each trial in the experimental order.
Figure 10.
Figure 10.
Average proportion of each stimulus type are presented by ADO after each trial, aggregated over all young participants (left panel) and all elderly participants (right panel).
Figure 11.
Figure 11.
The distribution of change in KL divergence over trials for the ADO and experimental orders for six simulated participants in an MST experiment that allows for unlimited stimuli of each type. The top panels correspond to young participants and the bottom panels correspond to elderly participants. In each row, the leftmost panel represents a low-accuracy participant from that group, the middle panel represents an average-accuracy participant, and the right panel represents a high-accuracy participant. Within each panel the blue (for young) and red (for elderly) shaded region shows the interquartile range of KL divergence across all participants, and the solid blue and red lines show the median. In both panels, the shaded yellow region shows the interquartile range of KL divergence for a collections of experimental orders and the solid line shows the median.
Figure 12.
Figure 12.
Frequency of presentation of each stimulus type for simulated young and simulated elderly participants, and the original experimental design of the MST.
Figure 13.
Figure 13.
The change in KL divergence for all 40 participants from Stark et al. (2015).

References

    1. Ahn W-Y, et al. (2020). Rapid, precise, and reliable measurement of delay discounting using a Bayesian learning algorithm. Scientific Reports, 10, 1–10. - PMC - PubMed
    1. Batchelder WH & Riefer DM (1980). Separation of Storage and Retrieval Factors in Free Recall of Clusterable Pairs. Psychological Review, 87, 375–397.
    1. Bröder A & Schiffer S (2006). Stimulus format and working memory in fast and frugal strategy selection. Journal of Behavioral Decision Making, 19, 361–380.
    1. Brown MW & Aggleton JP (2001). Recognition memory: what are the roles of the perirhinal cortex and hippocampus? Nature Reviews Neuroscience, 2, 51–61. - PubMed
    1. Cavagnaro DR, Aranovich GJ, McClure SM, Pitt MA, & Myung JI (2016). On the functional form of temporal discounting: An optimized adaptive test. Journal of Risk and Uncertainty, 52, 233–254. - PMC - PubMed