

Urban density and COVID-19: understanding the US experience
- PMID: 36465997
- PMCID: PMC9702884
- DOI: 10.1007/s00168-022-01193-z
Urban density and COVID-19: understanding the US experience
Abstract
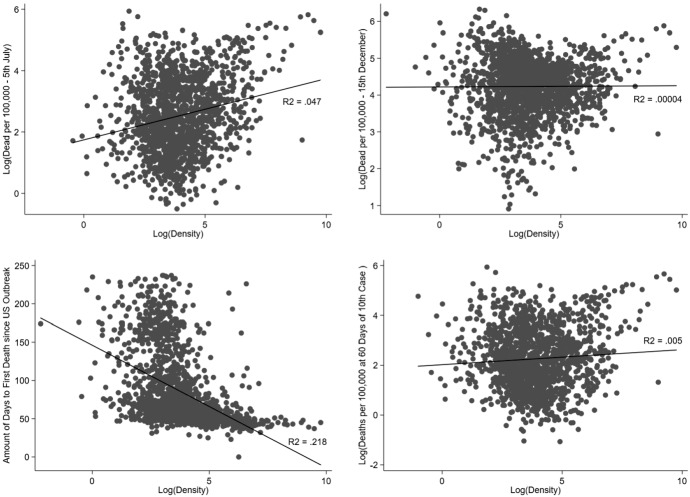
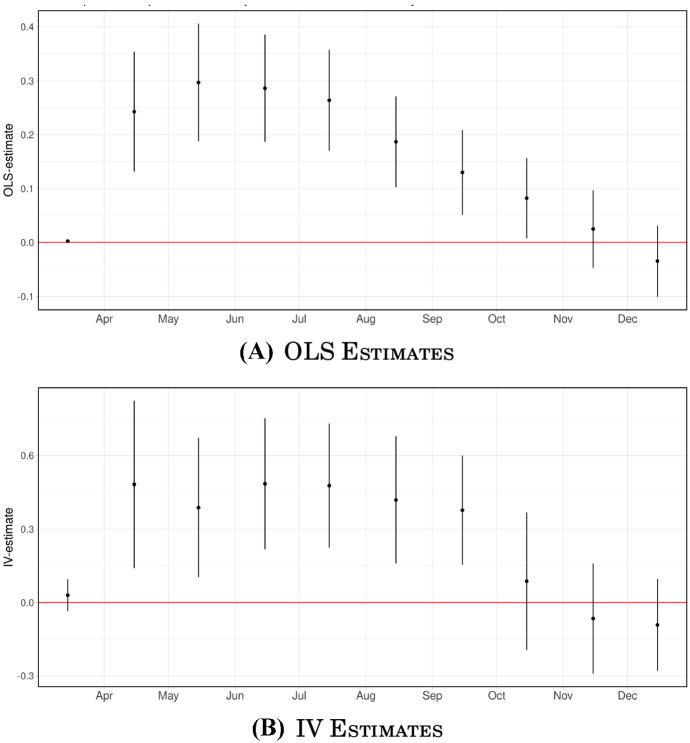
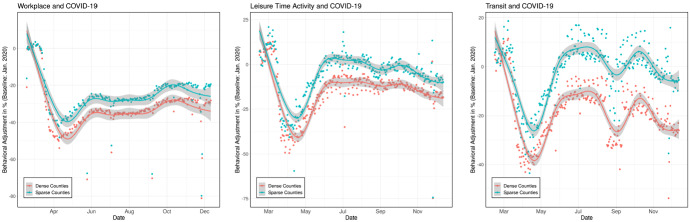
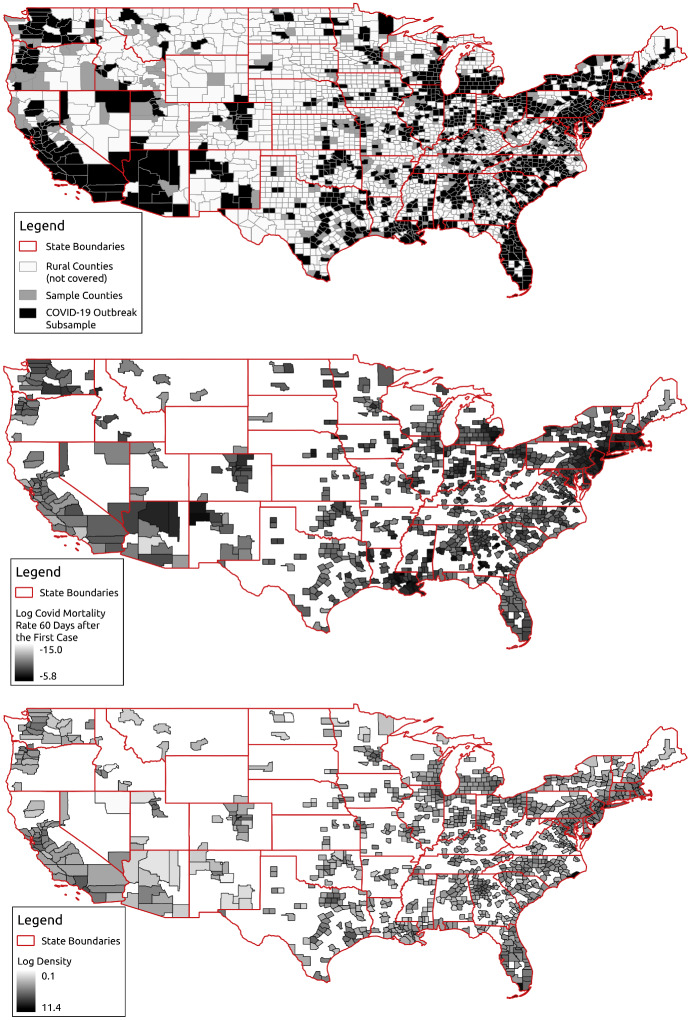
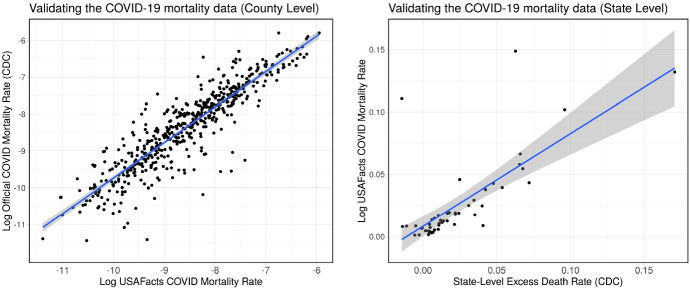
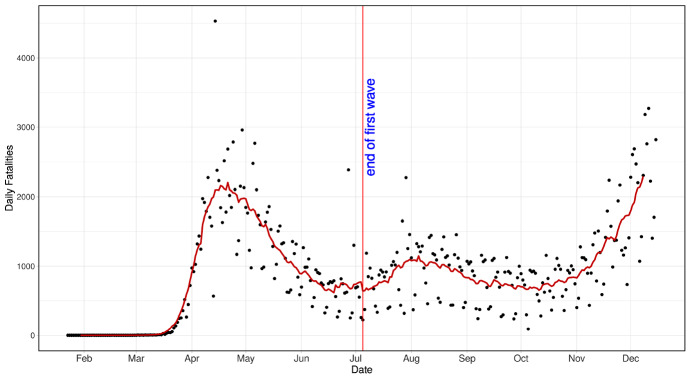
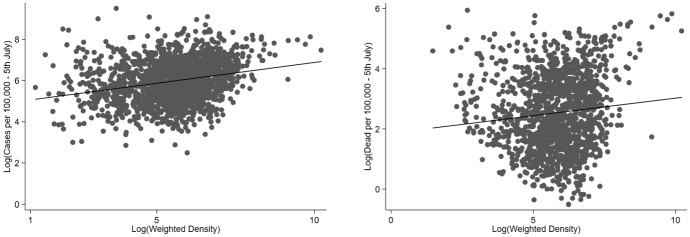
This paper revisits the debate around the link between population density and the severity of COVID-19 spread in the USA. We do so by conducting an empirical analysis based on graphical evidence, regression analysis and instrumental variable strategies borrowed from the agglomeration literature. Studying the period between the start of the epidemic and the beginning of the vaccination campaign at the end of 2020, we find that the cross-sectional relationship between density and COVID-19 deaths changed as the year evolved. Initially, denser counties experienced more COVID-19 deaths. Yet, by December, the relationship between COVID deaths and urban density was completely flat. This is consistent with evidence indicating density affected the timing of the outbreak-with denser locations more likely to have an early outbreak-yet had no influence on time-adjusted COVID-19 cases and deaths. Using data from Google, Facebook, the US Census and other sources, we investigate potential mechanisms behind these findings.
© The Author(s) 2022.
Figures
Similar articles
-
Assessment of Structural Barriers and Racial Group Disparities of COVID-19 Mortality With Spatial Analysis.JAMA Netw Open. 2022 Mar 1;5(3):e220984. doi: 10.1001/jamanetworkopen.2022.0984. JAMA Netw Open. 2022. PMID: 35244703 Free PMC article.
-
What determines city's resilience against epidemic outbreak: evidence from China's COVID-19 experience.Sustain Cities Soc. 2021 Jul;70:102892. doi: 10.1016/j.scs.2021.102892. Epub 2021 Mar 30. Sustain Cities Soc. 2021. PMID: 33816083 Free PMC article.
-
Association of stay-at-home orders and COVID-19 incidence and mortality in rural and urban United States: a population-based study.BMJ Open. 2022 Apr 7;12(4):e055791. doi: 10.1136/bmjopen-2021-055791. BMJ Open. 2022. PMID: 35393311 Free PMC article.
-
Modelling the SARS-CoV-2 vaccination campaign in Italy: the fundamental role of unreported cases.IJID Reg. 2022 Jun;3:24-26. doi: 10.1016/j.ijregi.2022.02.006. Epub 2022 Feb 19. IJID Reg. 2022. PMID: 35720140 Free PMC article. Review.
-
Travel-related control measures to contain the COVID-19 pandemic: a rapid review.Cochrane Database Syst Rev. 2020 Oct 5;10:CD013717. doi: 10.1002/14651858.CD013717. Cochrane Database Syst Rev. 2020. Update in: Cochrane Database Syst Rev. 2021 Mar 25;3:CD013717. doi: 10.1002/14651858.CD013717.pub2. PMID: 33502002 Updated.
Cited by
-
Structural modeling of COVID-19 spread in relation to human mobility.Transp Res Interdiscip Perspect. 2022 Mar;13:100528. doi: 10.1016/j.trip.2021.100528. Epub 2021 Dec 29. Transp Res Interdiscip Perspect. 2022. PMID: 35128388 Free PMC article.
-
Cities in a pandemic: Evidence from China.J Reg Sci. 2022 Nov 2:10.1111/jors.12626. doi: 10.1111/jors.12626. Online ahead of print. J Reg Sci. 2022. PMID: 36714217 Free PMC article.
-
Numerical analysis of factors, pace and intensity of the corona virus (COVID-19) epidemic in Poland.Ecol Inform. 2021 Jul;63:101284. doi: 10.1016/j.ecoinf.2021.101284. Epub 2021 Mar 29. Ecol Inform. 2021. PMID: 33815029 Free PMC article.
-
Evolution of COVID-19 dynamics in Guangdong Province, China: an endemic-epidemic modeling study.Arch Public Health. 2024 Oct 2;82(1):173. doi: 10.1186/s13690-024-01406-1. Arch Public Health. 2024. PMID: 39358819 Free PMC article.
-
The efficiency of COVID cases to COVID policies: a robust conditional approach.Empir Econ. 2022;63(6):2903-2948. doi: 10.1007/s00181-022-02234-4. Epub 2022 Apr 9. Empir Econ. 2022. PMID: 35431413 Free PMC article.
References
-
- Almagro M, Coven J, Gupta A, Orane-Hutchinson A (2020) “Racial disparities in frontline workers and housing crowding during COVID-19: Evidence from geolocation data.” Available at SSRN 3695249
-
- Angel S, Lamson-Hall P, Tamayo MMS et al (2020) Coronavirus and the cities: explaining variations in the onset of infection and in the number of reported cases and deaths in US metropolitan areas as of 27 March 2020. New York University, Marron Institute of Urban Management
Publication types
LinkOut - more resources
Full Text Sources