. 2022 Nov 23:2022:2257427.
doi: 10.1155/2022/2257427. eCollection 2022.

NS1619 Alleviate Brain-Derived Extracellular Vesicle-Induced Brain Injury by Regulating BKca Channel and Nrf2/HO-1/NF-ĸB Pathway

Affiliations

NS1619 Alleviate Brain-Derived Extracellular Vesicle-Induced Brain Injury by Regulating BKca Channel and Nrf2/HO-1/NF-ĸB Pathway

Yalong Gao et al. Oxid Med Cell Longev. .

Abstract

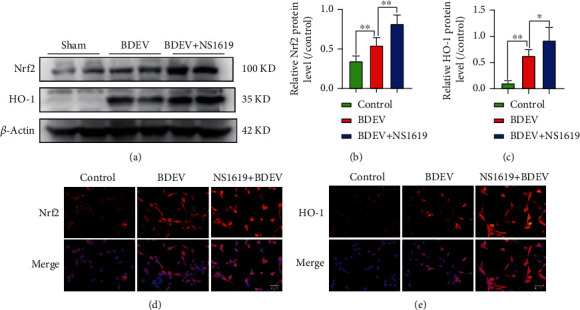
Brain induced extracellular vesicle (BDEV) elevates after traumatic brain injury (TBI) and contributes to secondary brain injury. However, the role of BDEV in TBI remains unclear. In this study, we determined the mechanisms of BDEV in brain injury and explored whether neuroprotective drug BKca channel opener NS1619 may attenuate BDEV-induced brain injury. We injected BDEV and lactadherin, respectively, to mimic the up and downregulation of BDEV after TBI and illustrated the role of BDEV in vivo. In vitro, the membrane potential and calcium concentration of HT-22, bEnd3, and BV-2 were measured by fluorescent staining. The effects of BDEV and NS1619 on HT-22 were evaluated by CCK-8, LDH release assay, Na+/k+-ATPase activity, JC-1 staining, DHE staining, and 4-HNE staining, respectively. The role of BDEV and NS1619 on the Nrf2/HO-1/p65 pathway was also evaluated in HT-22. Finally, we administrated TBI mice with NS1619 to clarify the role of NS1619 against BDEV in vivo. Our results suggested that BDEV aggravated and lactadherin mitigated TBI-induced EB leakage, brain edema, neuronal degeneration, apoptosis, ROS level, microgliosis, MMP-9 activity, and NF-κB activation. In vitro, BDEV-caused depolarized membrane potential and calcium overload were significantly attenuated by NS1619 in HT-22, bEnd3, and BV-2. BDEV markedly decreased cell viability, Na+/k+-ATPase activity, and caused mitochondrial dysregulation, oxidative stress, and NF-ĸB activation. NS1619 pretreatment alleviated above process and enhanced antioxidant system Nrf2/HO-1 in HT-22. Finally, NS1619 administration significantly inhibited neuroinflammation response and improved TBI outcome after TBI. NS1619 treatment also reduced 4-HNE content and NF-ĸB activation and enhanced Nrf2/HO-1 pathway. Our data showed that BDEV aggravated brain injury by perturbing cell membrane potential, calcium homeostasis, oxidative stress, and neuroinflammation. The BKca channel opener NS1619 attenuated BDEV-induced pathological process in vitro and in vivo by modulating the BKca channel and Nrf2/HO-1/NF-ĸB pathway.


Conflict of interest statement

These authors declare that they have no competing interests.

Figures

Figure 1
Figure 1
BDEV aggravated and Lac mitigated cerebral damage 3 days after TBI. (a) BBB permeability was estimated using EB leakage assay. (b) Quantitative analysis of EB content in injured regions (n = 6/group). (c) The content of cerebral edema in ipsilateral and contralateral regions (n = 6/group). (d, e) Representative images of FJC labeling (green) and quantitation of FJC positive cells (n = 6/group, scale bar = 50 μm). (f, g) Representative WB bands and quantification of relative protein expression for cleaved caspase-3 (n = 7/group). (h, i) Typical double immunofluorescence images of NeuN (red) and MMP9 (green), and quantitation of double-positive cells (n = 6/group, scale bar = 50 μm). Data are shown as mean ± SD. p < 0.05, ∗∗p < 0.01.
Figure 2
Figure 2
BDEV exacerbated and Lac alleviated oxidative stress and neuroinflammation 3 days after TBI. (a, b) Representative images of DHE labeling (red) and quantitation of DHE positive cells (n = 6/group, scale bar = 50 μm). (c) MDA content in the brain (n = 6/group). (d, e) Representative images of Iba-1 labeling (red) and quantitation of Iba-1 positive cells (n = 6/group, scale bar = 50 μm). Data are shown as mean ± SD. p < 0.05, ∗∗p < 0.01.
Figure 3
Figure 3
BDEV upregulated and Lac downregulated NF-κB/p65 pathway 3 days after TBI. Lac mediated BDEV uptake by astrocytes and microglia. (a, b) Representative WB bands and quantification of relative protein expression for NF-κB/p-p65 (n = 6/group). (c) Representative images of NF-κB/p65 staining (red) (n = 3/group, scale bar = 50 μm). (d) Representative images of colocalization of microglia/macrophages (red) and astrocytes (red) with BDEV (Green, FITC labeled Lac) (n = 3/group, scale bar = 50 μm). (e) Lac reduced PS-positive EV in circulation. (f. g) The concentration and total protein content of BDEV in brain at 3 h and 12 h after TBI. Data are shown as mean ± SD. p < 0.05, ∗∗p < 0.01.
Figure 4
Figure 4
BDEV-induced cell damage was attenuated by NS1619 in HT-22. (a) BDEV induced a concentration-dependent increase of HT-22 membrane potential (n = 6/group). (b) NS1619 inhibited increased membrane potential induced by BDEV in HT-22 (n = 6/group). (c) Representative fluorescence images of DiBAC4(3) staining in HT-22 (Green, n = 3/group, scale bar = 50 μm). (d) BDEV induced a concentration-dependent increase of calcium concentration in HT-22 (n = 6/group). (e) BDEV-induced cytoplasmic calcium overload was completely blocked by NS1619 and partially blocked by 2-APB and calcium-free solution, but not blocked by tetracaine and nifedipine (n = 6/group). (f) NS1619 restored inactivated Na+/K+-ATPase damaged by BDEV in HT-22 (n = 6/group). (g) NS1619 effectively ameliorated the decrease of HT-22 cell viability caused by BDEV detected by a CCK-8 assay (n = 6/group). (h) NS1619 effectively reduced the release of LDH in HT-22 caused by BDEV (n = 6/group). (i) NS1619 effectively inhibited PS eversion induced by BDEV (n = 3/group, scale bar = 20 μm). Data are shown as mean ± SD. ns, p > 0.05, p < 0.05, ∗∗p < 0.01.
Figure 5
Figure 5
NS1619 reduced BDEV-induced ΔΨm disruption, ROS release, oxidative stress products. (a, b) NS1619 pretreatment markedly improved mitochondrial membrane potential destroyed by BDEV in cultured HT-22 (n = 6/group, scale bar = 50 μm). (c–e) Intracellular ROS level in HT-22 stained by DHE was determined by flow cytometry. NS1619 pretreatment markedly reduced ROS level caused by BDEV in cultured HT-22 (n = 6/group). (f, g) Representative images of 4-HNE staining (red) and statistical analysis (n = 3/group, scale bar = 20 μm). Data are shown as mean ± SD. ∗∗p < 0.01.
Figure 6
Figure 6
Effect of BDEV and NS1619 on the protein expression of Nrf2 and HO-1 in HT-22. Cultured HT-22 was treated with BDEV or BDEV+NS1619 (pretreatment, 40 μM for 12 hr). (a–c) Representative WB bands and quantification of relative protein expression for Nrf2 and HO-1 (n = 6/group). (d) Representative images of Nrf2 staining (red) (n = 3/group, scale bar = 40 μm). (e) Representative images of HO-1 staining (red) (n = 3/group, scale bar = 40 μm). Data are shown as mean ± SD. p < 0.05, ∗∗p < 0.01.
Figure 7
Figure 7
BDEV-induced NF-κB/p65 activation was inhibited by NS1619 in HT-22. (a, b) Representative WB bands and quantification of relative protein expression for NF-κB/p-p65 (n = 6/group). (c) Representative images of NF-κB/p65 staining (red) (n = 3/group, scale bar = 20 μm). Data are shown as mean ± SD. p < 0.05, ∗∗p < 0.01.
Figure 8
Figure 8
BDEV-induced membrane potential disturbance and calcium overload were attenuated by NS1619 in bEnd3 and BV-2. (a) NS1619 attenuated membrane potential depolarization induced by BDEV in bEnd3 (n = 6/group). (b) NS1619, nifedipine and Ca2+-free solution significantly ameliorated cytoplasmic calcium overload induced by BDEV in bEnd3 (n = 6/group). (c, d) NS1619 inhibited increased membrane potential and cytoplasmic calcium overload induced by BDEV in BV-2 (n = 6/group). Data are shown as mean ± SD. p < 0.05, ∗∗p < 0.01. #p < 0.05 versus the control group, ##p < 0.01 versus the control group.
Figure 9
Figure 9
NS1619 treatment reduced EB leakage and brain edema and improved neurologic function after TBI. (a, b) NS1619 reduced EB leakage content. (c) NS1619 reduced brain edema content. (d, e) NS1619 improved motor function and neurologic deficits in TBI mice. (f, g) Representative immunofluorescence images and quantification of TUNEL (green) and NeuN (red) positive cells (n = 6/group, scale bar = 50 μm). (h, i) Representative double immunofluorescence images of NeuN (red) and MMP9 (green), and quantitation of double-positive cells (n = 6/group, scale bar = 40 μm). Data are shown as mean ± SD. ns, p > 0.05, p < 0.05, ∗∗p < 0.01; #p < 0.05, ##p < 0.01 versus the control group.
Figure 10
Figure 10
NS1619 attenuated the inflammatory response and inflammatory pathway in the brain 3 days after TBI. (a–c) NS1619 treatment markedly increased arginase1-positive microglia/macrophages and decreased iNOS-positive microglia/macrophages and GFAP-positive cells (scale bar = 20 μm). (d–f) Quantification of immunofluorescence images (n = 6/group). (g–j) NS1619 significantly increased anti-inflammatory cytokine IL-10 but decreased proinflammatory cytokines IL-1β, IL-6, and TNF-α in brain tissue after TBI (n = 7/group). (k,l) Representative WB bands and quantification of relative protein expression for NF-κB/p-p65 (n = 6/group). (m) Representative immunofluorescence images of NF-κB/p-p65 staining (red) (n = 3/group, scale bar = 50 μm). Data are shown as mean ± SD. p < 0.05, ∗∗p < 0.01.
Figure 11
Figure 11
NS1619 attenuated oxidative stress and regulated antioxidant pathway 3 days after TBI. (a, b) Representative immunofluorescence images and quantification of 4-HNE (green) and NeuN (red) double-positive cells (n = 6/group, scale bar = 20 μm). (c–e) Representative WB bands and quantification of Nrf2 and HO-1 proteins (n = 6/group). (f, g) Representative immunofluorescence images of Nrf2 (red), HO-1 (red) and NeuN (green) (n = 3/group, scale bar = 50 μm). Data are shown as mean ± SD. ns, p > 0.05, p < 0.05, ∗∗p < 0.01.

Similar articles

Cited by

References

    1. McKee C. A., Lukens J. R. Emerging roles for the immune system in traumatic brain injury. Frontiers in Immunology . 2016;7:p. 556. doi: 10.3389/fimmu.2016.00556. - DOI - PMC - PubMed
    1. Ng S. Y., Lee A. Y. W. Traumatic brain injuries: pathophysiology and potential therapeutic targets. Frontiers in Cellular Neuroscience . 2019;13:p. 528. doi: 10.3389/fncel.2019.00528. - DOI - PMC - PubMed
    1. Robertson C. L. Mitochondrial dysfunction contributes to cell death following traumatic brain injury in adult and immature animals. Journal of Bioenergetics and Biomembranes . 2004;36(4):363–368. doi: 10.1023/B:JOBB.0000041769.06954.e4. - DOI - PubMed
    1. Liu X., Zhao Z., Ji R., et al. Inhibition of P2X7 receptors improves outcomes after traumatic brain injury in rats. Purinergic Signal . 2017;13(4):529–544. doi: 10.1007/s11302-017-9579-y. - DOI - PMC - PubMed
    1. Rong H., Fan Y., Yang M., et al. Brain-derived microparticles activate microglia/macrophages and induce neuroinflammation. Brain Research . 2018;1694:104–110. doi: 10.1016/j.brainres.2018.05.015. - DOI - PubMed