

Linear discriminant analysis of phenotypic data for classifying autism spectrum disorder by diagnosis and sex
- PMID: 36466170
- PMCID: PMC9709432
- DOI: 10.3389/fnins.2022.1040085
Linear discriminant analysis of phenotypic data for classifying autism spectrum disorder by diagnosis and sex
Abstract
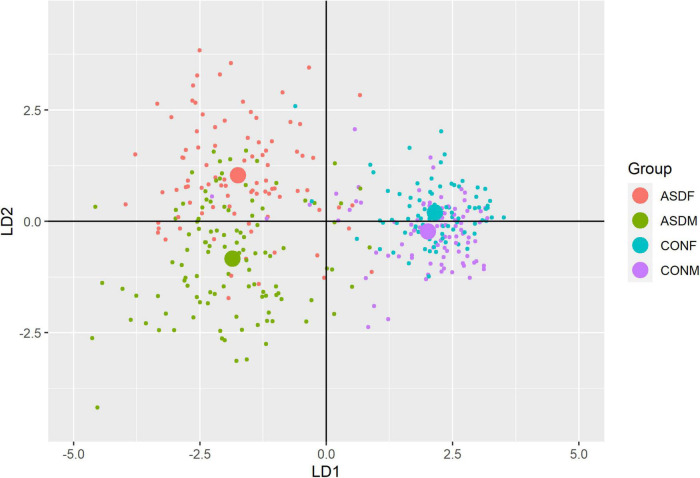
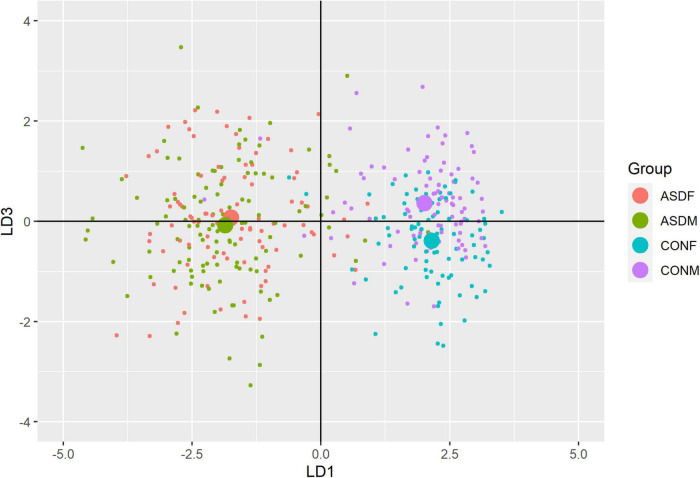
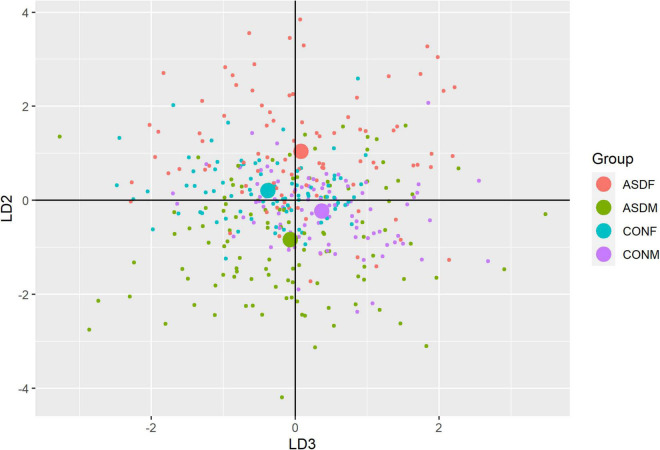
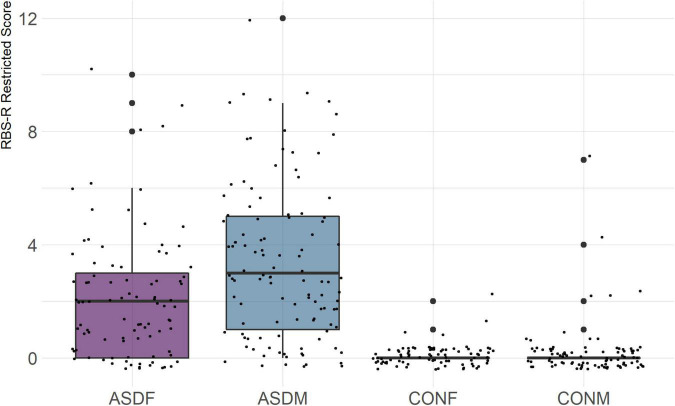
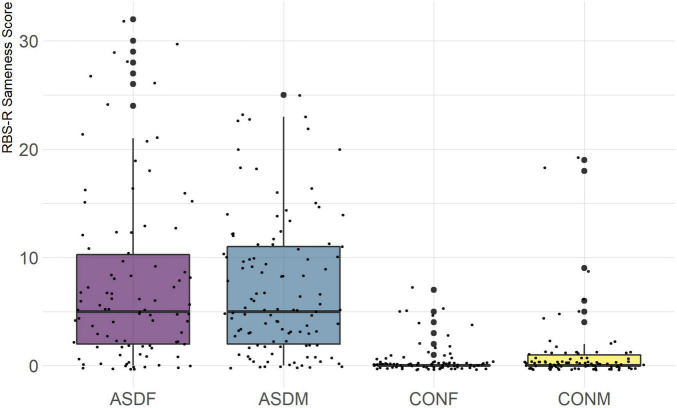
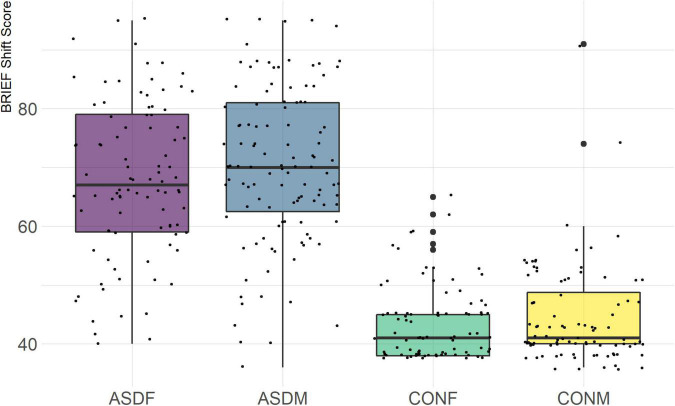
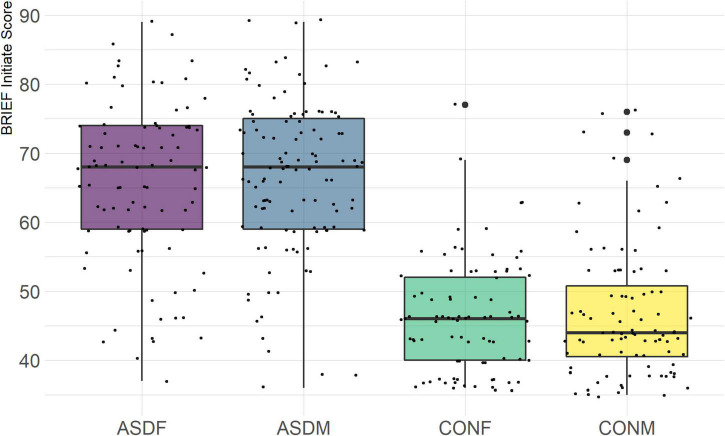
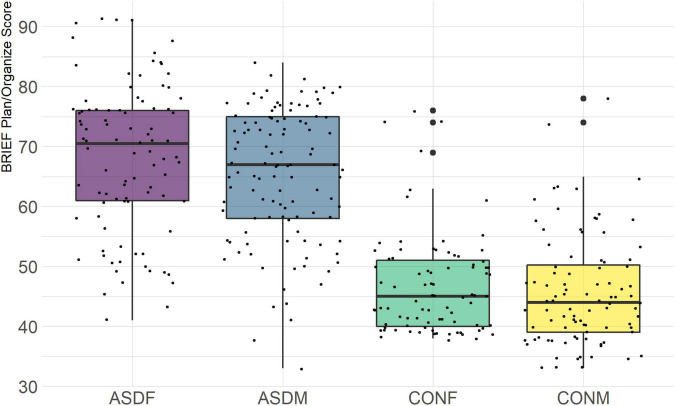
Autism Spectrum Disorder (ASD) is a developmental condition characterized by social and communication differences. Recent research suggests ASD affects 1-in-44 children in the United States. ASD is diagnosed more commonly in males, though it is unclear whether this diagnostic disparity is a result of a biological predisposition or limitations in diagnostic tools, or both. One hypothesis centers on the 'female protective effect,' which is the theory that females are biologically more resistant to the autism phenotype than males. In this examination, phenotypic data were acquired and combined from four leading research institutions and subjected to multivariate linear discriminant analysis. A linear discriminant model was trained on the training set and then deployed on the test set to predict group membership. Multivariate analyses of variance were performed to confirm the significance of the overall analysis, and individual analyses of variance were performed to confirm the significance of each of the resulting linear discriminant axes. Two discriminant dimensions were identified between the groups: a dimension separating groups by the diagnosis of ASD (LD1: 87% of variance explained); and a dimension reflective of a diagnosis-by-sex interaction (LD2: 11% of variance explained). The strongest discriminant coefficients for the first discriminant axis divided the sample in domains with known differences between ASD and comparison groups, such as social difficulties and restricted repetitive behavior. The discriminant coefficients for the second discriminant axis reveal a more nuanced disparity between boys with ASD and girls with ASD, including executive functioning and high-order behavioral domains as the dominant discriminators. These results indicate that phenotypic differences between males and females with and without ASD are identifiable using parent report measures, which could be utilized to provide additional specificity to the diagnosis of ASD in female patients, potentially leading to more targeted clinical strategies and therapeutic interventions. The study helps to isolate a phenotypic basis for future empirical work on the female protective effect using neuroimaging, EEG, and genomic methodologies.
Keywords: autism spectrum disorder; classification; diagnostic; multivariate statistics; phenotypic analysis.
Copyright © 2022 Jacokes, Jack, Sullivan, Aylward, Bookheimer, Dapretto, Bernier, Geschwind, Sukhodolsky, McPartland, Webb, Torgerson, Eilbott, Kenworthy, Pelphrey, Van Horn and The GENDAAR Consortium.
Conflict of interest statement
The authors declare that the research was conducted in the absence of any commercial or financial relationships that could be construed as a potential conflict of interest.
Figures
References
-
- Achenbach T. M., Rescorla L. (2000). Manual for the ASEBA preschool forms & profiles: An integrated system of multi-informant assessment. Burlington, VT: ASEBA.
-
- Bodfish J. W., Symons F. J., Parker D. E., Lewis M. H. (2014). Repetitive behavior scale–revised. Washington, DC: American Psychological Association.
-
- Christensen D. L., Braun K. V. N., Baio J., Bilder D., Charles J., Constantino J. N., et al. (2018). Prevalence and characteristics of autism spectrum disorder among children aged 8 years - autism and developmental disabilities monitoring network, 11 sites, United States, 2012. MMWR Surveill. Summ. 65 1–23. 10.15585/mmwr.ss6513a1 - DOI - PMC - PubMed
LinkOut - more resources
Full Text Sources