. 2022 Oct 30:2022:9493115.
doi: 10.1155/2022/9493115. eCollection 2022.

Comprehensive Multiomic Analysis Identified TUBA1C as a Potential Prognostic Biological Marker of Immune-Related Therapy in Pan-Cancer

Affiliations

Comprehensive Multiomic Analysis Identified TUBA1C as a Potential Prognostic Biological Marker of Immune-Related Therapy in Pan-Cancer

Yiming Zou et al. Comput Math Methods Med. .

Abstract

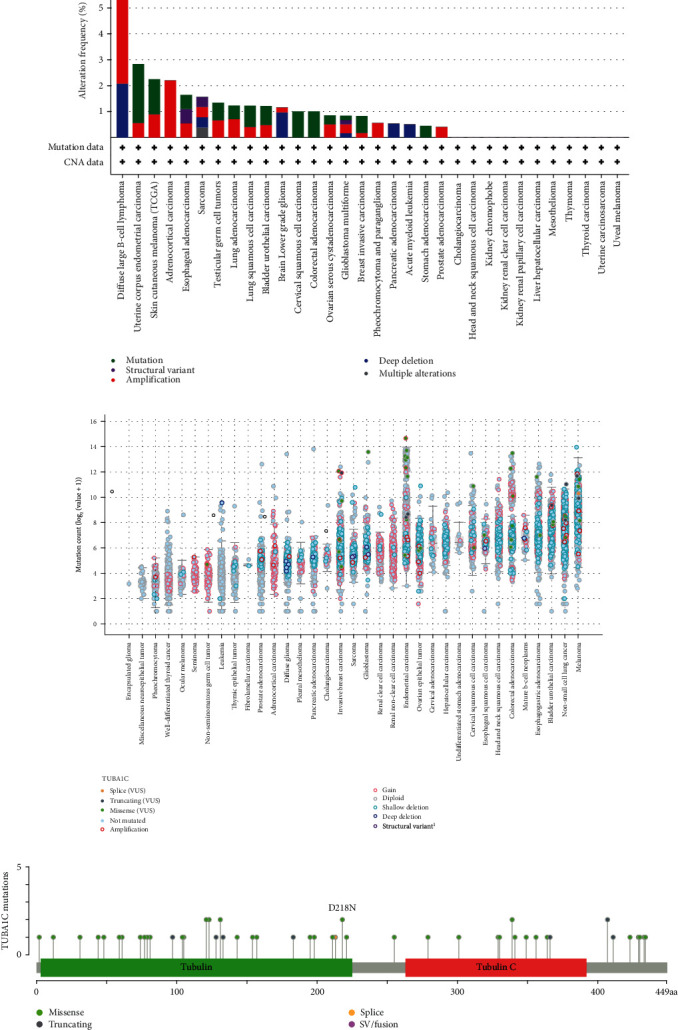
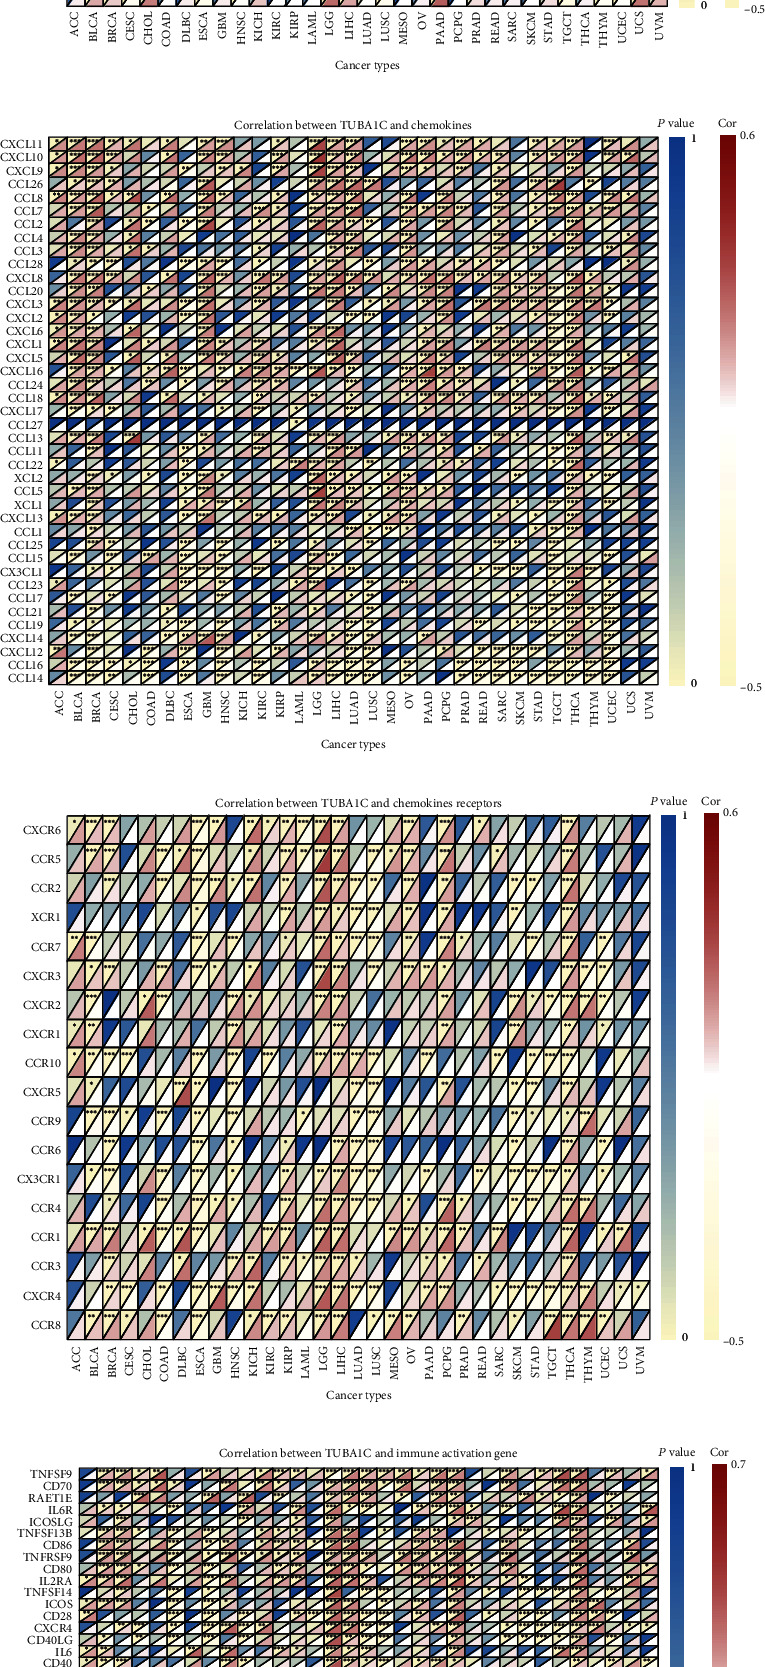
TUBA1C is correlated with an unfavourable prognosis and the infiltration of immune cells in several cancers. However, its function as a significant biomarker for the prognosis of immunotherapy in pan-cancer remains unclear. This study aims at assessing the role of TUBA1C in pan-cancer at multiple levels, including mutations, gene expression, methylation, m6A methylation, and immune cell infiltration levels. Data retrieved from major public databases, such as TCGA, GEO, GTEx, GSCA, CancerSEA, HPA, and RNAactDrugs, revealed that TUBA1C expression was high in 33 cancer types. Survival analysis revealed that TUBA1C was a poor prognostic factor for 12 tumour types, and mutations, CNVs, and methylation affected the prognosis of some cancer types. Furthermore, TUBA1C was found to be related to immune-related genes, immune cell infiltration, and the immune microenvironment. In addition, the sensitivity of 10 anticancer drugs was associated with high TUBA1C expression. Therefore, TUBA1C may serve as a viable prognostic biomarker for immunotherapy of pan-cancer.


Conflict of interest statement

The authors declare no conflicts of interest in this work.

Figures

Figure 1
Figure 1
Flowchart of this study.
Figure 2
Figure 2
Correlation between TUBA1C mRNA expression and the immune microenvironment. (a) Correlation between TUBA1C and immunosuppressive genes. (b) Correlation between TUBA1C mRNA and TMB. (c) Correlation between TUBA1C mRNA and MSI. (d) Correlation between TUBA1C mRNA and MMR-related genes.
Figure 3
Figure 3
Differential expression of TUBA1C mRNA between cancer and normal tissues. (a) Comparison of TUBA1C mRNA expression between cancer and normal tissues based on TCGA database (red represents tumour tissues, and blue represents normal tissues). (b) Differential expression analysis of TUBA1C mRNA in different cancer types using Sangerbox 3.0 based on TCGA and GTEx data (p < 0.05, ∗∗p < 0.01, and ∗∗∗p < 0.001).
Figure 4
Figure 4
Correlation between TUBA1C mRNA and survival in pan-cancer based on TCGA and GEO data. (a–h): (a) OS curves for BRCA, (b) KIRC, (c) LAML, (d) LGG, (e) LIHC, (f) LUAD, (g) MESO, and (h) SKCM.
Figure 5
Figure 5
Cox regression analysis was performed to examine the correlation between OS and TUBA1C expression in 33 cancer types in TCGA database. OS: overall survival.
Figure 6
Figure 6
TUBA1C protein expression in tumour and normal tissues based on TCGA and GTEx data. (a) TUBA1C is mainly expressed in the cytoplasm and cell membrane. (b–f) The protein expression profile of TUBA1C in tumour and normal tissues.
Figure 7
Figure 7
TUBA1C mutation analysis in pan-cancer using cBioPortal. (a) The mutation frequency of TUBA1C in different cancers. (b) The mutation count of TUBA1C in different cancers. (c) The mutation sites of TUBA1C.
Figure 8
Figure 8
CNV analysis of TUBA1C in pan-cancer using GSCA. (a) The count of deletion, amplification, heterozygous, and homozygous CNVs for TUBA1C in different tumours. (b) Correlation between the CNVs and mRNA expression of TUBA1C in different tumours. (c) Differences in survival between patients with wild-type TUBA1C and TUBA1C CNVs in pan-cancer.
Figure 9
Figure 9
GSCA-based study on TUBA1C methylation and m6A-related genes in pan-cancer. (a) Differences in TUBA1C methylation among different cancer types. (b) Differences in overall survival between high- and low-methylation samples in each cancer type. (c) Correlation between methylation and mRNA expression in different cancer types. (d) Correlation between m6A-related genes and TUBA1C mRNA in different cancer types.
Figure 10
Figure 10
Correlation between TUBA1C mRNA expression and the immune microenvironment. (a) Correlation between TUBA1C and MHC-related genes. (b) Correlation between TUBA1C and chemokines. (c) Correlation between TUBA1C and chemokine receptors. (d) Correlation between TUBA1C and immune activation genes.
Figure 11
Figure 11
The relationship between TUBA1C mRNA and the immunological microenvironment. (a–b) Four cancer types with the highest immune scores (LGG, GBM, THCA, and ESCA). (e–h) Four cancer types with the highest interstitial scores (LGG, GBM, TGCT, and PCPG).
Figure 12
Figure 12
Correlation between TUBA1C and the infiltration of CD4+ T cells and MDSCs. MDSCs: myeloid-derived suppressor cells. (a) TUBA1C was positively correlated with the infiltration of CD4+ T cells and MDSCs in different cancer types. (b) TUBA1C expression had the strongest correlation with the infiltrating levels of CD4+ T cells in THYM, BRCA, LUAD, and MESO. (c) TUBA1C expression had the strongest correlation with the infiltrating levels of MDSCs in LUAD, LIHC, BLCA, and PAAD.
Figure 13
Figure 13
Pathway analysis of TUBA1C in pan-cancer based on GSCA and CancerSEA databases. (a) TUBA1C is associated with various functional states in most cancers. (b) Functions of the TUBA family in pan-cancer-related pathways.

Similar articles

Cited by

References

    1. Albande M. A. H., Zhang P., Zhang Q. Q., Li G. Q., Wang W. L. Upregulated expression of TUBA1C predicts poor prognosis and promotes oncogenesis in pancreatic ductal adenocarcinoma via regulating the cell cycle. Frontiers in Oncology . 2020;10 doi: 10.3389/fonc.2020.00049. - DOI - PMC - PubMed
    1. Xu X. H., Ban Y. C., Zhao Z. L., Pan Q. C., Zou J. Y. MicroRNA-1298-3p inhibits proliferation and invasion of glioma cells by downregulating nidogen-1. Aging (Albany NY) . 2020;12(9):7761–7773. doi: 10.18632/aging.103087. - DOI - PMC - PubMed
    1. Nieuwenhuis J., Brummelkamp T. R. The tubulin detyrosination cycle: function and enzymes. Trends in Cell Biology . 2019;29(1):80–92. doi: 10.1016/j.tcb.2018.08.003. - DOI - PubMed
    1. Roll-Mecak A. The tubulin code in microtubule dynamics and information encoding. Developmental Cell . 2020;54(1):7–20. doi: 10.1016/j.devcel.2020.06.008. - DOI - PMC - PubMed
    1. Boggs A. E., Vitolo M. I., Whipple R. A., et al. α-Tubulin acetylation elevated in metastatic and basal-like breast cancer cells promotes microtentacle formation, adhesion, and invasive migration. Cancer Research . 2015;75(1):203–215. doi: 10.1158/0008-5472.CAN-13-3563. - DOI - PMC - PubMed