. 2022 Nov 17:13:1050574.
doi: 10.3389/fmicb.2022.1050574. eCollection 2022.

Bacterial, fungal, and interkingdom microbiome features of exclusively breastfeeding dyads are associated with infant age, antibiotic exposure, and birth mode

Affiliations

Bacterial, fungal, and interkingdom microbiome features of exclusively breastfeeding dyads are associated with infant age, antibiotic exposure, and birth mode

Timothy Heisel et al. Front Microbiol. .

Abstract

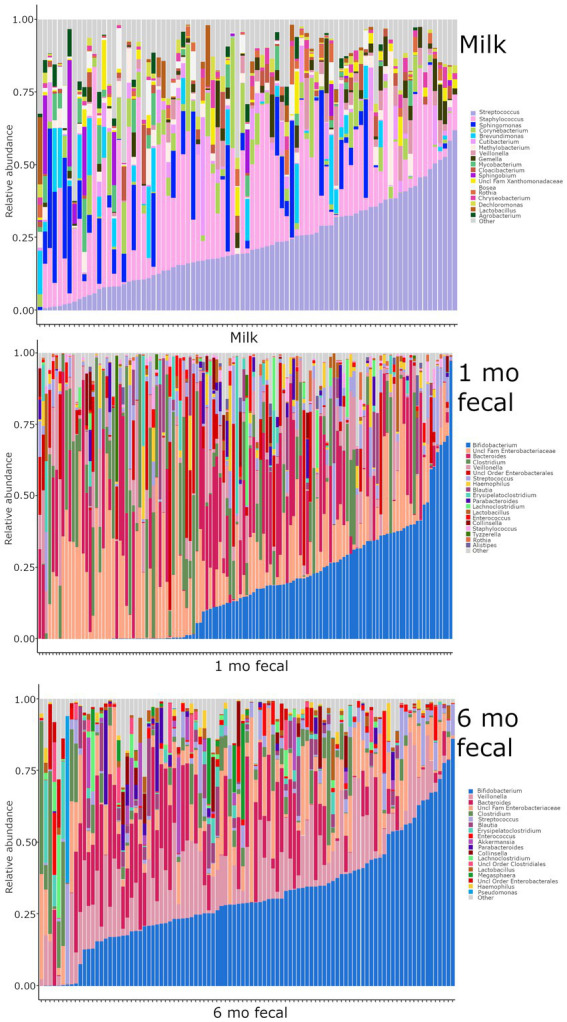
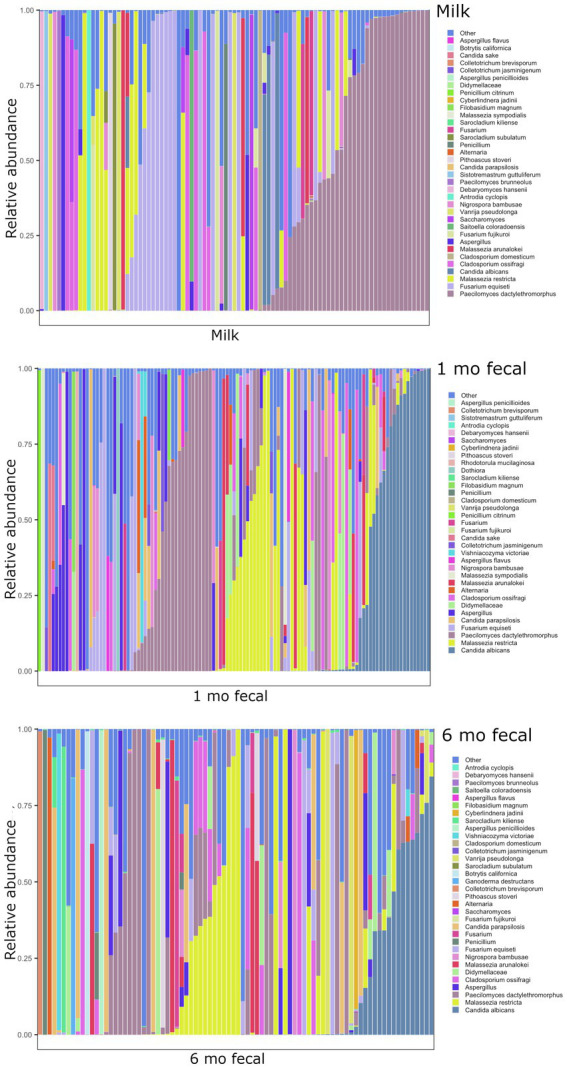
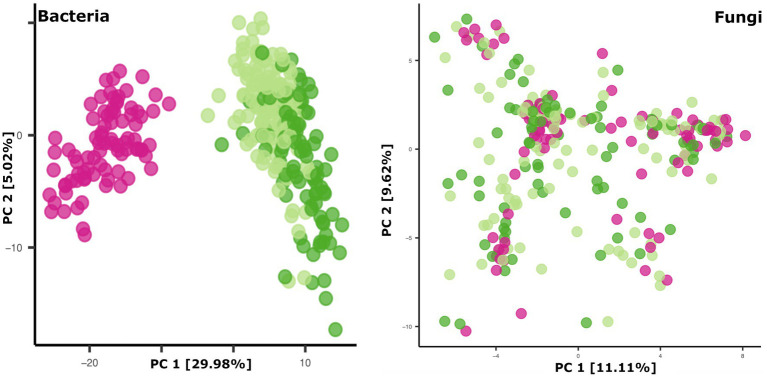
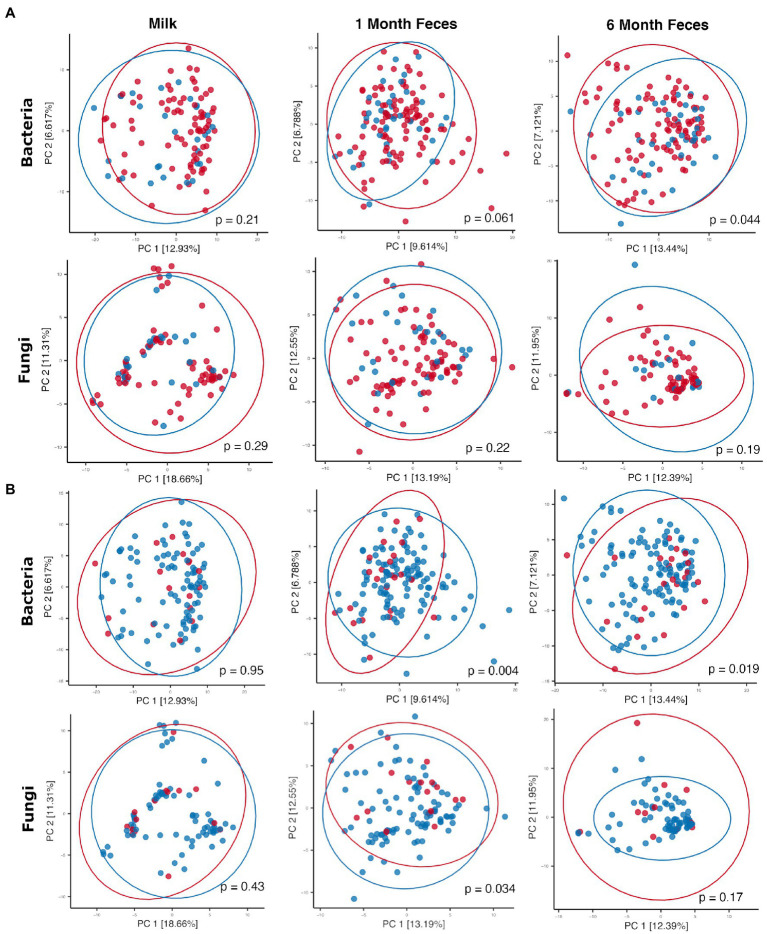
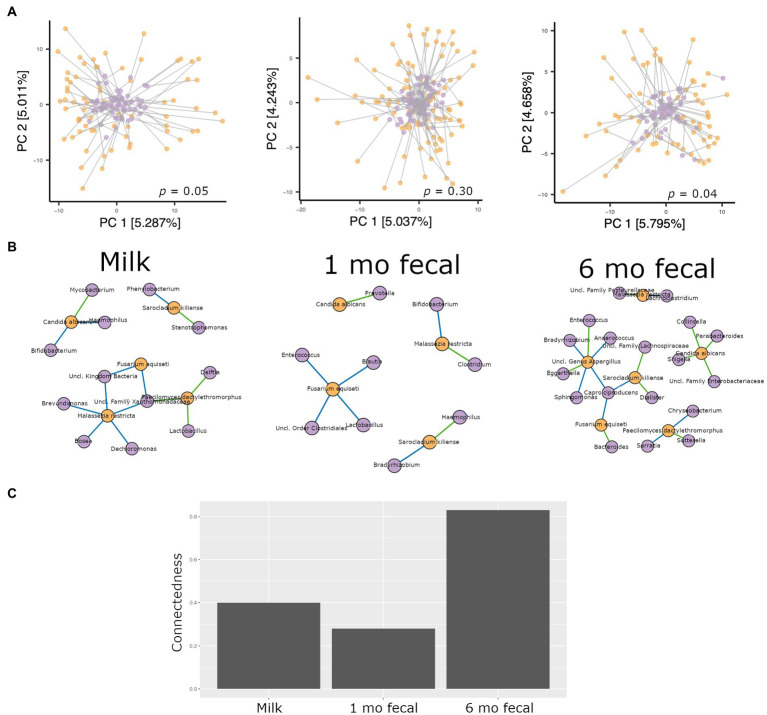
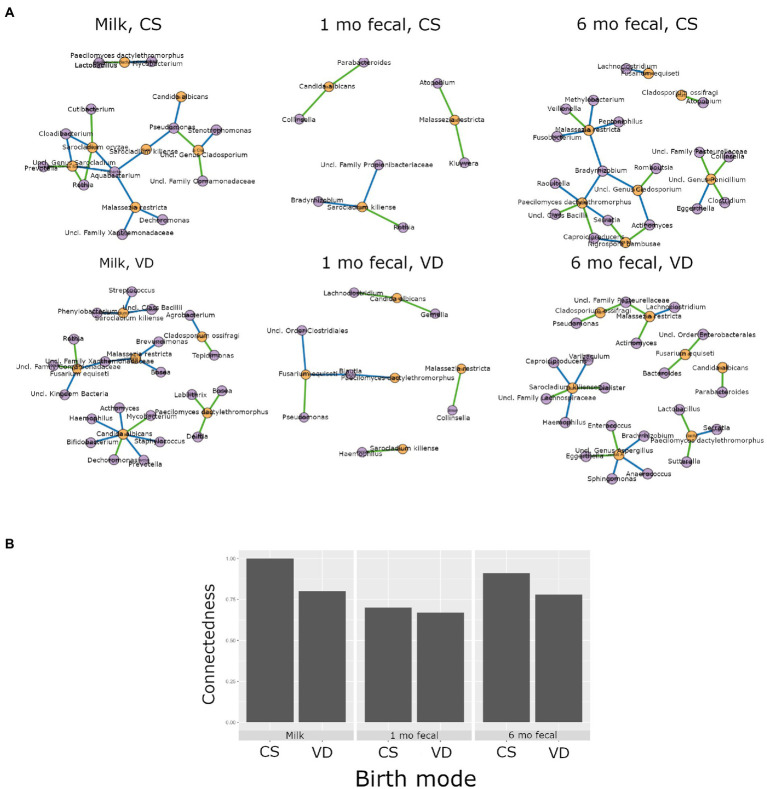
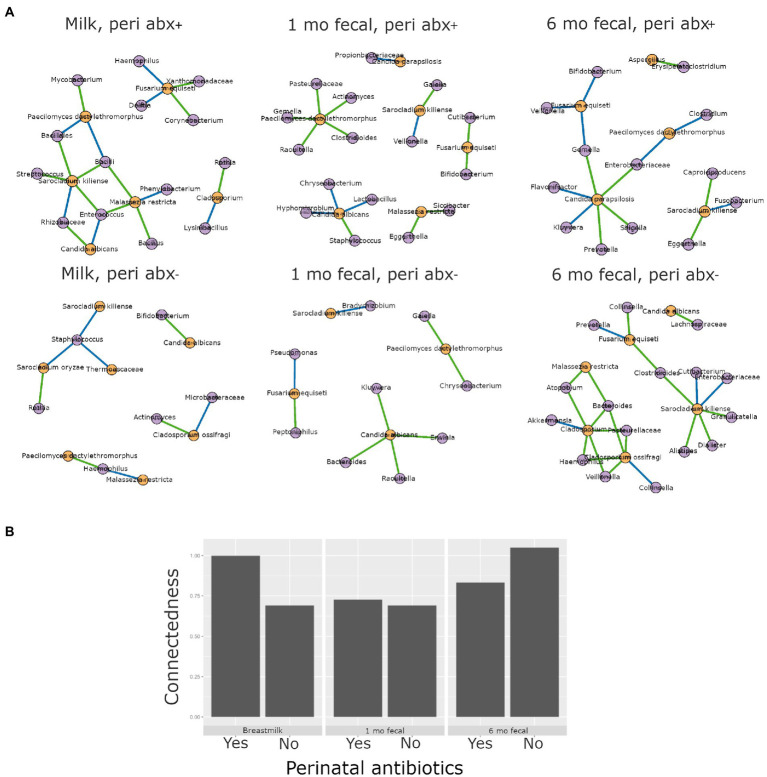
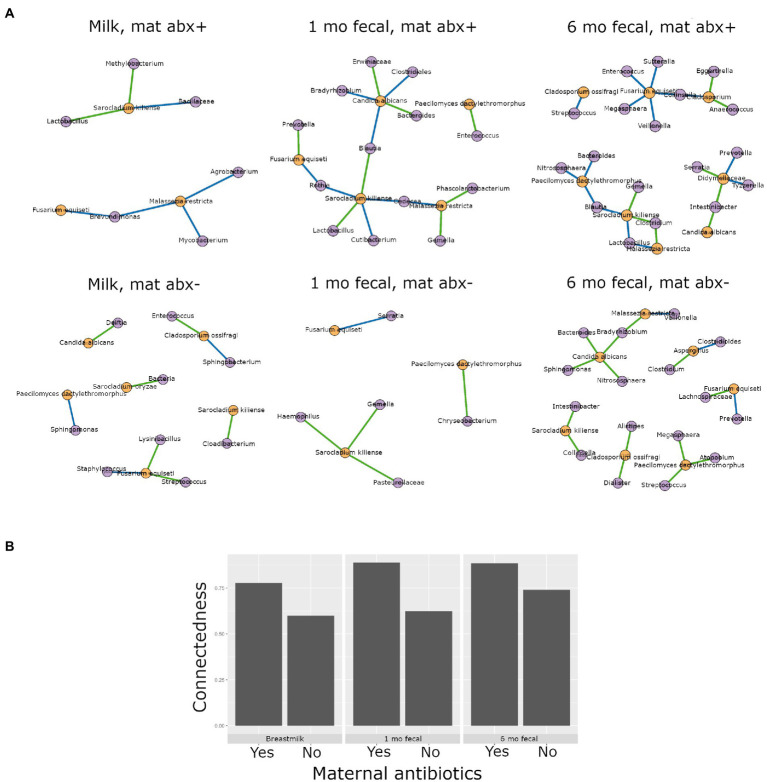
The composition and function of early life gut bacterial communities (microbiomes) have been proposed to modulate health for the long term. In addition to bacteria, fungi (mycobiomes) also colonize the early life gut and have been implicated in health disorders such as asthma and obesity. Despite the potential importance of mycobiomes in health, there has been a lack of study regarding fungi and their interkingdom interactions with bacteria during infancy. The goal of this study was to obtain a more complete understanding of microbial communities thought to be relevant for the early life programming of health. Breastmilk and infant feces were obtained from a unique cohort of healthy, exclusively breastfeeding dyads recruited as part of the Mothers and Infants Linked for Healthy Growth (MILk) study with microbial taxa characterized using amplicon-based sequencing approaches. Bacterial and fungal communities in breastmilk were both distinct from those of infant feces, consistent with niche-specific microbial community development. Nevertheless, overlap was observed among sample types (breastmilk, 1-month feces, 6-month feces) with respect to the taxa that were the most prevalent and abundant. Self-reported antibacterial antibiotic exposure was associated with micro- as well as mycobiome variation, which depended upon the subject receiving antibiotics (mother or infant), timing of exposure (prenatal, peri- or postpartum), and sample type. In addition, birth mode was associated with bacterial and fungal community variation in infant feces, but not breastmilk. Correlations between bacterial and fungal taxa abundances were identified in all sample types. For infant feces, congruency between bacterial and fungal communities was higher for older infants, consistent with the idea of co-maturation of bacterial and fungal gut communities. Interkingdom connectedness also tended to be higher in older infants. Additionally, higher interkingdom connectedness was associated with Cesarean section birth and with antibiotic exposure for microbial communities of both breastmilk and infant feces. Overall, these results implicate infant age, birth mode, and antibiotic exposure in bacterial, fungal and interkingdom relationship variation in early-life-relevant microbiomes, expanding the current literature beyond bacteria.

Keywords: bacteria; breastmilk; fungi; infant gut; interkingdom interactions; microbial community variation; microbiome; mycobiome.


Conflict of interest statement

The authors declare that the research was conducted in the absence of any commercial or financial relationships that could be construed as a potential conflict of interest.

Figures

Figure 1
Figure 1
Relative abundances of bacterial taxa within each sample type. Each bar represents an individual sample, and samples are ordered by subject. “Other” represents taxa whose relative abundance is minimal as compared to the taxa included on the plot. Samples: n = 85 for breastmilk, 124 for 1-month feces, and 97 for 6-month feces.
Figure 2
Figure 2
Relative abundances of fungal taxa within each sample type. Each bar represents an individual sample, and samples are ordered by subject. “Other” represents taxa whose relative abundance is minimal as compared to the taxa included on the plot. Samples: n = 91 for breastmilk, 115 for 1-month feces, and 84 for 6-month feces.
Figure 3
Figure 3
Principal coordinates plots of microbial beta diversity in breastmilk (pink dots), 1-month feces (light green dots), and 6-month feces (dark green dots). Bacterial community data points (left panel): n = 85 for breastmilk, 124 for 1-month feces, and 97 for 6-month feces. Fungal community data points (right panel): n = 91 for breastmilk, 115 for 1-month feces, and 84 for 6-month feces.
Figure 4
Figure 4
Principal coordinates plots comparing microbial communities by (A) perinatal antibiotic exposure (red dots = no exposure, blue dots = positive exposure) and (B) birth mode (red dots = Cesarean section, blue dots = vaginal birth). Ellipses indicate normal probability contours. For A, bacterial community data points (top row): n = 84 for breastmilk, n = 122 for 1-month feces, and n = 95 for 6-month feces; fungal community data points (bottom row): n = 90 for breastmilk, n = 112 for 1-month feces, and n = 83 for 6-month feces. For B, bacterial community data points (top row): n = 84 for breastmilk, n = 122 for 1-month feces, and n = 95 for 6-month feces; fungal community data points (bottom row): n = 90 for breastmilk, n = 112 for 1-month feces, and n = 83 for 6-month feces.
Figure 5
Figure 5
Analyses of interkingdom relationships in breastmilk (left panels), 1- and 6-month feces (middle and right panels, respectively). (A) Procrustes analysis comparing the spatial fit of unweighted Unifrac principal coordinate matrices of bacterial communities (purple spheres) and Bray-Curtis principal coordinate matrices of fungal communities (orange spheres) for each sample type. Breastmilk n = 75, 1-month feces n = 100, 6-month feces n = 69. (B) Interkingdom network maps of interactions between bacterial (purple spheres) and fungal (orange spheres) taxa by sample type (Breastmilk n = 75, 1-month feces n = 100, 6-month feces n = 69. Blue line, negative correlation; green line, positive correlation. (C) Interkingdom connectedness values (see Methods) for each sample type.
Figure 6
Figure 6
Interkingdom relationship comparisons by birth mode. Panels in A are interkingdom network maps of significant interactions between bacterial (purple) and fungal (orange) taxa and are organized by sample type. Blue line, negative correlation; green line, positive correlation. Plot in B is of interkingdom connectedness values (see Methods) by sample type. Sample n’s included in network analyses for Cesarean section delivery (CS, top row): breastmilk 12, 1-month feces 15, 6-month feces, 9 and for Vaginal delivery (VD, bottom row): breastmilk 62, 1-month feces 83, 6-month feces 59.
Figure 7
Figure 7
Interkingdom relationship comparisons by perinatal antibiotic exposure. Panels in A are interkingdom network maps of significant interactions between bacterial (purple) and fungal (orange) taxa and are organized by sample type. Blue line, negative correlation; green line, positive correlation. Plot in B is of interkingdom connectedness values (see Methods) by sample type. Sample n’s included in network analyses for Perinatal antibiotic-exposed (peri abx +, top row): breastmilk 19, 1-month feces 26, 6-month feces 18 and for Perinatal antibiotics unexposed (peri abx -, bottom row): breastmilk 55, 1-month feces 72, 6-month feces 62.
Figure 8
Figure 8
Interkingdom relationship comparisons by maternal postpartum antibiotic exposure. Panels in A are interkingdom network maps of significant interactions between bacterial (purple) and fungal (orange) taxa and are organized by sample type. Blue line, negative correlation; green line, positive correlation. Plot in B is of interkingdom connectedness values (see Methods) by sample type. Sample n’s included in network analyses for Maternal postpartum antibiotic exposed (mat abx +, top row): breastmilk 15, 1-month feces 24, 6-month feces 13 and for Maternal postpartum antibiotic unexposed (mat abx -, bottom row): breastmilk 60, 1-month feces 76, 6-month feces 69.

References

    1. Ajslev T. A., Andersen C. S., Gamborg M., Sørensen T. I. A., Jess T. (2011). Childhood overweight after establishment of the gut microbiota: the role of delivery mode, pre-pregnancy weight and early administration of antibiotics. Int. J. Obes. 35, 522–529. doi: 10.1038/ijo.2011.27 - DOI - PubMed
    1. Al-Ghalith G., Knights D. (2020). github.com/ knights-lab/BURST: BURST v1.00.
    1. Al-Ghalith G. A., Hillmann B., Ang K., Shields-Cutler R., Knights D. (2018). SHI7 is a self-learning pipeline for multipurpose short-read DNA quality control. mSystems 3, e00202–e00217. doi: 10.1128/mSystems.00202-17 - DOI - PMC - PubMed
    1. Aloisio I., Quagliariello A., De Fanti S., Luiselli D., De Filippo C., Albanese D., et al. . (2016). Evaluation of the effects of intrapartum antibiotic prophylaxis on newborn intestinal microbiota using a sequencing approach targeted to multi hypervariable 16S rDNA regions. Appl. Microbiol. Biotechnol. 100, 5537–5546. doi: 10.1007/s00253-016-7410-2 - DOI - PubMed
    1. Arrieta M.-C., Stiemsma L. T., Dimitriu P. A., Thorson L., Russell S., Yurist-Doutsch S., et al. . (2015). Early infancy microbial and metabolic alterations affect risk of childhood asthma. Sci. Transl. Med. 7:307ra152. doi: 10.1126/scitranslmed.aab2271 - DOI - PubMed

LinkOut - more resources