. 2022 Nov 18:13:1054962.
doi: 10.3389/fimmu.2022.1054962. eCollection 2022.

Cellular stress modulates severity of the inflammatory response in lungs via cell surface BiP

Affiliations

Cellular stress modulates severity of the inflammatory response in lungs via cell surface BiP

Gustavo Rico-Llanos et al. Front Immunol. .

Abstract

Inflammation is a central pathogenic feature of the acute respiratory distress syndrome (ARDS) in COVID-19. Previous pathologies such as diabetes, autoimmune or cardiovascular diseases become risk factors for the severe hyperinflammatory syndrome. A common feature among these risk factors is the subclinical presence of cellular stress, a finding that has gained attention after the discovery that BiP (GRP78), a master regulator of stress, participates in the SARS-CoV-2 recognition. Here, we show that BiP serum levels are higher in COVID-19 patients who present certain risk factors. Moreover, early during the infection, BiP levels predict severe pneumonia, supporting the use of BiP as a prognosis biomarker. Using a mouse model of pulmonary inflammation, we observed increased levels of cell surface BiP (cs-BiP) in leukocytes during inflammation. This corresponds with a higher number of neutrophiles, which show naturally high levels of cs-BiP, whereas alveolar macrophages show a higher than usual exposure of BiP in their cell surface. The modulation of cellular stress with the use of a clinically approved drug, 4-PBA, resulted in the amelioration of the lung hyperinflammatory response, supporting the anti-stress therapy as a valid therapeutic strategy for patients developing ARDS. Finally, we identified stress-modulated proteins that shed light into the mechanism underlying the cellular stress-inflammation network in lungs.

Keywords: 4-PBA; COVID-19; TNFa; acute respiratory distress syndrome; binding-immunoglobulinprotein (BiP/GRP78/HSPA5); cell surface GRP78 (csGRP78); cellular stress; cytokine storm.


Conflict of interest statement

ID and FC declare a patent application for the use of 4-PBA to treat respiratory insufficiency P-585531-EP. The remaining authors declare that the research was conducted in the absence of any commercial or financial relationships that could be construed as a potential conflict of interest.

Figures

Figure 1
Figure 1
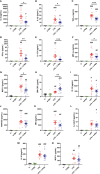
Serum BiP levels are increased in certain groups of COVID-19 patients. (A–L) Serum BiP levels classified by group of patients/donors. Black lines and whiskers denote the mean ± SEM of every data set. Green areas represent normal BiP levels in serum (0 and 181 pg/mL, respectively) defined between 5th and 95th percentiles of healthy donor’s data set. General BiP levels in total cohort: healthy control patients (n=30) versus COVID-19 patients (n=194) (A); BiP levels classified by Sex (B), Age (C), and previous comorbidities (D–H). (I) Serum BiP in patients classified by pneumonia severity in 5 levels depending on oxygen saturation, Tachypnea and need for mechanic ventilation. (J) BiP levels analyzed by radiological presence of pneumonia pulmonary consolidations developed during COVID-19. (K) Stacked bar plot showing percentage of patients with BiP levels below or above the selected critical threshold (300 pg/mL) who developed severe pneumonia (denoted by color code in legend). (L) Scatter plot showing a positive correlation between BiP levels versus IL-6 levels in blood serum tested by Pearson’s correlation coefficient. (M) BiP levels analyzed by Brescia-COVID Respiratory Severity Scale. (N) BiP levels analyzed by application of Tozilizumab treatment. *P < 0.05, **P < 0.01, ***P < 0.001 indicate statistical significant differences between indicated samples for a Two-Tailed unpaired t-Test (A–H, J, N), One-Way ANOVA with a Tukey’s multiple comparisons test (I, M) and Chi-square test (K).
Figure 2
Figure 2
Bronchoalveolar cytokine profile after LPS challenge and 4-PBA treatment in ARDS model. (A–N) Levels of cytokines IL-6, IL-1β, TNF-α, IFN-γ, IL-17A, MIP-1α, MCP-3, GM-CSF, IP-10, RANTES, MIG, IL-12p70, IL-18 and MCP-1 in BALF from mice challenged with LPS without 4-PBA treatment (LPS, n=14, graphed in red) and with 4-PBA treatment (LPS + 4-PBA, n=15, graphed in blue). Groups of unchallenged mice without 4-PBA (C-, n=6, graphed in black) and with 4-PBA treatment (4-PBA, n=9; graphed in green) were also evaluated. Colored lines and whiskers denote mean ± SEM for every data set. Hash marks indicate significant difference versus non-LPS challenge conditions (# P < 0.05, ## P < 0.01, ### P < 0.001) and a straight line between LPS and LPS + 4-PBA (*P < 0.05, **P < 0.01, ***P < 0.001) by Two-way ANOVA followed by Tukey’s post-hoc test.
Figure 3
Figure 3
BiP levels correlate with ARDS severity. (A) BiP levels in BALF from control mice, 4-PBA treatment, challenged with LPS with and without 4-PBA treatment. Colored lines and whiskers denote mean ± SEM for every data set. Hash marks indicate significant difference versus non-LPS challenge conditions (# P < 0.05) and a straight line between LPS and LPS + 4-PBA (*P < 0.05, **P < 0.01) by Two-way ANOVA followed by Tukey’s post-hoc test. (B) Heatmap showing levels for all measured cytokines for every single mouse (In the X axis: C = C-; P = 4-PBA; L = LPS and LP = LPS + 4- PBA with numbers indicating replicate number). Normalized cytokine values are depicted on a low-to-high scale (green-black-red). (C) Severity Index calculated as an average of normalized values for all cytokine by every single animal. Values near to 1 indicate more severe outcome whereas values tendent to zero a milder response. Colored lines and whiskers denote mean ± SEM for every data set. Hash marks indicate significant difference versus non-LPS challenge conditions (### P < 0.001) and a straight line between LPS and LPS + 4-PBA by Two-way ANOVA followed by Tukey’s post-hoc test. (D) Scatter plot showing a positive correlation between BiP levels in mice BALF and the calculated Severity Index tested by Pearson’s correlation coefficient.
Figure 4
Figure 4
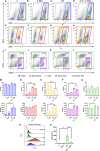
Cell surface BiP levels in immune lineages during the hyperinflammatory response. (A–D) Representative flow cytometry plots for CD45+ cells in blue squares. (E–H) Neutrophils are defined as CD45+ Ly6G+ in red squares. (I–L) Among the CD45+ Ly6G- population in yellow squares, we defined alveolar macrophages and DCs (CD45+ Ly6G- CD11c+) in green squares and monocytes as well as other myeloid phenotypes (CD45+ Ly6G- CD11b+ CD11c-/low) in purple squares (n=3 mice per group, n=2 for “4-PBA” group). (M–Q) Percentage of gated cells and cell surface BiP levels measured by Median Fluorescence Intensity (MFI) of tagged csBiP antibody are represented in bar plots for every defined population. (R, S) Histogram graph show the intensity distribution of CD11b marker among Alveolar Mφ population (R) also represented as the average of its correspondent MFI in a bar plot (S). All bar plots show mean ± SD for every treatment into the defined population. *P < 0.05, **P < 0.01, ***P < 0.001 indicate statistically significant differences versus C- samples for a One-Way ANOVA with a Tukey’s multiple comparisons test.
Figure 5
Figure 5
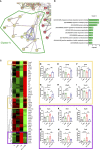
Differentially expressed proteins group as UPR/ER stress and inflammatory clusters linked by BiP and Ripk1. (A) StringDB network showing the associations between proteins differentially expressed in response to LPS challenge in mice lungs forming a cluster detected by an unsupervised Markov Cluster Algorithm (MCL). (B) Bar plots showing the Top-10 enriched Biological Processes associated with this cluster ordered by False Discovery Rate. Every single bar indicates the number of proteins associated with every GO-term. (C) Hierarchical clustered heatmap showing relative quantities of the 51 proteins expressed differentially in “LPS” group versus “LPS + 4-PBA” group. (D–O) Proteins with decreased (D-I, yellow squares) or increased (J–O, purple squares) levels after LPS challenge and that were rescued to normal levels after 4-PBA treatment. Bar plots show in detail the mean ± SD by treatment for every one of those highlighted proteins. *P < 0.05, **P < 0.01, ***P < 0.001 indicate statistically significant differences between samples linked with a straight line for a One-Way ANOVA with a Tukey’s multiple comparisons test (n=4 for C-, 4-PBA and LPS + 4-PBA groups; n=3 for LPS group).

References

    1. Huang C, Wang Y, Li X, Ren L, Zhao J, Hu Y, et al. . Clinical features of patients infected with 2019 novel coronavirus in wuhan, China. Lancet (2020) 395(10223):497–506. doi: 10.1016/S0140-6736(20)30183-5 - DOI - PMC - PubMed
    1. Mehta P, McAuley DF, Brown M, Sanchez E, Tattersall RS, Manson JJ, et al. . COVID-19: consider cytokine storm syndromes and immunosuppression. Lancet (London England). (2020) 395(10229):1033–4. doi: 10.1016/S0140-6736(20)30628-0 - DOI - PMC - PubMed
    1. Que Y, Hu C, Wan K, Hu P, Wang R, Luo J, et al. . Cytokine release syndrome in COVID-19: a major mechanism of morbidity and mortality. Int Rev Immunol (2022) 41(2):217–30. doi: 10.1080/08830185.2021.1884248 - DOI - PMC - PubMed
    1. Bassetti M, Vena A, Giacobbe DR. The novel Chinese coronavirus (2019-nCoV) infections: Challenges for fighting the storm - bassetti. Eur J Clin Invest (2020) 50(3):e13209. doi: 10.1111/eci.13209 - DOI - PMC - PubMed
    1. Epidemiological and clinical characteristics of 99 cases of 2019 novel coronavirus pneumonia in wuhan, China: a descriptive study - the lancet . Available at: https://www.thelancet.com/journals/lancet/article/PIIS0140-6736(20)30211.... - PMC - PubMed

Publication types

Substances