. 2022 Nov 18:13:1008695.
doi: 10.3389/fimmu.2022.1008695. eCollection 2022.

Differential diagnosis and identification of prognostic markers for peripheral T-cell lymphoma subtypes based on flow cytometry immunophenotype profiles

Affiliations

Differential diagnosis and identification of prognostic markers for peripheral T-cell lymphoma subtypes based on flow cytometry immunophenotype profiles

Qiyao Pu et al. Front Immunol. .

Abstract

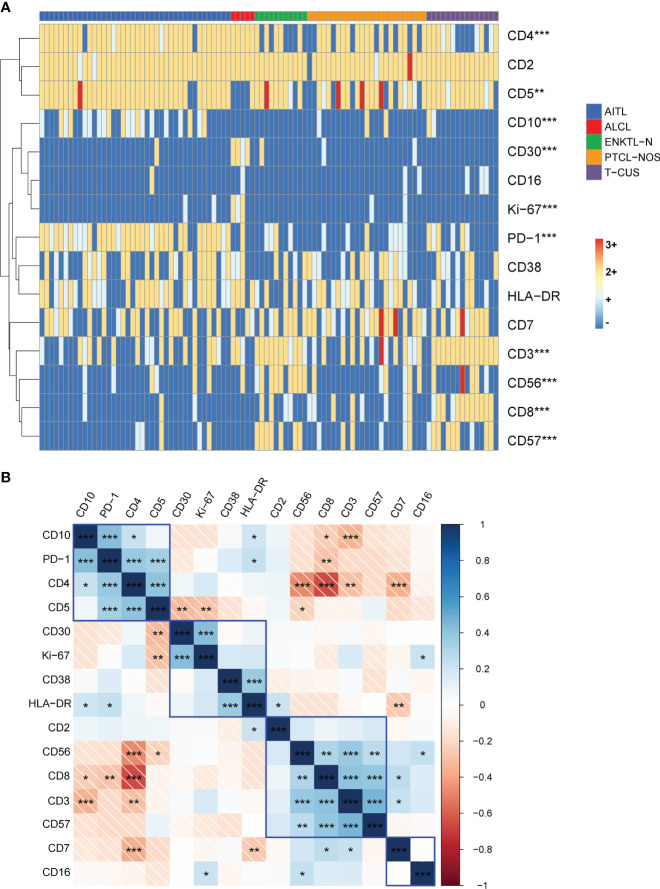
We compared the differential expression of 15 markers in PTCL (Peripheral T-cell lymphoma) subtypes and T-CUS (T-cell clones of uncertain significance), and summarized the specific immunophenotype profiles of each subtype and its impact on prognosis. PD-1 and CD10 are diagnostic markers for AITL (angioimmunoblastic T-cell lymphoma). To avoid confusion with T-CUS of benign clones, it is recommended to define AITL as bounded by PD-1+%>38.01 and/or CD10+%>7.46. T cell-derived ENKTL-N (extranodal NKT cell lymphoma) specifically expresses CD56. ALCL (anaplastic large cell lymphoma) characteristically expresses CD30 and HLA-DR. PTCL-NOS (peripheral T-cell lymphoma unspecified) still lacks a relatively specific phenotype and is prone to loss of basic lineage markers CD3, CD5, and CD7. The determination of T-CUS can be verified by the overall assessment of the bone marrow and a certain period of follow-up. The clustering results showed that the expression of 8 specific markers was significantly different among the 5 groups, suggesting that a combination of related markers can be analyzed in the identification of PTCLs subtypes. The study explores the advantages of TRBC1 combined with CD45RA/CD45RO in detecting T cell clonality, which can efficiently and sensitively analyze multiple target T cell populations at the same time. The sensitivity of PB to replace BM to monitor the tumor burden or MRD (minimal residual disease) of PTCLs is as high as 85.71%, which can relieve the huge pressure of clinical sampling and improve patient compliance. CD7, CD38, and Ki-67 are prognostic indicators for AITL. CD3 and CD8 on PTCL-NOS, and CD56 and HLA-DR on ENKTL-N have prognostic role. This study supports and validates the current classification of PTCL subtypes and establishes an immunophenotypic profile that can be used for precise diagnosis. The important clinical value of PTCLs immunophenotype in routine classification diagnosis, clonality confirmation, prognosis prediction, and treatment target selection was emphasized.

Keywords: AITCL; FCM immunophenotype; T-CUS; differential diagnosis; peripheral T-cell lymphoma; prognostic marker; targeted therapy.


Conflict of interest statement

The authors declare that the research was conducted in the absence of any commercial or financial relationships that could be construed as a potential conflict of interest.

Figures

Figure 1
Figure 1
The classification of peripheral T-cell lymphomas follows the World Health Organization 2017 classification of lymphomas. PTCLs, Peripheral T-cell lymphomas. TFH, follicular helper T-cell; ALK, anaplastic lymphoma kinase; AITL, angioimmunoblastic T-cell lymphoma; PTCL-TFH, follicular helper T-cell lymphoma; PTCL-NOS, peripheral T-cell lymphoma tumor, unspecified; ALCL, anaplastic large cell lymphoma; ENKTL-N, extranodal NKT cell lymphoma. (Only the types included in this study are limited here).
Figure 2
Figure 2
Expression profiles of immune markers for AITL, PTCL-NOS, ENKTL, ALCL, and T-CUS. (A) Proportion of positive expression of each antigen of 4 PTCL subtypes and T-CUS. (B) Antigen expression profiles of 4 PTCLs subtypes and T-CUS. ++, >75% of cases express this antigen; +, 25%-75% of cases express this antigen; ±, 10%-25% of cases express this antigen; -, <10% of cases express this antigen.
Figure 3
Figure 3
Examples of immunophenotypes for AITL, PTCL-NOS, ENKTL-N, ALCL, and T-CUS. (A) Typical FCM immunophenotype of AITL: CD3(-)CD4(+)CD10(+)PD-1(+); (B) Typical FCM immunophenotype of PTCL-NOS: CD2(+)CD4(+) CD7(-); (C) Typical FCM immunophenotype of ENKTL-N: CD3(+)CD56(+); (D) Typical FCM immunophenotype of ALCL: CD30(+)Ki-67(+); (E) Typical immunophenotype of T-CUS: CD3(+)CD8(+). The red dots in the figure are clonal T cells, the purple dots are background normal T cells, and the green dots are NK cells as an internal control.
Figure 4
Figure 4
Immunophenotype-based cluster analysis of AITL, PTCL-NOS, ENKTL-N, ALCL, and T-CUS. (A) 15 immune markers of clonal T cells from patients with AITL (n=40), PTCL-NOS (n=25), ENKTL-N (n=11), ALCL (n=5), and T-CUS (n=15) clustering diagram. The horizontal axis represents individual patients, and the vertical axis represents immune markers. (B) Correlation matrix of immune markers of PTCLs. Pearson correlation matrix analyzes all possible correlations among 15 immune markers. (*p < 0.05, **p < 0.01, ***p < 0.001).
Figure 5
Figure 5
PD-1 and CD10 specificity patterns of AITL. (A) t-SNE map of AITL patients showing the expression pattern of CD3-CD4+PD-1+. Different colors represent different cell clusters. The positions of the red clusters are clonal T cells of AITL. (B) PD-1 expression in AITL, PTCL-NOS, ENKTL-N, ALCL and T-CUS cloned T cells and background normal Th and Tc cells. (C) Histogram of mean PD-1 expression rates in clonal T cells and background normal Th and Tc cells in patients with AITL. (D) Histograms of mean PD-1 expression rates on clonal T cells in patients with AITL, PTCL-NOS, ENKTL-N, ALCL, and T-CUS. (E) Receiver operating characteristic (ROC) curves evaluating PD-1-defined AITL. (F) t-SNE plot of AITL patients showing the expression pattern of CD3-CD4+CD10+. Different colors represent different cell clusters. The positions of the red clusters are clonal T cells of AITL. (G) CD10 expression of AITL, PTCL-NOS, ENKTL-N, ALCL and T-CUS cloned T cells and background normal Th and Tc cells. (H) Histogram of the average expression rate of CD10 in clonal T cells and background normal Th and Tc cells in patients with AITL. (I) Histogram of mean CD10 expression rates in clonal T cells in patients with AITL, PTCL-NOS, ENKTL-N, ALCL and T-CUS. (J) Receiver operating characteristic (ROC) curves evaluating CD10-defined AITL. (*p < 0.05, ****p < 0.0001)
Figure 6
Figure 6
Clonal detection of T cells. (A) The clonality of each target T cell subset was detected by TRBC1. Red scatter points represent clonal T cells, blue scatter points represent background normal Th cells, and yellow scatter points represent background normal Tc cells. (B) Identification of the clonality of each target T cell subset by examining the CD45RA/CD45RO differentiation trajectories. Under normal circumstances, the differentiation trajectories of T cells are scattered and continuous, and under abnormal circumstances, they tend to aggregate into clusters. (C) Validation of T cell subset clonality by TCR-vβ immunophenotype distribution. Clonal T cells are restricted to a single TCRVβ subset (more than 40–50%), or lack expression.
Figure 7
Figure 7
Correlation and homology of clonal T cell burden in BM and PB. (A) The proportion of clonal T cells to lymphocytes in BM and PB showed a positive correlation (p<0.0001). (B) The proportion of clonal T cells occupied nucleated cells in BM and PB showed a positive correlation (p<0.0001). (C) Morphological analysis confirmed that tumor T cells in BM and PB had consistent morphological features [(A), BM; (B), PB; 1000×].
Figure 8
Figure 8
Prognostic markers of PTCLs. (A) Prognostic markers influencing OS of AITL, PTCL-NOS, ENKTL-N. (a–c), OS survival curves of CD7, CD38 and Ki-67 on AITL. (d, e), OS survival curves of CD3 and CD8 on PTCL-NOS. (f), OS survival curve of CD56 versus ENKTL-N. (B) Prognostic markers influencing PFS in AITL and ENKTL-N. (a, b), PFS survival curves of CD7 and CD38 versus AITL. (c, d), PFS survival curves of CD56 and HLA-DR against ENKTL-N.

References

    1. Foss FM, Zinzani PL, Vose JM, Gascoyne RD, Rosen ST, Tobinai K. Peripheral T-cell lymphoma. Blood (2011) 117(25):6756–67. doi: 10.1182/blood-2010-05-231548 - DOI - PubMed
    1. Vose J, Armitage J, Weisenburger D. International peripheral T-cell and natural Killer/T-cell lymphoma study: Pathology findings and clinical outcomes. J Clin Oncol (2008) 26(25):4124–30. doi: 10.1200/jco.2008.16.4558 - DOI - PubMed
    1. Rizvi MA, Evens AM, Tallman MS, Nelson BP, Rosen ST. T-Cell non-Hodgkin lymphoma. Blood (2006) 107(4):1255–64. doi: 10.1182/blood-2005-03-1306 - DOI - PubMed
    1. Mourad N, Mounier N, Brière J, Raffoux E, Delmer A, Feller A, et al. . Clinical, biologic, and pathologic features in 157 patients with angioimmunoblastic T-cell lymphoma treated within the groupe d'etude des lymphomes de l'adulte (Gela) trials. Blood (2008) 111(9):4463–70. doi: 10.1182/blood-2007-08-105759 - DOI - PMC - PubMed
    1. Townsend W, Linch D. Hodgkin's lymphoma in adults. Lancet (2012) 380(9844):836–47. doi: 10.1016/s0140-6736(12)60035-x - DOI - PubMed

Publication types