

Response of immunoglobulin M in gut mucosal immunity of common carp (Cyprinus carpio) infected with Aeromonas hydrophila
- PMID: 36466906
- PMCID: PMC9713697
- DOI: 10.3389/fimmu.2022.1037517
Response of immunoglobulin M in gut mucosal immunity of common carp (Cyprinus carpio) infected with Aeromonas hydrophila
Abstract
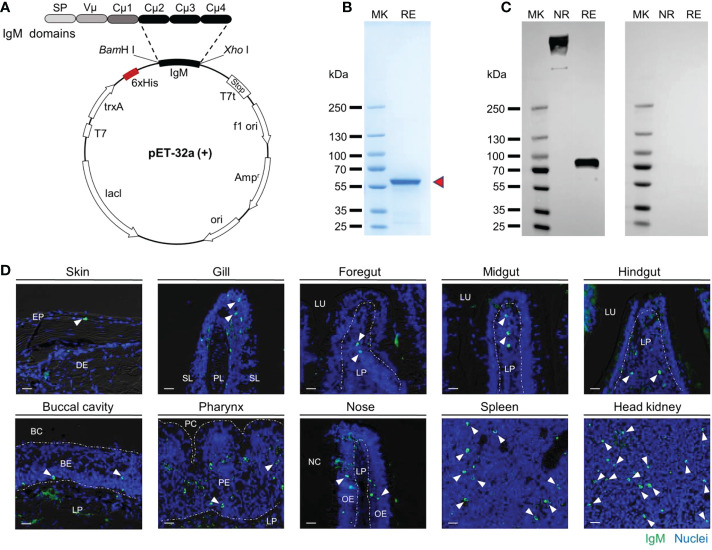
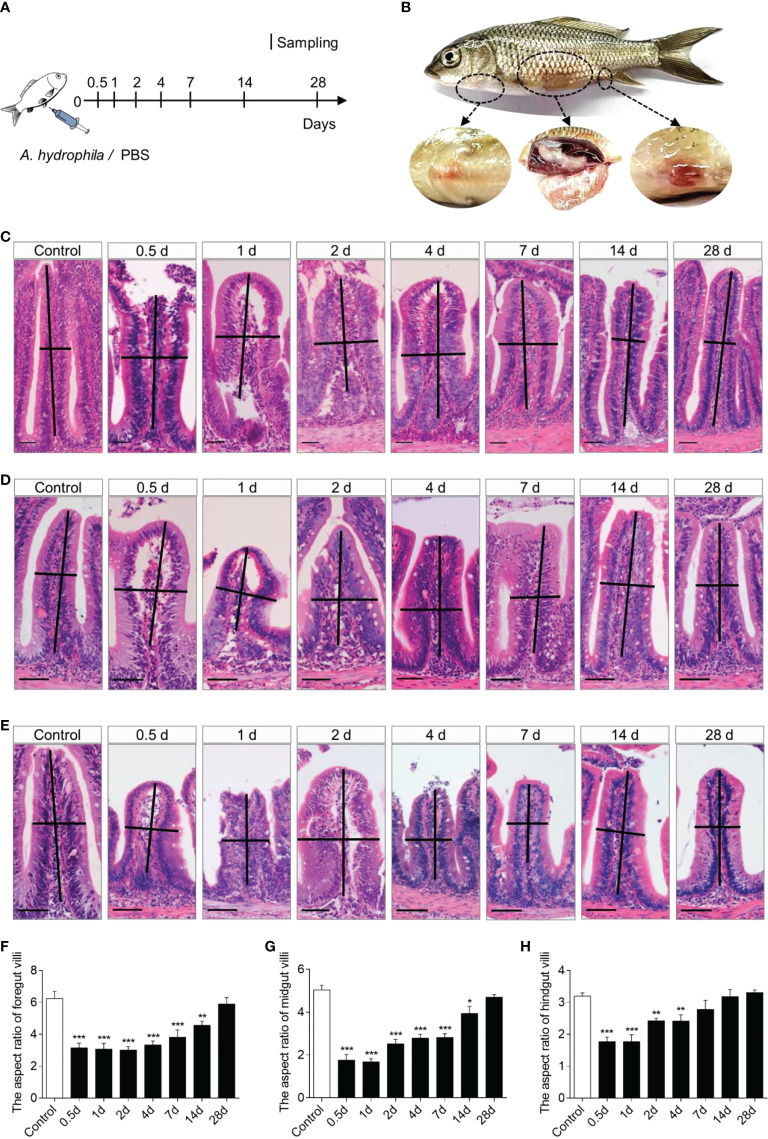
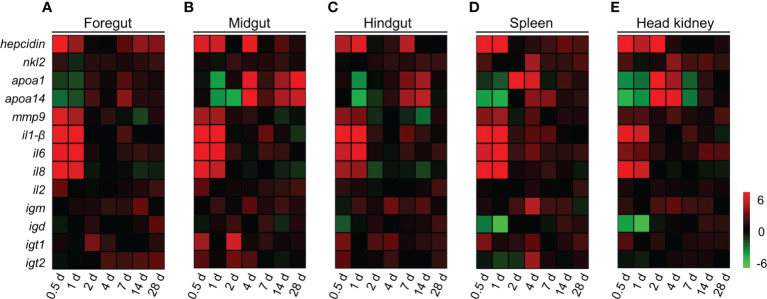
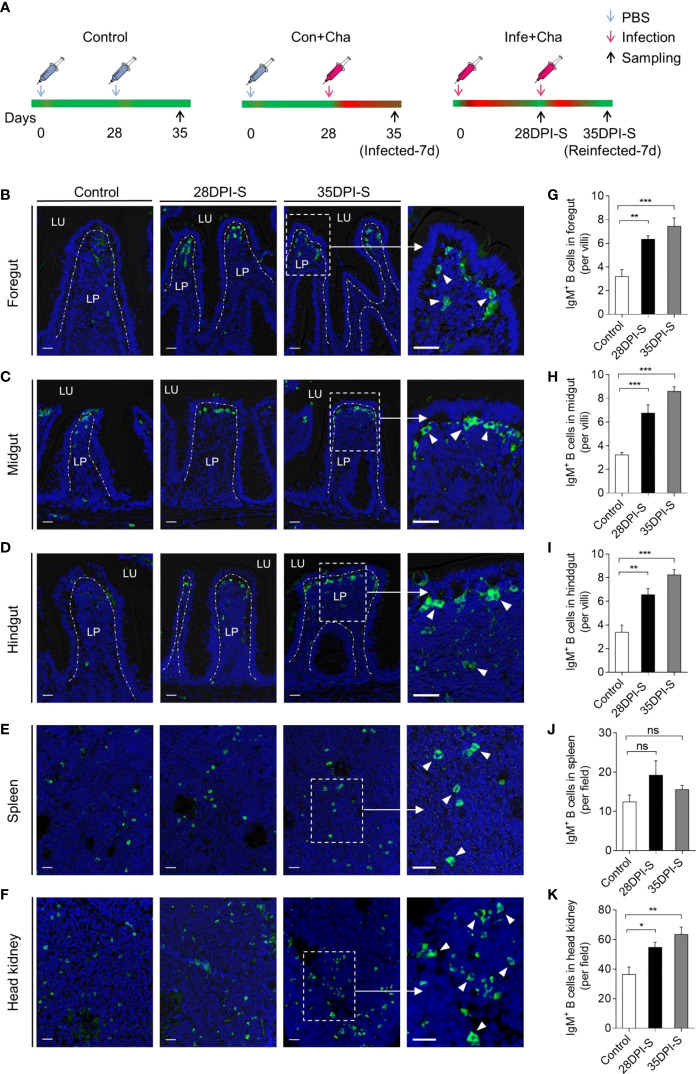
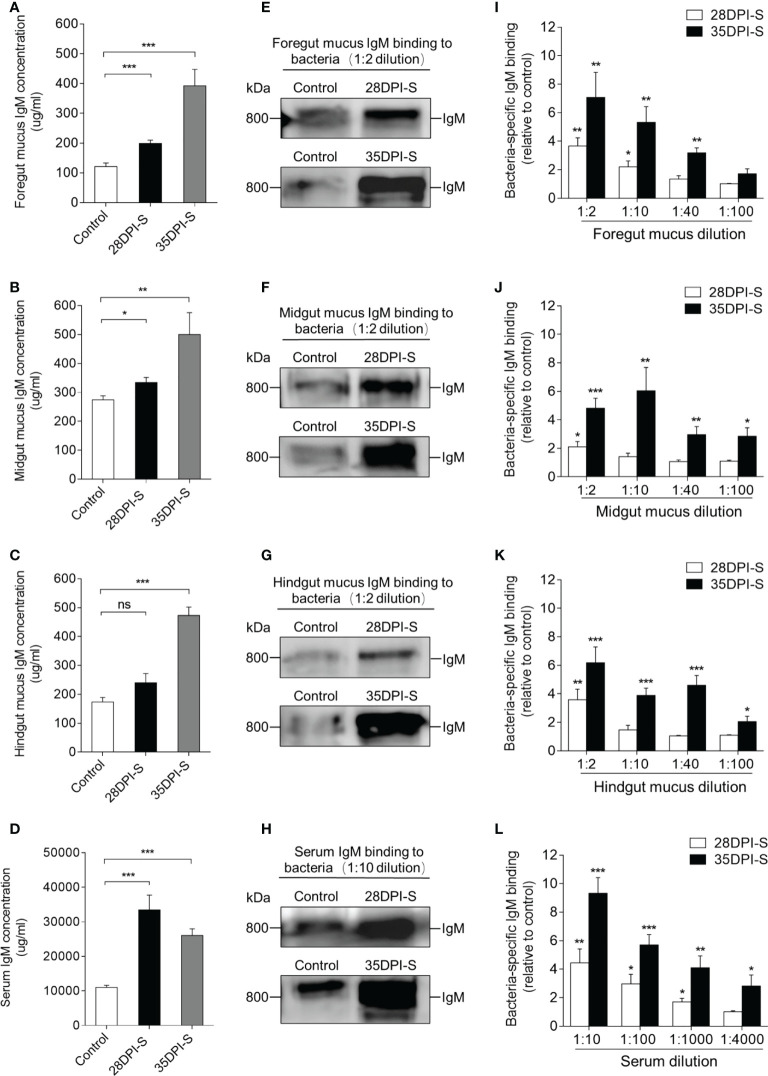
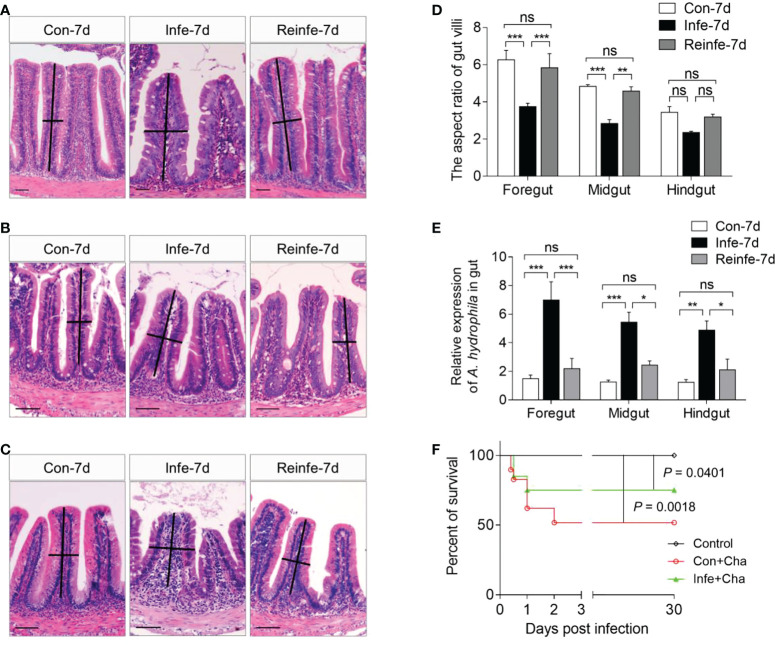
Immunoglobulin (Ig) M is an important immune effector that protects organisms from a wide variety of pathogens. However, little is known about the immune response of gut mucosal IgM during bacterial invasion. Here, we generated polyclonal antibodies against common carp IgM and developed a model of carp infection with Aeromonas hydrophila via intraperitoneal injection. Our findings indicated that both innate and adaptive immune responses were effectively elicited after A. hydrophila infection. Upon bacterial infection, IgM+ B cells were strongly induced in the gut and head kidney, and bacteria-specific IgM responses were detected in high levels both in the gut mucus and serum. Moreover, our results suggested that IgM responses may vary in different infection strategies. Overall, our findings revealed that the infected common carp exhibited high resistance to this representative enteropathogenic bacterium upon reinfection, suggesting that IgM plays a key role in the defense mechanisms of the gut against bacterial invasion. Significantly, the second injection of A. hydrophila induces strong local mucosal immunity in the gut, which is essential for protection against intestinal pathogens, providing reasonable insights for vaccine preparation.
Keywords: Aeromonas hydrophila; B cells; IgM; common carp; mucosal immune response.
Copyright © 2022 Mu, Dong, Kong, Wang, Yu, Ji, Su and Xu.
Conflict of interest statement
The authors declare that the research was conducted in the absence of any commercial or financial relationships that could be construed as a potential conflict of interest.
Figures
Similar articles
-
Immune effects of the vaccine of live attenuated Aeromonas hydrophila screened by rifampicin on common carp (Cyprinus carpio L).Vaccine. 2016 Jun 8;34(27):3087-3092. doi: 10.1016/j.vaccine.2016.04.075. Epub 2016 May 4. Vaccine. 2016. PMID: 27155500
-
Molecular characterization of a new IgZ3 subclass in common carp (Cyprinus carpio) and comparative expression analysis of IgH transcripts during larvae development.BMC Vet Res. 2021 Apr 14;17(1):159. doi: 10.1186/s12917-021-02844-7. BMC Vet Res. 2021. PMID: 33853603 Free PMC article.
-
Mucosal immune responses of gut IgM in common carp (Cyprinus carpio) following infection with spring viremia of carp virus (SVCV).Fish Shellfish Immunol. 2024 Feb;145:109326. doi: 10.1016/j.fsi.2023.109326. Epub 2023 Dec 21. Fish Shellfish Immunol. 2024. PMID: 38134976
-
Chinese yam polysaccharide induces the differentiation and natural antibody secretion of IgM+ B cells to prevent Aeromonas hydrophila infection in grass carp.Int J Biol Macromol. 2025 Apr;300:140263. doi: 10.1016/j.ijbiomac.2025.140263. Epub 2025 Jan 23. Int J Biol Macromol. 2025. PMID: 39863219
-
Response of the intestinal mucosal barrier of carp (Cyprinus carpio) to a bacterial challenge by Aeromonas hydrophila intubation after feeding with β-1,3/1,6-glucan.J Fish Dis. 2018 Jul;41(7):1077-1092. doi: 10.1111/jfd.12799. Epub 2018 Mar 15. J Fish Dis. 2018. PMID: 29542825
Cited by
-
Navigating Fish Immunity: Focus on Mucosal Immunity and the Evolving Landscape of Mucosal Vaccines.Biology (Basel). 2024 Nov 27;13(12):980. doi: 10.3390/biology13120980. Biology (Basel). 2024. PMID: 39765647 Free PMC article. Review.
-
Proteomic map of the differentially expressed proteins in the skin of Ctenopharyngodon idella against Aeromonas hydrophila infection.Fish Shellfish Immunol Rep. 2023 Nov 1;5:100122. doi: 10.1016/j.fsirep.2023.100122. eCollection 2023 Dec 15. Fish Shellfish Immunol Rep. 2023. PMID: 38023345 Free PMC article.
-
Haemato-Immunological Response of Immunized Atlantic Salmon (Salmo salar) to Moritella viscosa Challenge and Antigens.Vaccines (Basel). 2024 Jan 10;12(1):70. doi: 10.3390/vaccines12010070. Vaccines (Basel). 2024. PMID: 38250883 Free PMC article.
-
Effect of dietary Clostridium butyricum supplementation on growth performance, immune function, and intestinal health of hybrid grouper (Epinephelus fuscoguttatus ♀ × Epinephelus lanceolatus ♂).Front Immunol. 2025 Feb 26;16:1557256. doi: 10.3389/fimmu.2025.1557256. eCollection 2025. Front Immunol. 2025. PMID: 40078994 Free PMC article.
-
The Effects of Fishmeal Replacement with Degossypolled Cottonseed Protein on Growth, Serum Biochemistry, Endocrine Responses, Lipid Metabolism, and Antioxidant and Immune Responses in Black Carp (Mylopharyngodon piceus).Animals (Basel). 2025 May 13;15(10):1404. doi: 10.3390/ani15101404. Animals (Basel). 2025. PMID: 40427281 Free PMC article.
References
Publication types
MeSH terms
Substances
LinkOut - more resources
Full Text Sources
Research Materials