

Glucose metabolism is upregulated in the mononuclear cell proteome during sepsis and supports endotoxin-tolerant cell function
- PMID: 36466921
- PMCID: PMC9718365
- DOI: 10.3389/fimmu.2022.1051514
Glucose metabolism is upregulated in the mononuclear cell proteome during sepsis and supports endotoxin-tolerant cell function
Abstract
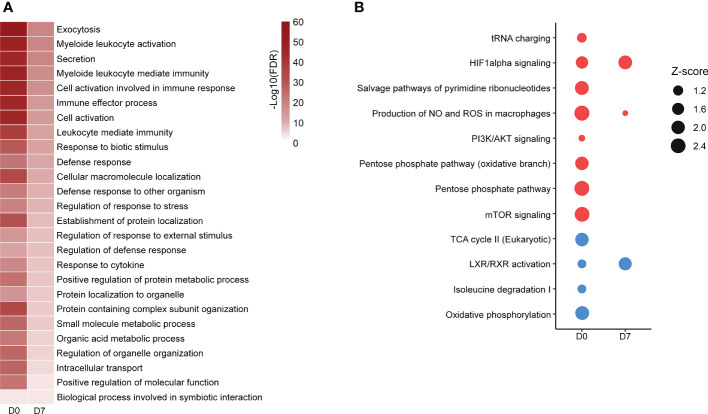
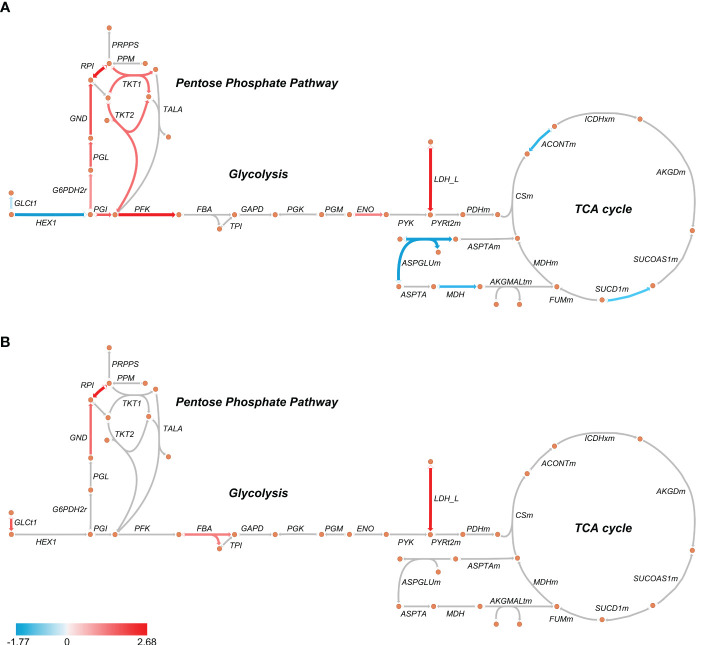
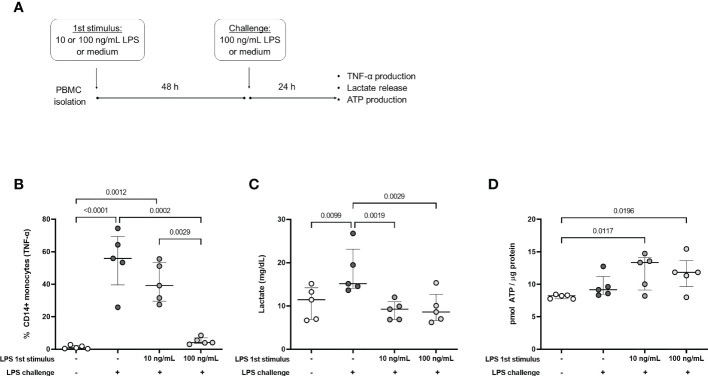
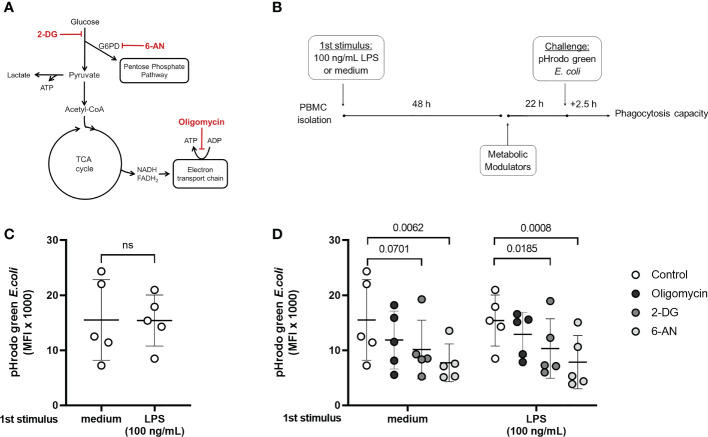
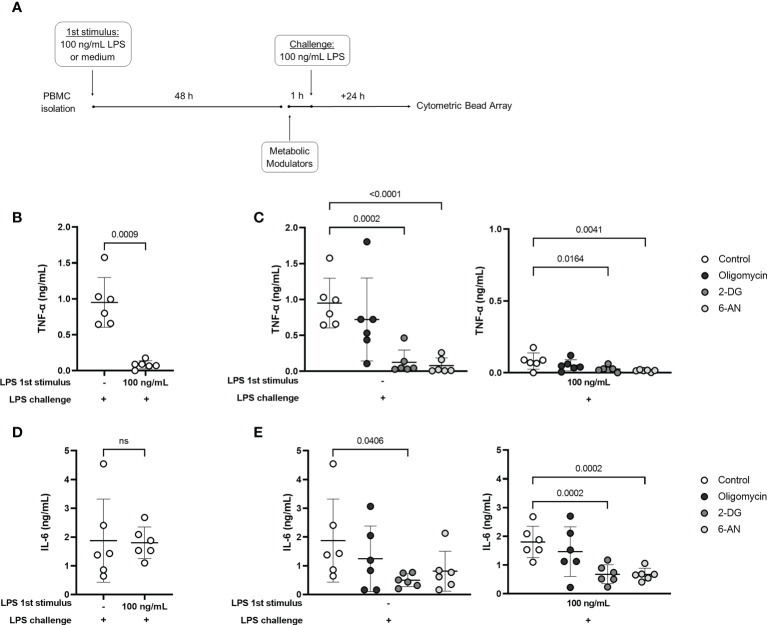
Metabolic adaptations shape immune cell function. In the acute response, a metabolic switch towards glycolysis is necessary for mounting a proinflammatory response. During the clinical course of sepsis, both suppression and activation of immune responses take place simultaneously. Leukocytes from septic patients present inhibition of cytokine production while other functions such as phagocytosis and production of reactive oxygen species (ROS) are preserved, similarly to the in vitro endotoxin tolerance model, where a first stimulation with lipopolysaccharide (LPS) affects the response to a second stimulus. Here, we sought to investigate how cellular metabolism is related to the modulation of immune responses in sepsis and endotoxin tolerance. Proteomic analysis in peripheral blood mononuclear cells (PBMCs) from septic patients obtained at intensive care unit admission showed an upregulation of proteins related to glycolysis, the pentose phosphate pathway (PPP), production of ROS and nitric oxide, and downregulation of proteins in the tricarboxylic acid cycle and oxidative phosphorylation compared to healthy volunteers. Using the endotoxin-tolerance model in PBMCs from healthy subjects, we observed increased lactate production in control cells upon LPS stimulation, while endotoxin-tolerant cells presented inhibited tumor necrosis factor-α and lactate production along with preserved phagocytic capacity. Inhibition of glycolysis and PPP led to impairment of phagocytosis and cytokine production both in control and in endotoxin-tolerant cells. These data indicate that glucose metabolism supports leukocyte functions even in a condition of endotoxin tolerance.
Keywords: LPS; PBMCs; endotoxin-tolerance; glycolysis; immunometabolism; pentose phosphate pathway; sepsis.
Copyright © 2022 Ferreira, Sousa, Leite, Brunialti, Nishiduka, Tashima, van der Poll and Salomão.
Conflict of interest statement
The authors declare that the research was conducted in the absence of any commercial or financial relationships that could be construed as a potential conflict of interest.
Figures
Similar articles
-
Serial Change of Endotoxin Tolerance in a Polymicrobial Sepsis Model.Int J Mol Sci. 2022 Jun 13;23(12):6581. doi: 10.3390/ijms23126581. Int J Mol Sci. 2022. PMID: 35743025 Free PMC article.
-
Bench-to-bedside review: endotoxin tolerance as a model of leukocyte reprogramming in sepsis.Crit Care. 2006;10(5):233. doi: 10.1186/cc5055. Crit Care. 2006. PMID: 17044947 Free PMC article. Review.
-
Sustained Immunoparalysis in Endotoxin-Tolerized Monocytic Cells.Mediators Inflamm. 2020 Jun 13;2020:8294342. doi: 10.1155/2020/8294342. eCollection 2020. Mediators Inflamm. 2020. PMID: 32617075 Free PMC article.
-
Haptoglobin improves acute phase response and endotoxin tolerance in response to bacterial LPS.Immunol Lett. 2019 Mar;207:17-27. doi: 10.1016/j.imlet.2019.01.002. Epub 2019 Jan 6. Immunol Lett. 2019. PMID: 30625342
-
Cooperation of liver cells in health and disease.Adv Anat Embryol Cell Biol. 2001;161:III-XIII, 1-151. doi: 10.1007/978-3-642-56553-3. Adv Anat Embryol Cell Biol. 2001. PMID: 11729749 Review.
Cited by
-
A polycomb group protein EED epigenetically regulates responses in lipopolysaccharide tolerized macrophages.Epigenetics Chromatin. 2024 Nov 29;17(1):36. doi: 10.1186/s13072-024-00562-6. Epigenetics Chromatin. 2024. PMID: 39614386 Free PMC article.
-
The Overlapping Biology of Sepsis and Cancer and Therapeutic Implications.Biomedicines. 2025 May 23;13(6):1280. doi: 10.3390/biomedicines13061280. Biomedicines. 2025. PMID: 40563999 Free PMC article. Review.
-
Hexokinase 2 promotes ISGylation of Acyl-CoA synthetase long-chain family member 4 in sepsis-induced microglia cells.J Lipid Res. 2025 Apr;66(4):100776. doi: 10.1016/j.jlr.2025.100776. Epub 2025 Mar 12. J Lipid Res. 2025. PMID: 40086696 Free PMC article.
-
Emerging roles of lactate in acute and chronic inflammation.Cell Commun Signal. 2024 May 16;22(1):276. doi: 10.1186/s12964-024-01624-8. Cell Commun Signal. 2024. PMID: 38755659 Free PMC article. Review.
-
Fundamental Neurochemistry Review: Microglial immunometabolism in traumatic brain injury.J Neurochem. 2023 Oct;167(2):129-153. doi: 10.1111/jnc.15959. Epub 2023 Sep 27. J Neurochem. 2023. PMID: 37759406 Free PMC article. Review.
References
Publication types
MeSH terms
Substances
LinkOut - more resources
Full Text Sources
Medical