. 2022 Nov 16:13:1030800.
doi: 10.3389/fphar.2022.1030800. eCollection 2022.

Activation of EP4 alleviates AKI-to-CKD transition through inducing CPT2-mediated lipophagy in renal macrophages

Affiliations

Activation of EP4 alleviates AKI-to-CKD transition through inducing CPT2-mediated lipophagy in renal macrophages

Xu Guan et al. Front Pharmacol. .

Abstract

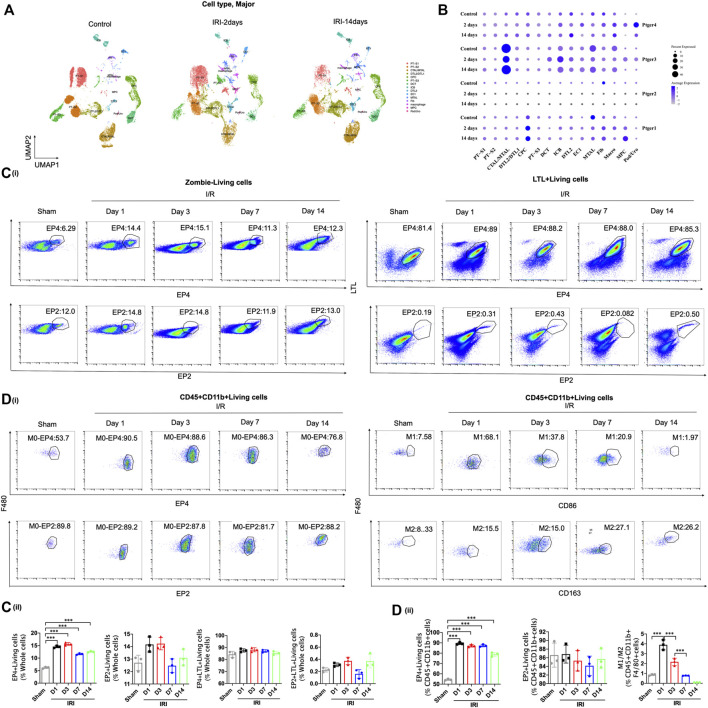
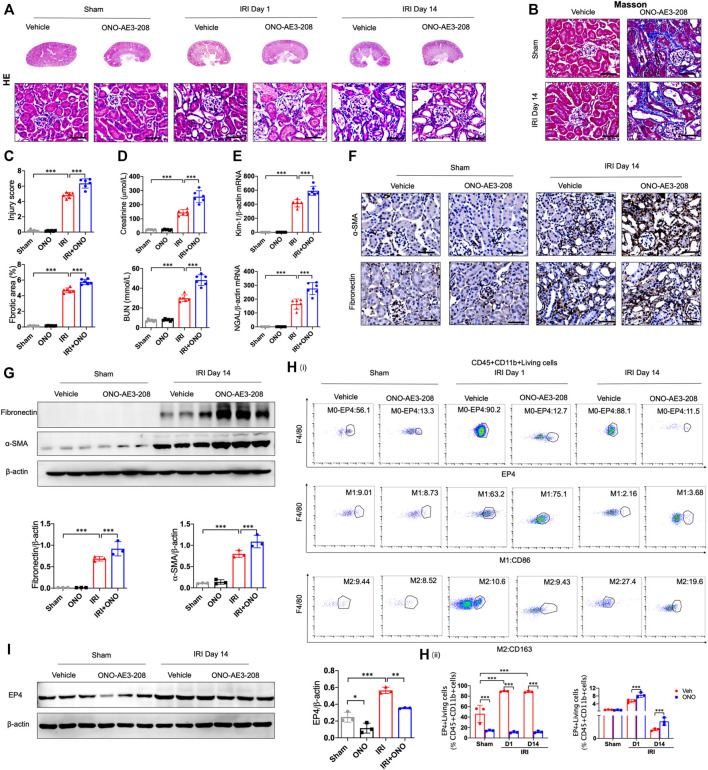
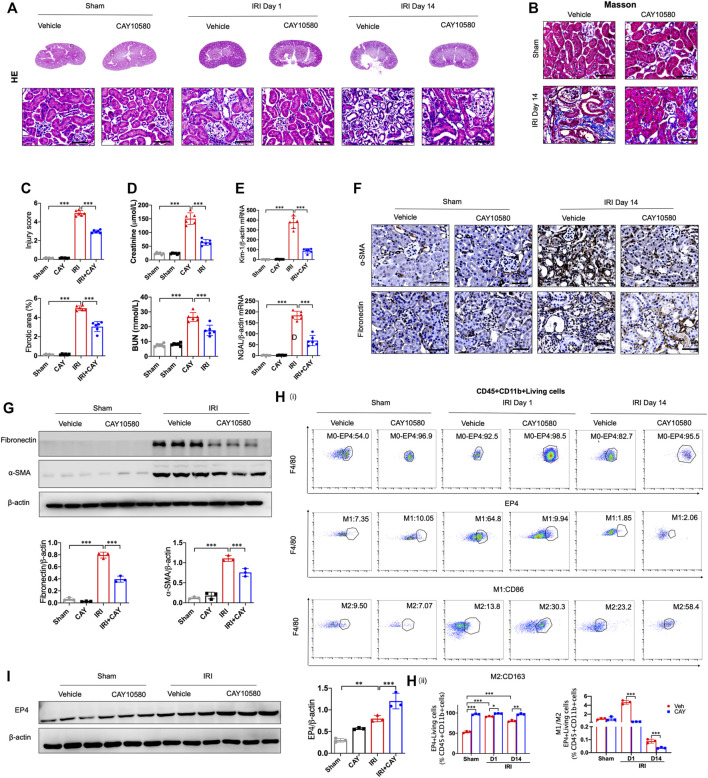
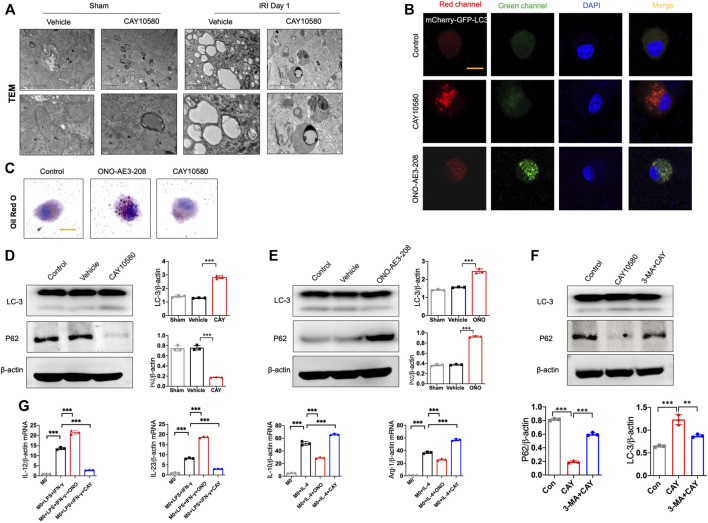
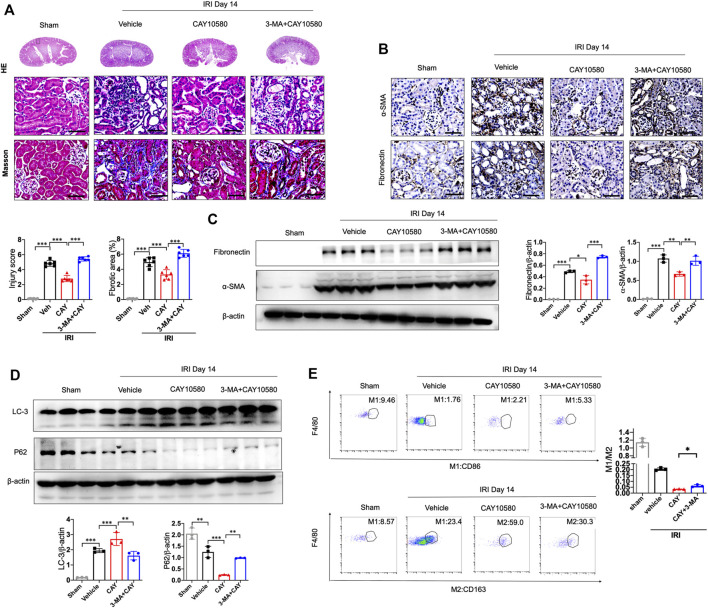
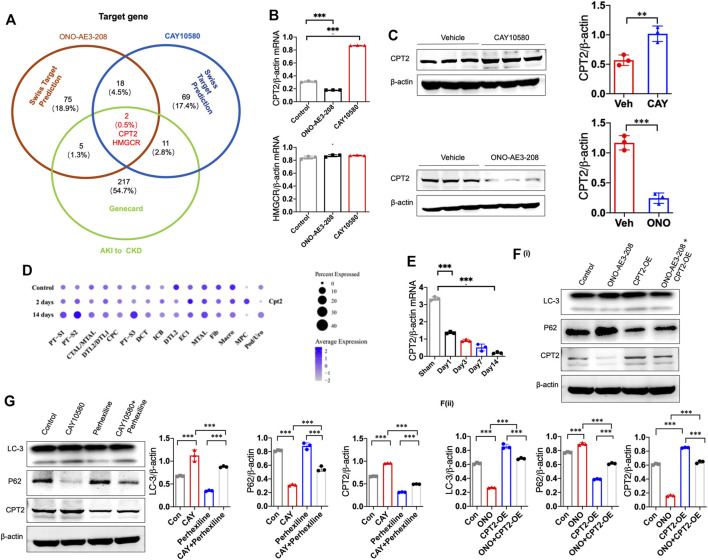
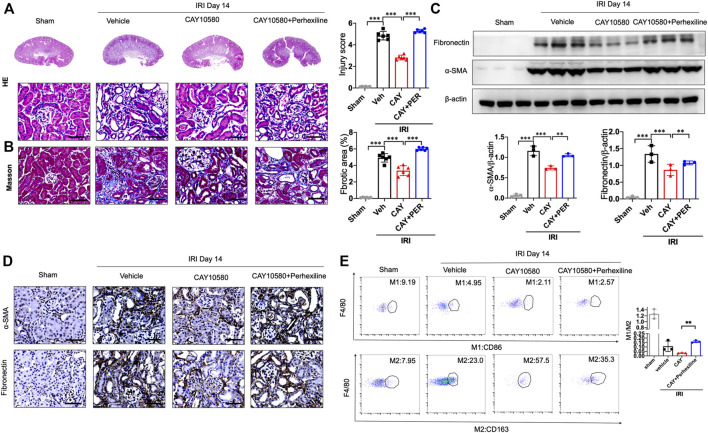
Acute kidney injury (AKI) is a common clinical syndrome with complex pathogenesis, characterized by a rapid decline in kidney function in the short term. Worse still, the incomplete recovery from AKI increases the risk of progression to chronic kidney disease (CKD). However, the pathogenesis and underlying mechanism remain largely unknown. Macrophages play an important role during kidney injury and tissue repair, but its role in AKI-to-CKD transition remains elusive. Herein, single nucleus RNA sequencing (snRNA-Seq) and flow cytometry validations showed that E-type prostaglandin receptor 4 (EP4) was selectively activated in renal macrophages, rather than proximal tubules, in ischemia-reperfusion injury (IRI)-induced AKI-to-CKD transition mouse model. EP4 inhibition aggravated AKI-to-CKD transition, while EP4 activation impeded the progression of AKI to CKD though regulating macrophage polarization. Mechanistically, network pharmacological analysis and subsequent experimental verifications revealed that the activated EP4 inhibited macrophage polarization through inducing Carnitine palmitoyltransferase 2 (CPT2)-mediated lipophagy in macrophages. Further, CPT2 inhibition abrogated the protective effect of EP4 on AKI-to-CKD transition. Taken together, our findings demonstrate that EP4-CPT2 signaling-mediated lipophagy in macrophages plays a pivotal role in the transition of AKI to CKD and targeting EP4-CPT2 axis could serve as a promising therapeutic approach for retarding AKI and its progression to CKD.

Keywords: AKI-to-CKD transition; CPT2; EP4; lipophagy; macrophages.


Conflict of interest statement

The authors declare that the research was conducted in the absence of any commercial or financial relationships that could be construed as a potential conflict of interest.

Figures

FIGURE 1
FIGURE 1
EP4 is selectively activated in renal macrophages after ischemia-reperfusion injury. (A–B) Cell Types and Clusters Identified by snRNA-seq in Kidney Tissues of IRI mice. t-Distributed stochastic neighbor embedding (t-SNE) plot showing major cell clusters or type. Cell clusters were identified by kidney cell lineage-specific marker expression. PT-S1, the S1 segment of proximal tubule; PT-S2, the S2 segment of proximal tubule; CTAL, thick ascending limb of loop of Henle in cortex; DTL, descending limb of loop of Henle; CPC, principle cells of collecting duct in cortex; PT-S3, S3 segment of proximal tubule; DCT, distal convoluted tubule; ICB, type B intercalated cells of collecting duct; EC, endothelial cells; MTAL, thick ascending limb of loop of Henle in medulla; Fib, fibroblasts; Macro, macrophages; Pod, podocytes; MPC, principle cells of collecting duct in medulla; Uro, urothelium. (C) Flow cytometric analysis of the percentage of EP4 and EP2 living cells (Zombie) in whole kidney cells of AKI mice at 1, 3, 7, and 14 days after ischemia-reperfusion injury. Flow cytometric analysis of the percentage of EP4 and EP2 LTL+living cells (ZombieLTL+) in whole kidney cells of AKI mice. (D) Flow cytometric analysis of the percentage of EP4 and EP2 in renal macrophages (ZombieCD45+CD11b+F4/80+cells) in kidney of AKI mice. Flow cytometric analysis of the percentage of M1 (CD86+) and M2 (CD163+) in renal macrophages (ZombieCD45+CD11b+F4/80+cells) in kidney of AKI mice. The percentage of cells in kidney from IRI mice by flow cytometry. n = 3 mice per group, Data are means ± s.d. ***p < 0.001, **p < 0.01, *p < 0.05.
FIGURE 2
FIGURE 2
EP4 inhibition aggravates AKI-to-CKD transition. (A,B) Representative micrographs of HE and Masson staining of kidney sections from sham and IRI-induced AKI mice injected with control or EP4 inhibitor ONO-AE3-208. (C) Scoring of injury score and fibrotic area according to HE and Masson staining of kidney sections from sham and IRI mice. (D) Serum creatinine and blood urea nitrogen levels of sham and IRI mice. (E) The mRNA levels of Kim-1 and Ngal in the kidney of sham and IRI mice analyzed by qPCR. (F) Representative Immunostaining of fibronectin and α-SMA in kidney sections from sham and IRI mice. (G) Western blot analysis for fibronectin and α-SMA protein levels in kidney sections from sham and IRI mice. (H) Flow cytometric analysis of the percentage of EP4, M1 (CD86+) and M2 (CD163+) in renal macrophages (ZombieCD45+CD11b+F4/80+cells) in kidney of sham and IRI mice. (I) Western blot analysis for EP4 protein levels in kidney sections from sham and IRI mice treated with ONO-AE3-208. Scale bars, 50 μm. n = 6 mice per group. Data are means ± s.d. ***p < 0.001, **p < 0.01, *p < 0.05.
FIGURE 3
FIGURE 3
Sustained activation of EP4 restrains the progression of AKI to CKD. (A,B) Representative micrographs of HE and Masson staining of kidney sections from sham and IRI-induced AKI mice injected with control or CAY10580, a EP4 agonist. (C) Scoring of injury score and fibrotic area according to HE and Masson staining of kidney sections from sham and IRI mice. (D) Serum creatinine and blood urea nitrogen levels of sham and IRI mice. (E) The mRNA levels of Kim-1 and Ngal in the kidney of sham and IRI mice analyzed by qPCR. (F) Representative Immunostaining of fibronectin and α-SMA in kidney sections from sham and IRI mice. (G) Western blot analysis for fibronectin and α-SMA protein levels in kidney sections from sham and IRI mice. (H) Flow cytometric analysis of the percentage of EP4, M1 (CD86+) and M2 (CD163+) in renal macrophages (ZombieCD45+CD11b+F4/80+cells) in kidney of sham and IRI mice. (n = 3 mice per group). (I) Western blot analysis for EP4 protein levels in kidney sections from sham and IRI mice treated with CAY10580. Scale bars, 50 μm, n = 6 mice per group, Data are means ± s.d. ***p < 0.001, **p < 0.01, *p < 0.05.
FIGURE 4
FIGURE 4
EP4 inhibits macrophage polarization via inducing lipophagy. (A) Representative images of transmission electron microscope (TEM) observation of autophagosome-encapsulated lipid droplets of the kidney from sham and IRI mice. (B) Representative Immunostaining of mCherry-GFP-LC3 in THP-1 cells treated with CAY10580 or ONO-AE3-208. (C) Representative micrographs of Oil red O (ORO) staining in THP-1 cells pre-incubated with PMA for 24 h and subsequently treated with treated with CAY10580 or ONO-AE3-208. (D,E) Western blot analysis for LC-3 and P62 protein levels in THP-1 cells pre-incubated with PMA for 24 h and subsequently treated with CAY10580 or ONO-AE3-208. (F) Western blot analysis for LC-3 and P62 protein levels in THP-1 cells pre-incubated with PMA for 24 h and subsequently treated with CAY10580 or 3-MA. (G) qPCR analysis of the mRNA levels of IL-12, IL-23, IL-10 and Arg-1 in THP-1 cells after incubation with PMA following treated with LPS and IFN-γ, or IL-4, respectively. Data are means ± s.d. n = 6 mice per group, ***p < 0.001, **p < 0.01.
FIGURE 5
FIGURE 5
EP4 attenuates AKI-to-CKD transition through inducing lipophagy. (A) Representative micrograph of HE and Masson staining of kidney sections from sham and IRI mice treated with CAY10580 or 3-MA. (B) Representative Immunostaining of fibronectin and α-SMA in kidney sections from sham and IRI mice treated with CAY10580 or 3-MA. (C) Western blot analysis for fibronectin and α-SMA protein levels in kidney sections from sham and IRI mice treated with CAY10580 or 3-MA. (D) Western blot analysis for LC-3 and P62 protein levels in kidney sections from sham and IRI mice treated with CAY10580 or 3-MA. (E) Flow cytometric analysis of the percentage of M1 (CD86+) and M2 (CD163+) in renal macrophages (ZombieCD45+CD11b+F4/80+cells) in kidney of sham and IRI mice. (n = 3 mice per group). n = 6 mice per group, Scale bars, 50 μm, Data are means ± s.d. n = 6 mice per group, ***p < 0.001, **p < 0.01.
FIGURE 6
FIGURE 6
EP4 induces lipophagy through upregulating CPT2 expression in macrophages. (A) Genecard and SwissTargetPrediction (network pharmacology analysis) were employed to predict the target genes of EP4. (B) qRT-PCR analysis of CPT2 and HMGCR expression in THP-1 cells pre-incubated with PMA for 24 h and subsequently treated with ONO-AE3-208 or CAY10580 for 24 h. (C) Western blot analysis of CPT2 expression in THP-1 pre-incubated with PMA for 24 h and subsequently treated with ONO-AE3-208 or CAY10580 for 24 h. (D) Dot plot displaying gene expression patterns of cluster-enriched markers in the kidney from sham and IRI mice at 2 days and 14 days after surgery. (E) qRT-PCR analysis of CPT2 expression in macrophages separated from the kidney of sham and IRI mice by Flow sorting. (F,G) Western blot analysis of CPT2 expression in THP-1 cells pre-incubated with PMA for 24 h subsequently treated with CPT2 specific inhibitor (Perhexiline) or overexpression (OE) plasmids in combined with EP4 agonist or inhibitor, respectively. Scale bars, 50 μm, Data are means ± s.d. ***p < 0.001, **p < 0.01.
FIGURE 7
FIGURE 7
CPT2 inhibition abrogates the protective effect of EP4 activation on AKI-to-CKD. (A,B) Representative micrographs of HE and Masson staining of kidney sections from sham and IRI mice treated with ONO-AE3-208 or Perhexiline (maleate). (C) Western blot analysis for fibronectin and α-SMA protein levels in kidney sections from sham and IRI mice treated with ONO-AE3-208 or Perhexiline (maleate). (D) Representative Immunostaining of fibronectin and α-SMA in kidney sections from sham and IRI mice treated with ONO-AE3-208 or Perhexiline (maleate). The scale bar corresponds to 50 μm. (E) Flow cytometric analysis of the percentage of M1 (CD86+) and M2 (CD163+) in renal macrophages (ZombieCD45+CD11b+F4/80+cells) in kidney of sham and IRI mice. (n = 3 mice per group). n = 6 mice per group, Scale bars, 50 μm, Data are means ± s.d.***p < 0.001, **p < 0.01.

Similar articles

Cited by

References

    1. Abouelkheir M., Shabaan D. A., Shahien M. A. (2021). Delayed blockage of prostaglandin EP4 receptors can reduce dedifferentiation, epithelial-to-mesenchymal transition and fibrosis following acute kidney injury. Clin. Exp. Pharmacol. Physiol. 48 (5), 791–800. 10.1111/1440-1681.13478 - DOI - PubMed
    1. Bhatia D., Capili A., Nakahira K., Muthukumar T., Torres L. K., Choi A. M. K., et al. (2022). Conditional deletion of myeloid-specific mitofusin 2 but not mitofusin 1 promotes kidney fibrosis. Kidney Int. 101 (5), 963–986. 10.1016/j.kint.2022.01.030 - DOI - PMC - PubMed
    1. Bugarski M., Ghazi S., Polesel M., Martins J. R., Hall A. M. (2021). Changes in NAD and lipid metabolism drive acidosis-induced acute kidney injury. J. Am. Soc. Nephrol. 32 (2), 342–356. 10.1681/ASN.2020071003 - DOI - PMC - PubMed
    1. Cao Y., Mai W., Li R., Deng S., Li L., Zhou Y., et al. (2022). Macrophages evoke autophagy of hepatic stellate cells to promote liver fibrosis in NAFLD mice via the PGE2/EP4 pathway. Cell. Mol. Life Sci. 79 (6), 303. 10.1007/s00018-022-04319-w - DOI - PMC - PubMed
    1. Carney E. F. (2021). Ferroptotic stress promotes the AKI to CKD transition. Nat. Rev. Nephrol. 17 (10), 633. 10.1038/s41581-021-00482-8 - DOI - PubMed

LinkOut - more resources