

Serine and glycine metabolism-related gene expression signature stratifies immune profiles of brain gliomas, and predicts prognosis and responses to immunotherapy
- PMID: 36467068
- PMCID: PMC9712738
- DOI: 10.3389/fphar.2022.1072253
Serine and glycine metabolism-related gene expression signature stratifies immune profiles of brain gliomas, and predicts prognosis and responses to immunotherapy
Abstract
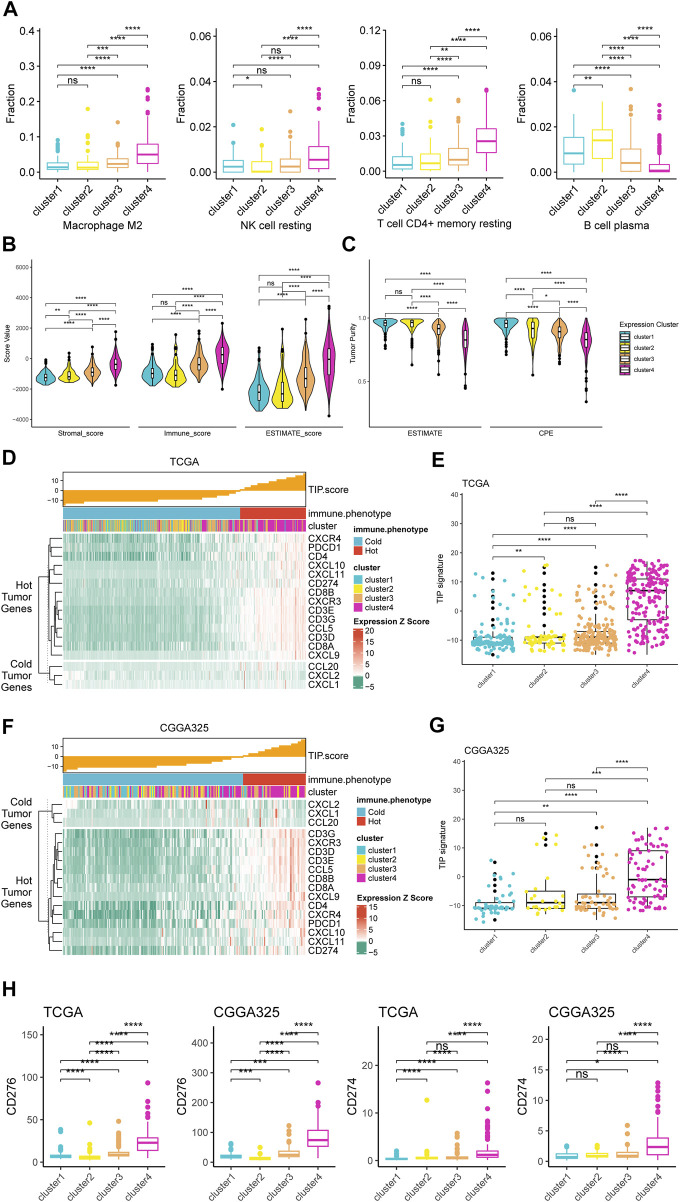
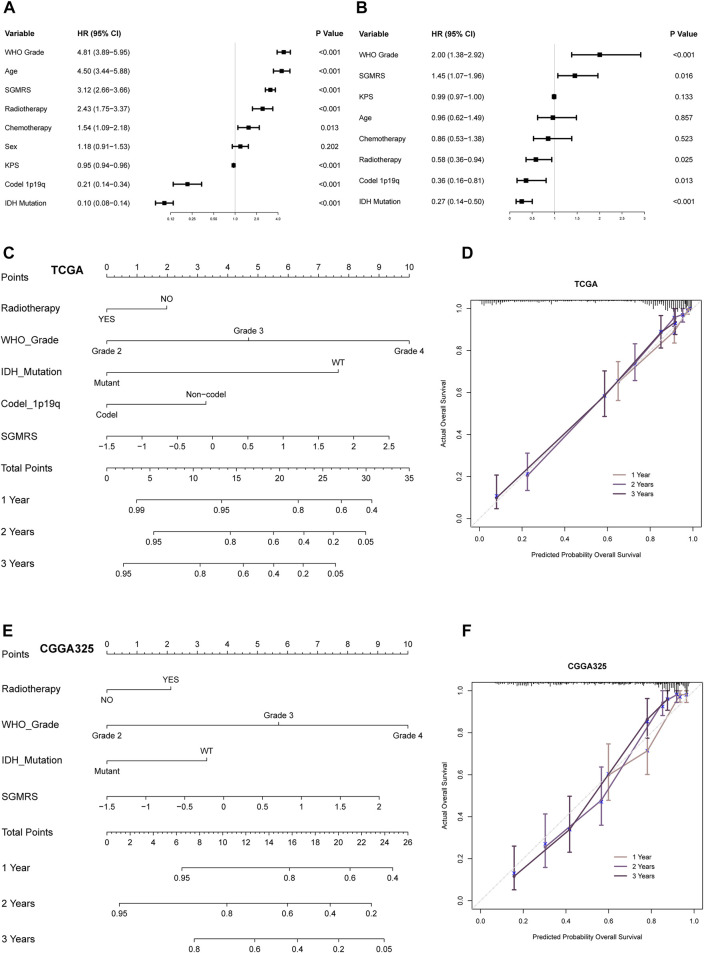
Glioma is one of the most lethal cancers and causes more than 200,000 deaths every year. Immunotherapy was an inspiring therapy for multiple cancers but failed in glioma treatment. The importance of serine and glycine and their metabolism has been well-recognized in the physiology of immune cells and microenvironment in multiple cancers. However, their correlation with prognosis, immune cells, and immune microenvironment of glioma remains unclear. In this study, we investigated the relationships between the expression pattern of serine and glycine metabolism-related genes (SGMGs) and clinicopathological features, prognosis, and tumor microenvironment in glioma based on comprehensive analyses of multiple public datasets and our cohort. According to the expression of SGMGs, we conducted the consensus clustering analysis to stratify all patients into four clusters with remarkably distinctive clinicopathological features, prognosis, immune cell infiltration, and immune microenvironment. Subsequently, a serine and glycine metabolism-related genes signature (SGMRS) was constructed based on five critical SGMGs in glioma to stratify patients into SGMRS high- and low-risk groups and tested for its prognostic value. Higher SGMRS expressed genes associated with the synthesis of serine and glycine at higher levels and manifested poorer prognosis. Besides, we confirmed that SGMRS was an independent prognostic factor and constructed nomograms with satisfactory prognosis prediction performance based on SGMRS and other factors. Analyzing the relationship between SGMRS and immune landscape, we found that higher SGMRS correlated with 'hotter' immunological phenotype and more immune cell infiltration. Furthermore, the expression levels of multiple immunotherapy-related targets, including PD-1, PD-L1, and B7-H3, were positively correlated with SGMRS, which was validated by the better predicted response to immune checkpoint inhibitors. In conclusion, our study explored the relationships between the expression pattern of SGMGs and tumor features and created novel models to predict the prognosis of glioma patients. The correlation of SGMRS with immune cells and microenvironment in gliomas suggested an essential role of serine and glycine metabolism in reforming immune cells and microenvironment. Finally, the results of our study endorsed the potential application of SGMRS to guide the selection of immunotherapy for gliomas.
Keywords: glioma; glycine; immune checkpoint inhibitor; immune infiltration; metabolism; prognosis; serine; tumor microenvironment.
Copyright © 2022 Chen, Zhang, Feng, Li, Yuan, Li, Wang, Yang and Liu.
Conflict of interest statement
The authors declare that the research was conducted in the absence of any commercial or financial relationships that could be construed as a potential conflict of interest.
Figures


Similar articles
-
Prognosis prediction and tumor immune microenvironment characterization based on tryptophan metabolism-related genes signature in brain glioma.Front Pharmacol. 2022 Nov 1;13:1061597. doi: 10.3389/fphar.2022.1061597. eCollection 2022. Front Pharmacol. 2022. PMID: 36386216 Free PMC article.
-
Purine metabolism-related gene expression signature predicts survival outcome and indicates immune microenvironment profile of gliomas.Front Pharmacol. 2022 Nov 10;13:1038272. doi: 10.3389/fphar.2022.1038272. eCollection 2022. Front Pharmacol. 2022. PMID: 36438805 Free PMC article.
-
Prognostic value of cuproptosis-related genes signature and its impact on the reshaped immune microenvironment of glioma.Front Pharmacol. 2022 Oct 4;13:1016520. doi: 10.3389/fphar.2022.1016520. eCollection 2022. Front Pharmacol. 2022. PMID: 36267281 Free PMC article.
-
Deciphering immune microenvironment and cell evasion mechanisms in human gliomas.Front Oncol. 2023 May 19;13:1135430. doi: 10.3389/fonc.2023.1135430. eCollection 2023. Front Oncol. 2023. PMID: 37274252 Free PMC article. Review.
-
Serine metabolism in tumor progression and immunotherapy.Discov Oncol. 2025 Apr 28;16(1):628. doi: 10.1007/s12672-025-02358-w. Discov Oncol. 2025. PMID: 40295433 Free PMC article. Review.
Cited by
-
Ligand-Gated Ion Channels: Prognostic and Therapeutic Implications for Gliomas.J Pers Med. 2023 May 19;13(5):853. doi: 10.3390/jpm13050853. J Pers Med. 2023. PMID: 37241023 Free PMC article. Review.
-
Prognostic Biomarkers for Hepatocellular Carcinoma Based on Serine and Glycine Metabolism-related Genes.J Clin Transl Hepatol. 2024 Mar 28;12(3):266-277. doi: 10.14218/JCTH.2023.00457. Epub 2024 Feb 9. J Clin Transl Hepatol. 2024. PMID: 38426196 Free PMC article.
-
The cuproptosis-related signature predicts the prognosis and immune microenvironments of primary diffuse gliomas: a comprehensive analysis.Hum Genomics. 2024 Jul 2;18(1):74. doi: 10.1186/s40246-024-00636-2. Hum Genomics. 2024. PMID: 38956740 Free PMC article.
-
Amino acid metabolism in glioblastoma pathogenesis, immune evasion, and treatment resistance.Cancer Cell Int. 2025 Mar 13;25(1):89. doi: 10.1186/s12935-025-03721-1. Cancer Cell Int. 2025. PMID: 40082966 Free PMC article. Review.
-
A novel score system based on arginine metabolism-related genes to predict prognosis, characterize immune microenvironment, and forecast response to immunotherapy in IDH-wildtype glioblastoma.Front Pharmacol. 2023 Apr 5;14:1145828. doi: 10.3389/fphar.2023.1145828. eCollection 2023. Front Pharmacol. 2023. PMID: 37214463 Free PMC article.
References
LinkOut - more resources
Full Text Sources
Research Materials