

Development of a ferroptosis-based model to predict prognosis, tumor microenvironment, and drug response for lung adenocarcinoma with weighted genes co-expression network analysis
- PMID: 36467089
- PMCID: PMC9712758
- DOI: 10.3389/fphar.2022.1072589
Development of a ferroptosis-based model to predict prognosis, tumor microenvironment, and drug response for lung adenocarcinoma with weighted genes co-expression network analysis
Abstract
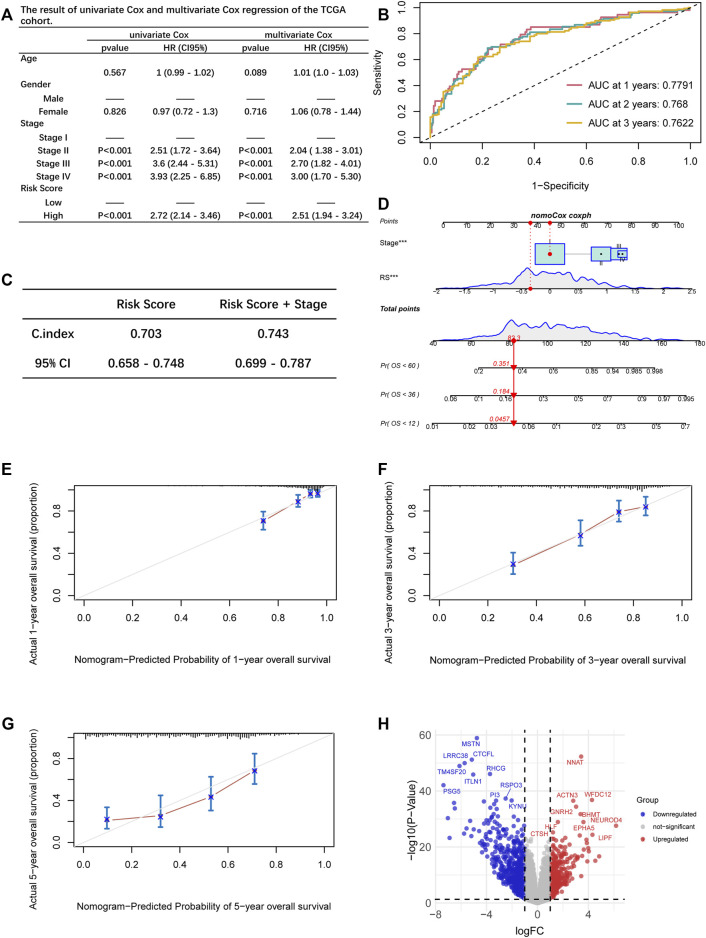
Objective: The goal of this study was to create a risk model based on the ferroptosis gene set that affects lung adenocarcinoma (LUAD) patients' prognosis and to investigate the potential underlying mechanisms. Material and Methods: A cohort of 482 LUAD patients from the TCGA database was used to develop the prognostic model. We picked the module genes from the ferroptosis gene set using weighted genes co-expression network analysis (WGCNA). The least absolute shrinkage and selection operator (LASSO) and univariate cox regression were used to screen the hub genes. Finally, the multivariate Cox analysis constructed a risk prediction score model. Three other cohorts of LUAD patients from the GEO database were included to validate the prediction ability of our model. Furthermore, the differentially expressed genes (DEG), immune infiltration, and drug sensitivity were analyzed. Results: An eight-gene-based prognostic model, including PIR, PEBP1, PPP1R13L, CA9, GLS2, DECR1, OTUB1, and YWHAE, was built. The patients from the TCGA database were classified into the high-RS and low-RS groups. The high-RS group was characterized by poor overall survival (OS) and less immune infiltration. Based on clinical traits, we separated the patients into various subgroups, and RS had remarkable prediction performance in each subgroup. The RS distribution analysis demonstrated that the RS was significantly associated with the stage of the LUAD patients. According to the study of immune cell infiltration in both groups, patients in the high-RS group had a lower abundance of immune cells, and less infiltration was associated with worse survival. Besides, we discovered that the high-RS group might not respond well to immune checkpoint inhibitors when we analyzed the gene expression of immune checkpoints. However, drug sensitivity analysis suggested that high-RS groups were more sensitive to common LUAD agents such as Afatinib, Erlotinib, Gefitinib, and Osimertinib. Conclusion: We constructed a novel and reliable ferroptosis-related model for LUAD patients, which was associated with prognosis, immune cell infiltration, and drug sensitivity, aiming to shed new light on the cancer biology and precision medicine.
Keywords: WGCNA; bioinformatics analysis; drugs sensitivity; ferroptosis; immune microenvironment; lung adenocarcinoma; prognosis.
Copyright © 2022 Cheng, Shan, Yang, Gu, Lu, Xu and Ge.
Conflict of interest statement
The authors declare that the research was conducted in the absence of any commercial or financial relationships that could be construed as a potential conflict of interest.
Figures


Similar articles
-
Prognostic model of lung adenocarcinoma based on immunoprognosis-related genes and related drug prediction.J Thorac Dis. 2024 Sep 30;16(9):5860-5877. doi: 10.21037/jtd-24-569. Epub 2024 Sep 26. J Thorac Dis. 2024. PMID: 39444861 Free PMC article.
-
A novel ferroptosis-related genes model for prognosis prediction of lung adenocarcinoma.BMC Pulm Med. 2021 Jul 13;21(1):229. doi: 10.1186/s12890-021-01588-2. BMC Pulm Med. 2021. PMID: 34256754 Free PMC article.
-
GAPDH Is a Novel Ferroptosis-Related Marker and Correlates with Immune Microenvironment in Lung Adenocarcinoma.Metabolites. 2023 Jan 17;13(2):142. doi: 10.3390/metabo13020142. Metabolites. 2023. PMID: 36837761 Free PMC article.
-
Development and Validation of a Robust Ferroptosis-Related Prognostic Signature in Lung Adenocarcinoma.Front Cell Dev Biol. 2021 Jun 24;9:616271. doi: 10.3389/fcell.2021.616271. eCollection 2021. Front Cell Dev Biol. 2021. PMID: 34249899 Free PMC article.
-
Ferroptosis-Related Gene Signature and Patterns of Immune Infiltration Predict the Overall Survival in Patients With Lung Adenocarcinoma.Front Mol Biosci. 2021 Jul 30;8:692530. doi: 10.3389/fmolb.2021.692530. eCollection 2021. Front Mol Biosci. 2021. PMID: 34395526 Free PMC article.
Cited by
-
Pharmacological Potential of Cinnamic Acid and Derivatives: A Comprehensive Review.Pharmaceuticals (Basel). 2025 Jul 31;18(8):1141. doi: 10.3390/ph18081141. Pharmaceuticals (Basel). 2025. PMID: 40872532 Free PMC article. Review.
-
Identification of ferroptosis-related molecular subtypes and a methylation-related ferroptosis gene prognostic signature in cervical squamous cell carcinoma.J Cancer Res Clin Oncol. 2023 Nov;149(16):14673-14689. doi: 10.1007/s00432-023-05267-z. Epub 2023 Aug 16. J Cancer Res Clin Oncol. 2023. PMID: 37584713 Free PMC article.
-
Predictive value of dendritic cell-related genes for prognosis and immunotherapy response in lung adenocarcinoma.Cancer Cell Int. 2025 Jan 14;25(1):13. doi: 10.1186/s12935-025-03642-z. Cancer Cell Int. 2025. PMID: 39810206 Free PMC article.
References
LinkOut - more resources
Full Text Sources
Research Materials
Miscellaneous