

Structural differences in 3C-like protease (Mpro) from SARS-CoV and SARS-CoV-2: molecular insights revealed by Molecular Dynamics Simulations
- PMID: 36467259
- PMCID: PMC9686461
- DOI: 10.1007/s11224-022-02089-6
Structural differences in 3C-like protease (Mpro) from SARS-CoV and SARS-CoV-2: molecular insights revealed by Molecular Dynamics Simulations
Abstract
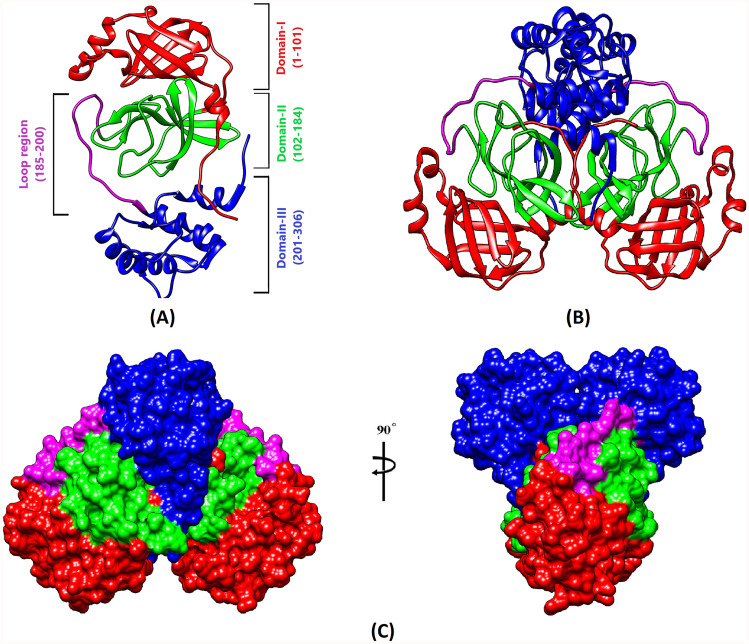
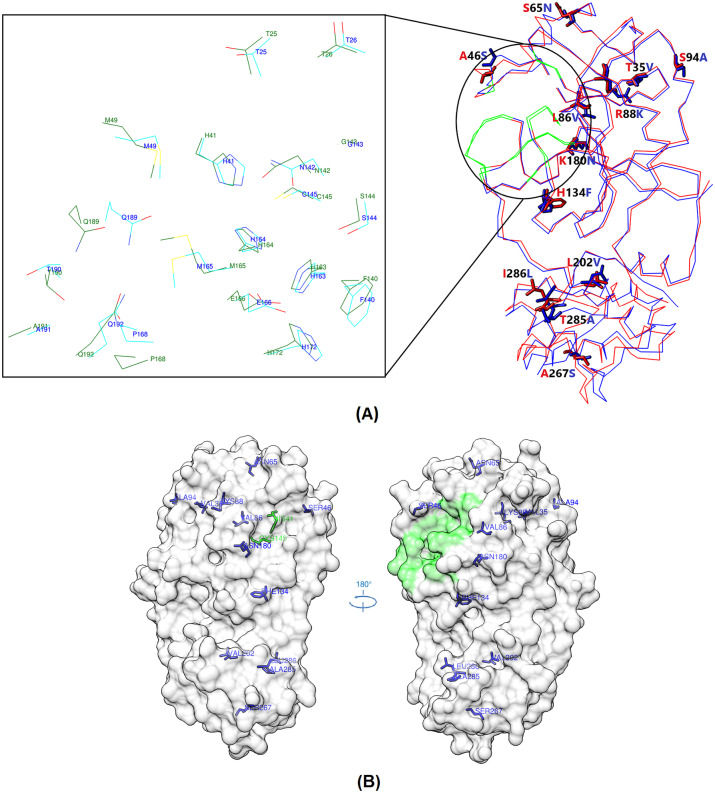
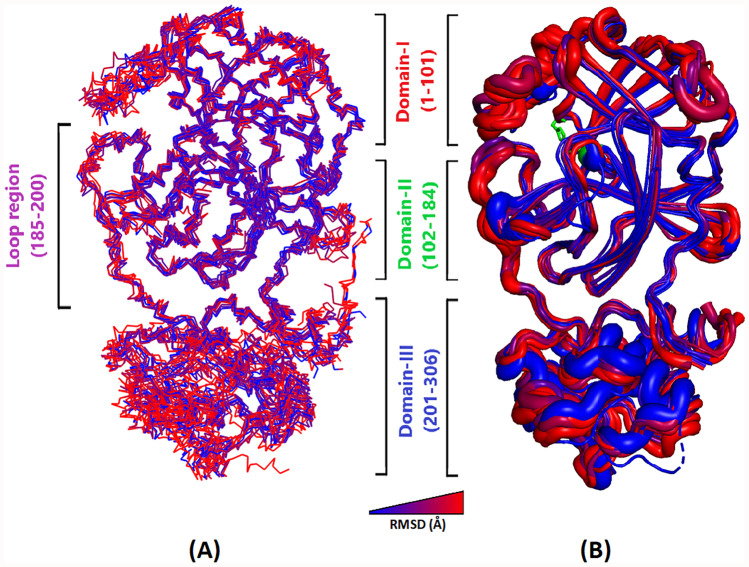
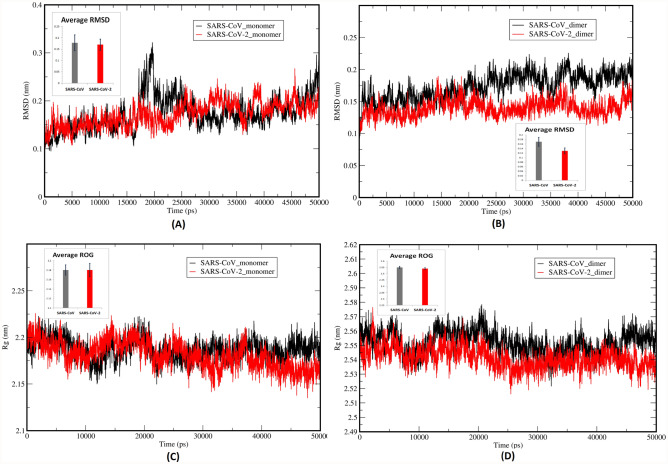
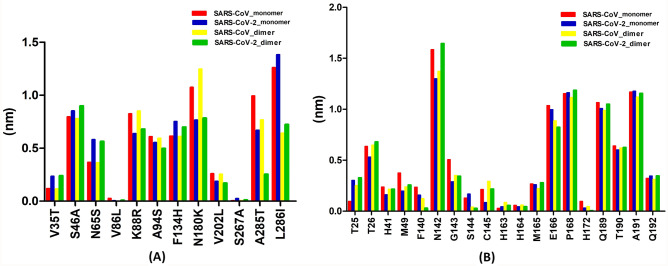
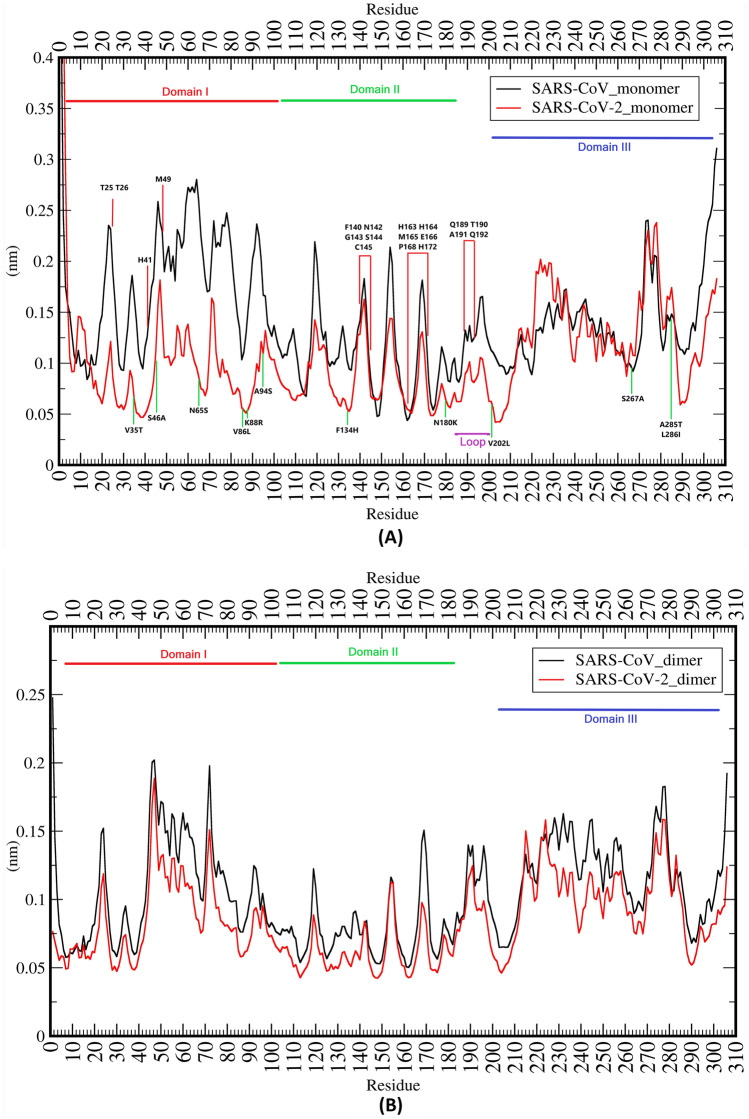
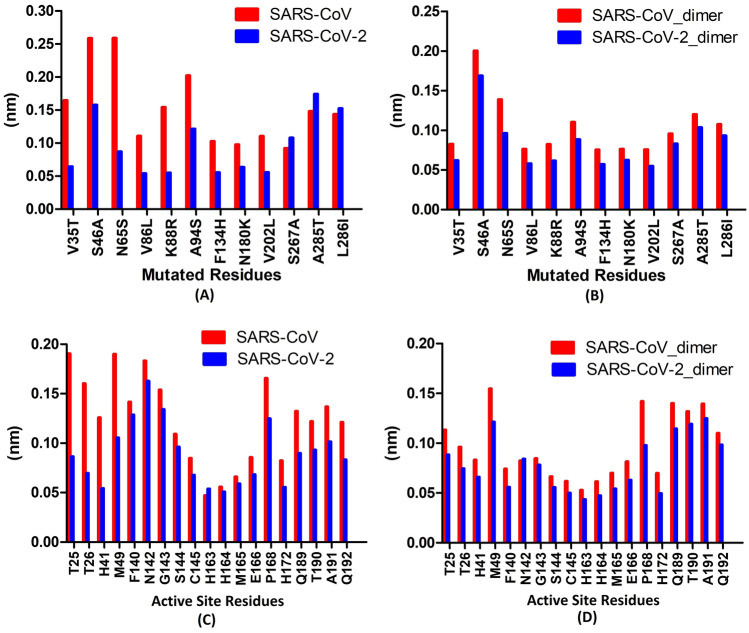
Novel coronavirus SARS-CoV-2 has infected millions of people with thousands of mortalities globally. The main protease (Mpro) is vital in processing replicase polyproteins. Both the CoV's Mpro shares 97% identity, with 12 mutations, but none are present in the active site. Although many therapeutics and vaccines are available to combat SARS-CoV-2, these treatments may not be practical due to their high mutational rate. On the other hand, Mpro has a high degree of conservation throughout variants, making Mpro a stout drug target. Here, we report a detailed comparison of both the monomeric Mpro and the biologically active dimeric Mpro using MD simulation to understand the impact of the 12 divergent residues (T35V, A46S, S65N, L86V, R88K, S94A, H134F, K180N, L202V, A267S, T285A and I286L) on the molecular microenvironment and the interaction between crucial residues. The present study concluded that the change in the microenvironment of residues at the entrance (T25, T26, M49 and Q189), near the catalytic site (F140, H163, H164, M165 and H172) and in the substrate-binding site (V35, N65, K88 and N180) is due to 12 mutations in the SARS-CoV-2 Mpro. Furthermore, the involvement of F140, E166 and H172 residues in dimerization stabilizes the Mpro dimer, which should be considered. We anticipate that networks and microenvironment changes identified here might guide repurposing attempts and optimization of new Mpro inhibitors.
Supplementary information: The online version contains supplementary material available at 10.1007/s11224-022-02089-6.
Keywords: 3C-like proteases; COVID-19; Drug repurposing; Molecular dynamics; Mpro; SARS-CoV-2.
© The Author(s), under exclusive licence to Springer Science+Business Media, LLC, part of Springer Nature 2022, Springer Nature or its licensor (e.g. a society or other partner) holds exclusive rights to this article under a publishing agreement with the author(s) or other rightsholder(s); author self-archiving of the accepted manuscript version of this article is solely governed by the terms of such publishing agreement and applicable law.
Conflict of interest statement
Competing interestsThe authors declare no competing interests.
Figures
Similar articles
-
Impact of dimerization and N3 binding on molecular dynamics of SARS-CoV and SARS-CoV-2 main proteases.J Biomol Struct Dyn. 2022 Sep;40(14):6243-6254. doi: 10.1080/07391102.2021.1880481. Epub 2021 Feb 2. J Biomol Struct Dyn. 2022. PMID: 33525993 Free PMC article.
-
Biflavonoids from Rhus succedanea as probable natural inhibitors against SARS-CoV-2: a molecular docking and molecular dynamics approach.J Biomol Struct Dyn. 2022 Jul;40(10):4376-4388. doi: 10.1080/07391102.2020.1858165. Epub 2020 Dec 10. J Biomol Struct Dyn. 2022. PMID: 33300454 Free PMC article.
-
Binding mechanism of inhibitors to SARS-CoV-2 main protease deciphered by multiple replica molecular dynamics simulations.Phys Chem Chem Phys. 2022 Jan 19;24(3):1743-1759. doi: 10.1039/d1cp04361g. Phys Chem Chem Phys. 2022. PMID: 34985081
-
Identification of polyphenols from Broussonetia papyrifera as SARS CoV-2 main protease inhibitors using in silico docking and molecular dynamics simulation approaches.J Biomol Struct Dyn. 2021 Oct;39(17):6747-6760. doi: 10.1080/07391102.2020.1802347. Epub 2020 Aug 7. J Biomol Struct Dyn. 2021. PMID: 32762411 Free PMC article.
-
Potential Resistance of SARS-CoV-2 Main Protease (Mpro) against Protease Inhibitors: Lessons Learned from HIV-1 Protease.Int J Mol Sci. 2022 Mar 23;23(7):3507. doi: 10.3390/ijms23073507. Int J Mol Sci. 2022. PMID: 35408866 Free PMC article. Review.
Cited by
-
A potential allosteric inhibitor of SARS-CoV-2 main protease (Mpro) identified through metastable state analysis.Front Mol Biosci. 2024 Sep 6;11:1451280. doi: 10.3389/fmolb.2024.1451280. eCollection 2024. Front Mol Biosci. 2024. PMID: 39310374 Free PMC article.
-
The Main Protease of Middle East Respiratory Syndrome Coronavirus Induces Cleavage of Mitochondrial Antiviral Signaling Protein to Antagonize the Innate Immune Response.Viruses. 2024 Feb 5;16(2):256. doi: 10.3390/v16020256. Viruses. 2024. PMID: 38400032 Free PMC article.
-
Alpha-helices as alignment reporters in residual dipolar coupling analysis of proteins.J Biomol NMR. 2025 Mar;79(1):47-57. doi: 10.1007/s10858-024-00456-5. Epub 2024 Dec 11. J Biomol NMR. 2025. PMID: 39661299 Free PMC article.
-
Identification of promising SARS-CoV-2 main protease inhibitor through molecular docking, dynamics simulation, and ADMET analysis.Sci Rep. 2025 Jan 22;15(1):2830. doi: 10.1038/s41598-025-86016-9. Sci Rep. 2025. PMID: 39843610 Free PMC article.
-
Development of potent and effective SARS-CoV-2 main protease inhibitors based on maleimide analogs for the potential treatment of COVID-19.J Enzyme Inhib Med Chem. 2024 Dec;39(1):2290910. doi: 10.1080/14756366.2023.2290910. Epub 2023 Dec 13. J Enzyme Inhib Med Chem. 2024. PMID: 38093611 Free PMC article.
References
-
- Zhou P, Yang X-L, Wang X-G et al (2020) Discovery of a novel coronavirus associated with the recent pneumonia outbreak in humans and its potential bat origin. bioRxiv. 10.1101/2020.01.22.914952
LinkOut - more resources
Full Text Sources
Miscellaneous