

Declined adipogenic potential of senescent MSCs due to shift in insulin signaling and altered exosome cargo
- PMID: 36467400
- PMCID: PMC9714334
- DOI: 10.3389/fcell.2022.1050489
Declined adipogenic potential of senescent MSCs due to shift in insulin signaling and altered exosome cargo
Erratum in
-
Corrigendum: Declined adipogenic potential of senescent MSCs due to shift in insulin signaling and altered exosome cargo.Front Cell Dev Biol. 2023 Jan 31;11:1146895. doi: 10.3389/fcell.2023.1146895. eCollection 2023. Front Cell Dev Biol. 2023. PMID: 36798095 Free PMC article.
Abstract
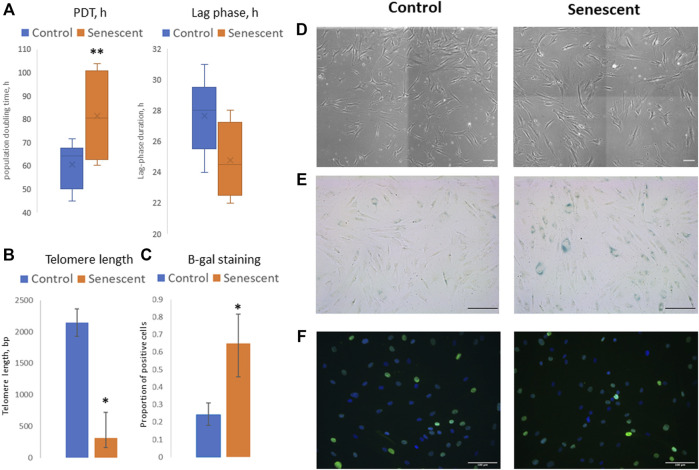
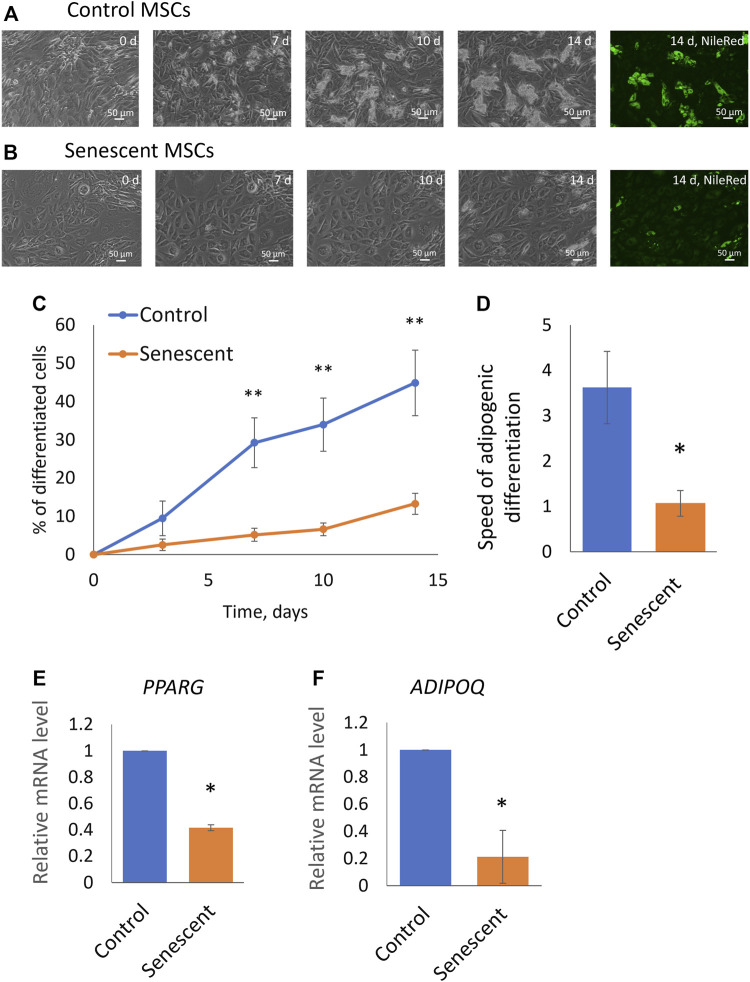
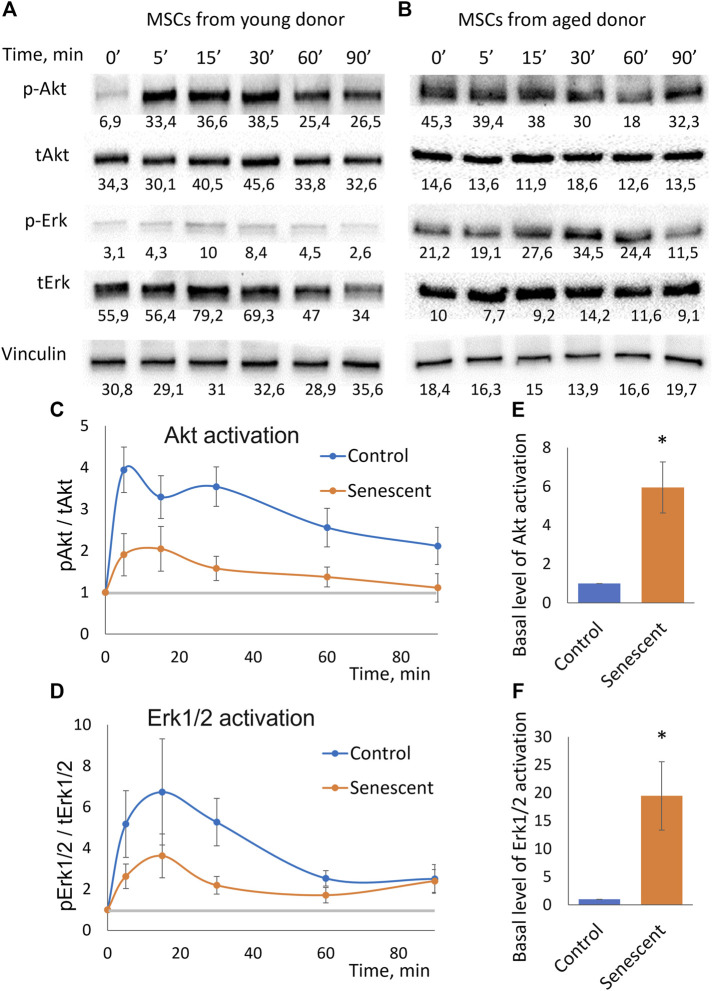
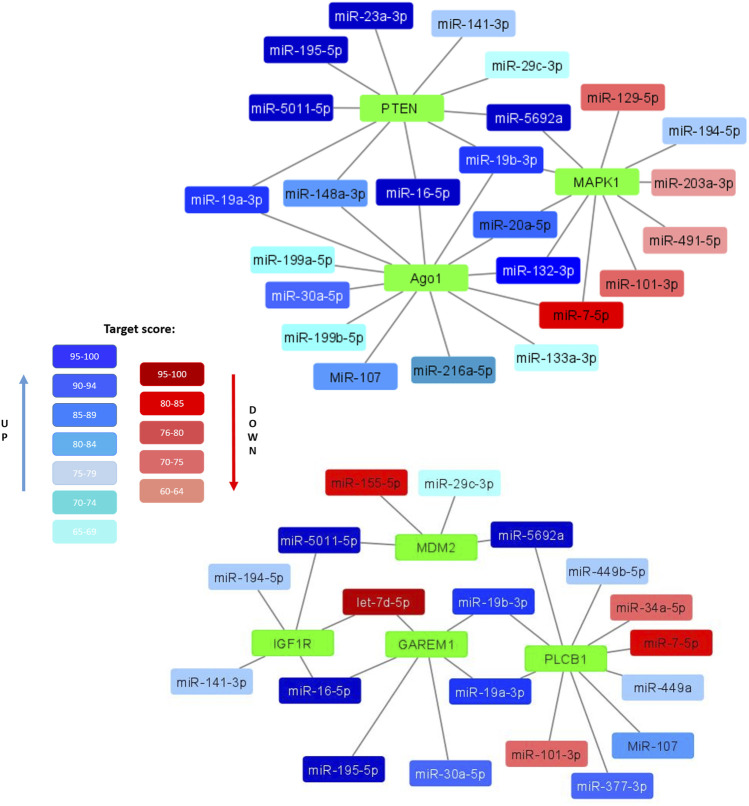
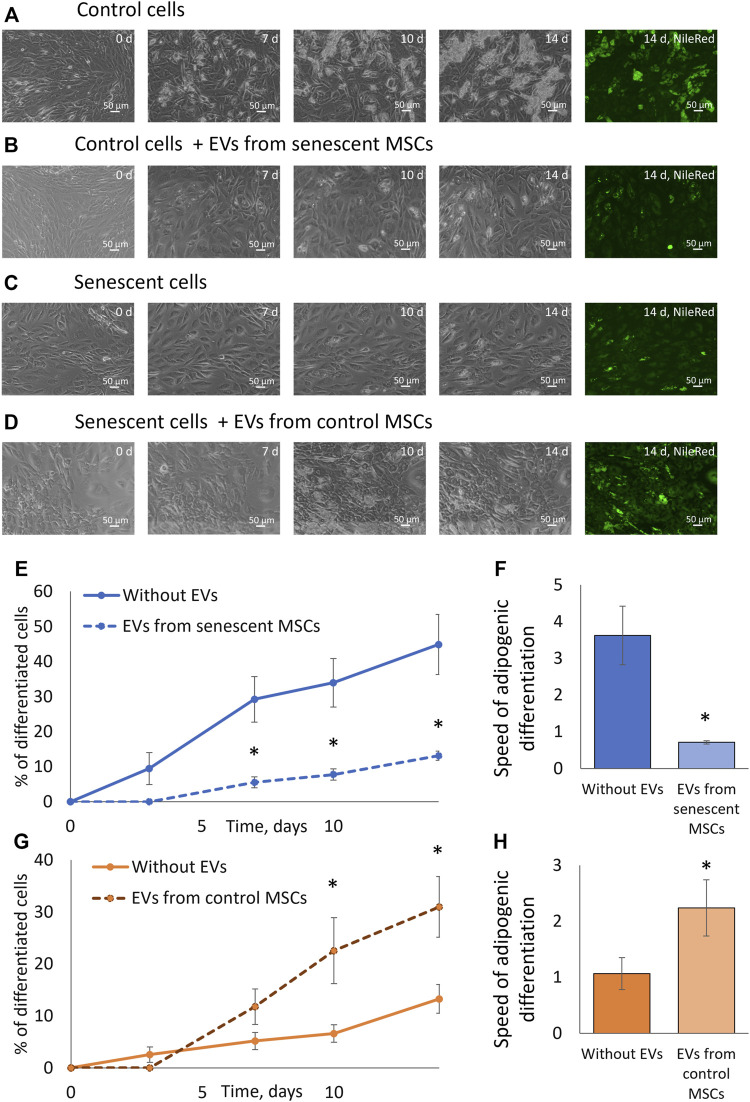
Multipotent mesenchymal stromal cells (MSCs) maintain cellular homeostasis and regulate tissue renewal and repair both by differentiating into mesodermal lineage, e.g., adipocytes, or managing the functions of differentiated cells. Insulin is a key physiological inducer of MSC differentiation into adipocytes, and disturbances in MSC insulin sensitivity could negatively affect adipose tissue renewal. During aging, regulation and renewal of adipose tissue cells may be disrupted due to the altered insulin signaling and differentiation potential of senescent MSCs, promoting the development of serious metabolic diseases, including metabolic syndrome and obesity. However, the potential mechanisms mediating the dysfunction of adipose-derived senescent MSC remains unclear. We explored whether aging could affect the adipogenic potential of human adipose tissue-derived MSCs regulated by insulin. Age-associated senescent MSCs (isolated from donors older than 65 years) and MSCs in replicative senescence (long-term culture) were treated by insulin to induce adipogenic differentiation, and the efficiency of the process was compared to MSCs from young donors. Insulin-dependent signaling pathways were explored in these cells. We also analyzed the involvement of extracellular vesicles secreted by MSCs (MSC-EVs) into the regulation of adipogenic differentiation and insulin signaling of control and senescent cells. Also the microRNA profiles of MSC-EVs from aged and young donors were compared using targeted PCR arrays. Both replicatively and chronologically senescent MSCs showed a noticeably decreased adipogenic potential. This was associated with insulin resistance of MSCs from aged donors caused by the increase in the basal level of activation of crucial insulin-dependent intracellular effectors ERK1/2 and Akt. To assess the impact of the paracrine cross-talk of MSCs, we analyzed microRNAs profile differences in MSC-EVs and revealed that senescent MSCs produced EVs with increased content of miRNAs targeting components of insulin-dependent signaling cascade PTEN, MAPK1, GAREM1 and some other targets. We also confirmed these data by differentiation of control MSCs in the presence of EVs from senescent cells and vice versa. Thus, aging attenuated the adipogenic potential of MSCs due to autocrine or paracrine-dependent induction of insulin resistance associated with the specific changes in MSC-EV cargo.
Keywords: MSCs (mesenchymal stromal cells); adipogenic potential; extracellular vesicles (EVs); insulin signaling; senescence.
Copyright © 2022 Voynova, Kulebyakin, Grigorieva, Novoseletskaya, Basalova, Alexandrushkina, Arbatskiy, Vigovskiy, Sorokina, Zinoveva, Bakhchinyan, Kalinina, Akopyan, Tkachuk, Tyurin-Kuzmin and Efimenko.
Conflict of interest statement
The authors declare that the research was conducted in the absence of any commercial or financial relationships that could be construed as a potential conflict of interest.
Figures
Similar articles
-
Extracellular Vesicles of Adipose Multipotent Mesenchymal Stromal Cells Propagate Senescent Phenotype by Affecting PTEN Nuclear Import.Int J Mol Sci. 2025 Jul 24;26(15):7164. doi: 10.3390/ijms26157164. Int J Mol Sci. 2025. PMID: 40806296 Free PMC article.
-
Human multipotent mesenchymal stromal cells cytokine priming promotes RAB27B-regulated secretion of small extracellular vesicles with immunomodulatory cargo.Stem Cell Res Ther. 2020 Dec 14;11(1):539. doi: 10.1186/s13287-020-02050-6. Stem Cell Res Ther. 2020. PMID: 33317598 Free PMC article.
-
Corrigendum: Declined adipogenic potential of senescent MSCs due to shift in insulin signaling and altered exosome cargo.Front Cell Dev Biol. 2023 Jan 31;11:1146895. doi: 10.3389/fcell.2023.1146895. eCollection 2023. Front Cell Dev Biol. 2023. PMID: 36798095 Free PMC article.
-
Mesenchymal Stem Cell-Derived Extracellular Vesicles in Tissue Regeneration.Cell Transplant. 2020 Jan-Dec;29:963689720908500. doi: 10.1177/0963689720908500. Cell Transplant. 2020. PMID: 32207341 Free PMC article. Review.
-
Mesenchymal stromal cell-derived extracellular vesicles: regenerative and immunomodulatory effects and potential applications in sepsis.Cell Tissue Res. 2018 Oct;374(1):1-15. doi: 10.1007/s00441-018-2871-5. Epub 2018 Jun 28. Cell Tissue Res. 2018. PMID: 29955951 Review.
Cited by
-
M2-Macrophage-Induced Chronic Inflammation Promotes Reversible Mesenchymal Stromal Cell Senescence and Reduces Their Anti-Fibrotic Properties.Int J Mol Sci. 2023 Dec 4;24(23):17089. doi: 10.3390/ijms242317089. Int J Mol Sci. 2023. PMID: 38069411 Free PMC article.
-
Extracellular Vesicles of Adipose Multipotent Mesenchymal Stromal Cells Propagate Senescent Phenotype by Affecting PTEN Nuclear Import.Int J Mol Sci. 2025 Jul 24;26(15):7164. doi: 10.3390/ijms26157164. Int J Mol Sci. 2025. PMID: 40806296 Free PMC article.
-
Recent trends of stem cell therapies in the management of orthopedic surgical challenges.Int J Surg. 2024 Oct 1;110(10):6330-6344. doi: 10.1097/JS9.0000000000001524. Int J Surg. 2024. PMID: 38716973 Free PMC article. Review.
-
Treating Metabolic Dysregulation and Senescence by Caloric Restriction: Killing Two Birds with One Stone?Antioxidants (Basel). 2025 Jan 16;14(1):99. doi: 10.3390/antiox14010099. Antioxidants (Basel). 2025. PMID: 39857433 Free PMC article. Review.
-
Clinical Potential of Mesenchymal Stem Cell-Derived Exosomes in Bone Regeneration.J Clin Med. 2023 Jun 29;12(13):4385. doi: 10.3390/jcm12134385. J Clin Med. 2023. PMID: 37445420 Free PMC article. Review.
References
-
- Basalova N., Sagaradze G., Arbatskiy M., Evtushenko E., Kulebyakin K., Grigorieva O., et al. (2020). Secretome of mesenchymal stromal cells prevents myofibroblasts differentiation by transferring fibrosis-associated microRNAs within extracellular vesicles. Cells 9 (5), 1272. 10.3390/cells9051272 - DOI - PMC - PubMed
LinkOut - more resources
Full Text Sources
Research Materials
Miscellaneous