

Intranasally Co-administered Berberine and Curcumin Loaded in Transfersomal Vesicles Improved Inhibition of Amyloid Formation and BACE-1
- PMID: 36467923
- PMCID: PMC9713875
- DOI: 10.1021/acsomega.2c06215
Intranasally Co-administered Berberine and Curcumin Loaded in Transfersomal Vesicles Improved Inhibition of Amyloid Formation and BACE-1
Retraction in
-
Retraction of "Intranasally Co-administered Berberine and Curcumin Loaded in Transfersomal Vesicles Improved Inhibition of Amyloid Formation and BACE-1".ACS Omega. 2025 Jul 7;10(28):31207. doi: 10.1021/acsomega.5c05629. eCollection 2025 Jul 22. ACS Omega. 2025. PMID: 40727736 Free PMC article.
Abstract
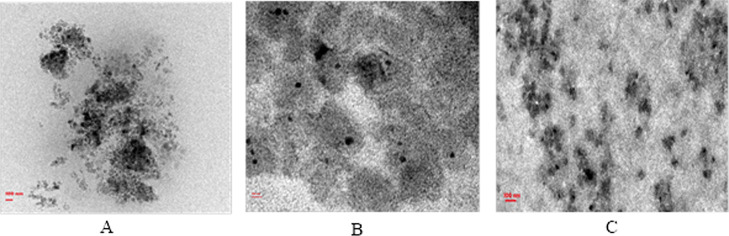
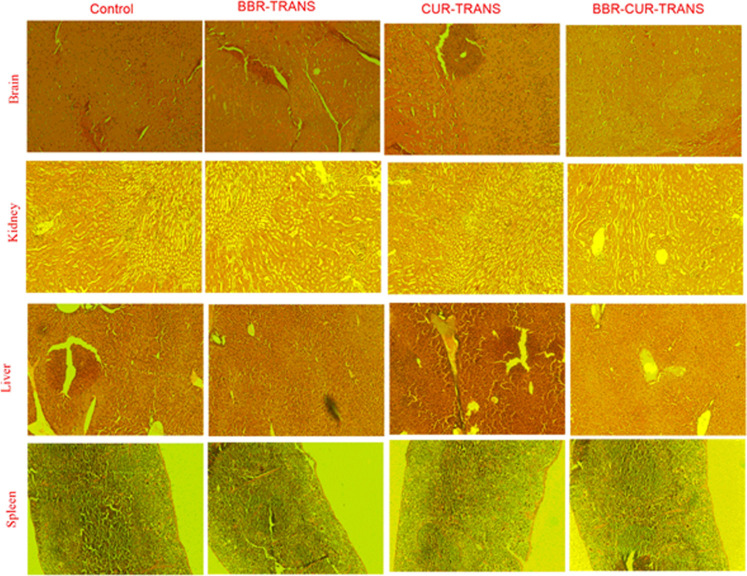
Selective permeability of the blood-brain barrier restricts the treatment efficacy of neurologic diseases. Berberine (BBR) and curcumin (CUR)-loaded transferosomes (TRANS) were prepared for the effective management of Alzheimer's disease (AD). The study involved the syntheses of BBR-TRANS, CUR-TRANS, and BBR-CUR-TRANS by the film hydration method. Vesicles were characterized to ensure the formation of drug-loaded vesicles and their in vivo performance. The particle sizes of BBR-TRANS, CUR-TRANS, and BBR-CUR-TRANS were 139.2 ± 7, 143.4 ± 8, and 165.3 ± 6.5 nm, respectively. The presence of diffused rings in the SED image indicates the crystalline nature of the payload. Low surface roughness in an AFM image could be associated with the presence of a surface lipid. BBR-CUR-TRANS showed 41.03 ± 1.22 and 47.79 ± 3.67% release of BBR and 19.22 ± 1.47 and 24.67 ± 1.94% release of CUR, respectively, in phosphate buffer saline (pH 7.4) and acetate buffer (pH 4.0). Formulations showed sustained release of both loaded drugs. BBR-TRANS, CUR-TRANS, and BBR-CUR-TRANS exhibited a lower percentage of hemolysis than pure BBR and CUR, indicating the safety of the payload from delivery vesicles. Lower percentages of binding were recorded from BBR-CUR-TRANS than BBR-TRANS and CUR-TRANS. Acetylcholinesterase inhibition activity of the prepared transferosomes was greater than that of pure drugs, which are thought to have good cellular penetration. The spatial memory was improved in treated mice models. The level of malondialdehyde decreased in AD animals treated with BBR-TRANS, CUR-TRANS, and BBR-CUR-TRANS, respectively, as compared to the scopolamine-induced AD animals. BBR-CUR-TRANS-treated animals showed the highest decrease in the NO level. The catalase level was significantly restored in scopolamine-intoxicated animals treated with BBR-TRANS, CUR-TRANS, and BBR-CUR-TRANS. The immunohistochemistry result suggested that the BBR-TRANS, CUR-TRANS, and BBR-CUR-TRANS have significantly decreased the regulation of expression of BACE-1 through antioxidant activity. In conclusion, the study highlights the utility of formulated transferosomes as promising carriers for the co-delivery of drugs to the brain.
© 2022 The Authors. Published by American Chemical Society.
Conflict of interest statement
The authors declare no competing financial interest.
Figures


Similar articles
-
The Black Book of Psychotropic Dosing and Monitoring.Psychopharmacol Bull. 2024 Jul 8;54(3):8-59. Psychopharmacol Bull. 2024. PMID: 38993656 Free PMC article. Review.
-
Systemic pharmacological treatments for chronic plaque psoriasis: a network meta-analysis.Cochrane Database Syst Rev. 2017 Dec 22;12(12):CD011535. doi: 10.1002/14651858.CD011535.pub2. Cochrane Database Syst Rev. 2017. Update in: Cochrane Database Syst Rev. 2020 Jan 9;1:CD011535. doi: 10.1002/14651858.CD011535.pub3. PMID: 29271481 Free PMC article. Updated.
-
Sertindole for schizophrenia.Cochrane Database Syst Rev. 2005 Jul 20;2005(3):CD001715. doi: 10.1002/14651858.CD001715.pub2. Cochrane Database Syst Rev. 2005. PMID: 16034864 Free PMC article.
-
Treatment of Inflammatory Bowel Disease by Using Curcumin-Containing Self-Microemulsifying Delivery System: Macroscopic and Microscopic Analysis.Pharmaceutics. 2024 Oct 31;16(11):1406. doi: 10.3390/pharmaceutics16111406. Pharmaceutics. 2024. PMID: 39598530 Free PMC article.
-
Curcumin and Berberine Arrest Maturation and Activation of Dendritic Cells Derived from Lupus Erythematosus Patients.Curr Mol Pharmacol. 2024;17:e18761429249908. doi: 10.2174/0118761429249908231221080806. Curr Mol Pharmacol. 2024. PMID: 38284733
Cited by
-
Development of Epigallocatechin and Ascorbic Acid Dual Delivery Transferosomes for Managing Alzheimer's Disease: In Vitro and in Vivo Studies.ACS Omega. 2024 Aug 7;9(33):35463-35474. doi: 10.1021/acsomega.4c02140. eCollection 2024 Aug 20. ACS Omega. 2024. PMID: 39184506 Free PMC article.
-
Berberine HCl and diacerein loaded dual delivery transferosomes: Formulation and optimization using Box-Behnken design.ADMET DMPK. 2024 Apr 29;12(3):553-580. doi: 10.5599/admet.2268. eCollection 2024. ADMET DMPK. 2024. PMID: 39091899 Free PMC article.
-
Application of Natural Products in Neurodegenerative Diseases by Intranasal Administration: A Review.Pharmaceutics. 2025 May 20;17(5):675. doi: 10.3390/pharmaceutics17050675. Pharmaceutics. 2025. PMID: 40430965 Free PMC article. Review.
-
The Nasal-Brain Drug Delivery Route: Mechanisms and Applications to Central Nervous System Diseases.MedComm (2020). 2025 Jun 6;6(6):e70213. doi: 10.1002/mco2.70213. eCollection 2025 Jun. MedComm (2020). 2025. PMID: 40487748 Free PMC article. Review.
-
Liposome-Derived Nanosystems for the Treatment of Behavioral and Neurodegenerative Diseases: The Promise of Niosomes, Transfersomes, and Ethosomes for Increased Brain Drug Bioavailability.Pharmaceuticals (Basel). 2023 Oct 8;16(10):1424. doi: 10.3390/ph16101424. Pharmaceuticals (Basel). 2023. PMID: 37895895 Free PMC article. Review.
References
-
- Singh A. K.; Mishra G.; Maurya A.; Awasthi R.; Kumari K.; Thakur A.; Rai S. K.; Rai G. K.; Sharma B.; Kulkarni G. T.; Singh S. K. Role of TREM2 in Alzheimer’s Disease and its Consequences on β-Amyloid, Tau and Neurofibrillary Tangles. Curr. Alzheimer Res. 2019, 16, 1216–1229. 10.2174/1567205016666190903102822. - DOI - PubMed
-
- Broster L. S.; Li J.; Wagner B.; Smith C. D.; Jicha G. A.; Schmitt F. A.; Munro N.; Haney R. H.; Jiang Y. Spared behavioral repetition effects in Alzheimer’s disease linked to an altered neural mechanism at posterior cortex. J. Clin. Exp. Neuropsychol. 2018, 40, 761–776. 10.1080/13803395.2018.1430230. - DOI - PMC - PubMed
-
- Frost P. S.; Barros-Aragão F.; da Silva R. T.; Venancio A.; Matias I.; Lyra E Silva N. M.; Kincheski G. C.; Pimentel-Coelho P. M.; De Felice F. G.; Gomes F. C.; Ferreira S. T.; Figueiredo C. P.; Clarke J. R. Neonatal infection leads to increased susceptibility to Aβ oligomer-induced brain inflammation, synapse loss and cognitive impairment in mice. Cell Death Dis. 2019, 10, 323. 10.1038/s41419-019-1529-x. - DOI - PMC - PubMed
Publication types
LinkOut - more resources
Full Text Sources
Miscellaneous
