. 2022 Nov 17:13:1010048.
doi: 10.3389/fgene.2022.1010048. eCollection 2022.

miRNA-mRNA-protein dysregulated network in COPD in women

Affiliations

miRNA-mRNA-protein dysregulated network in COPD in women

Chuan Xing Li et al. Front Genet. .

Abstract

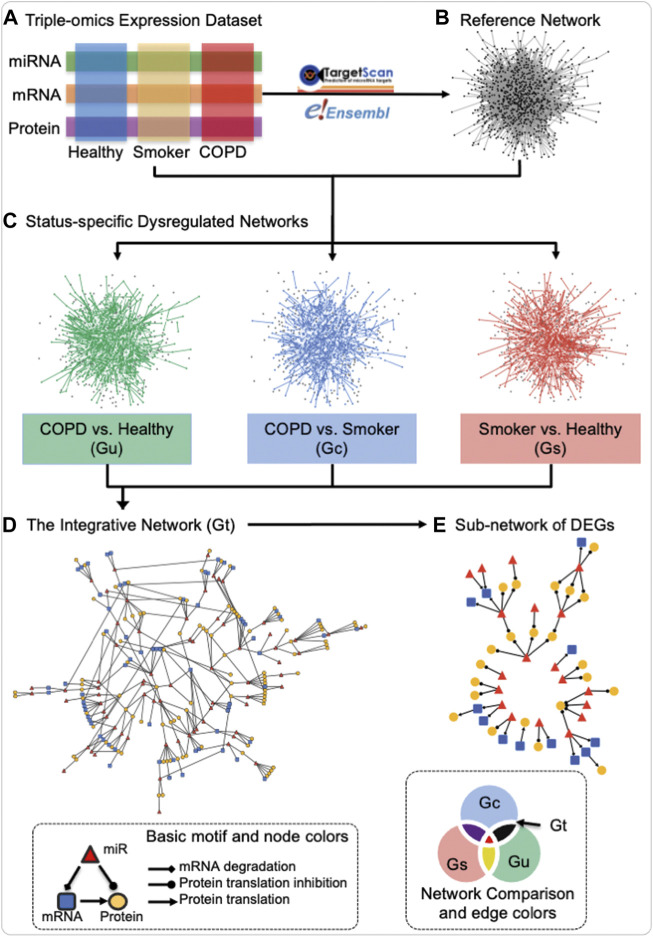
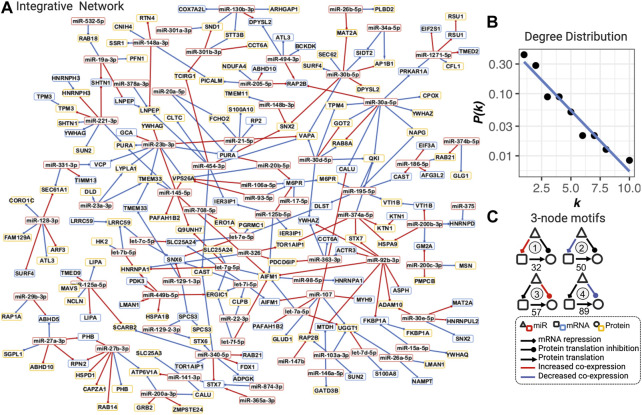
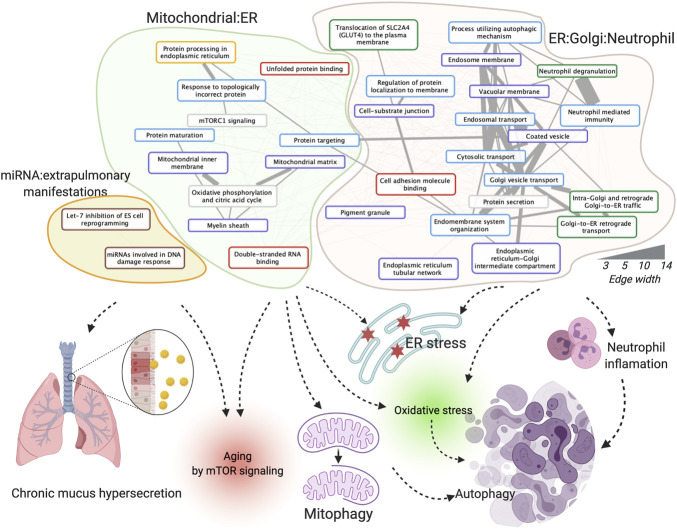
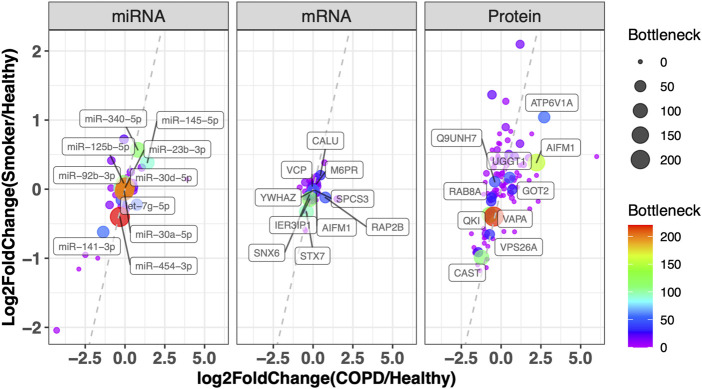
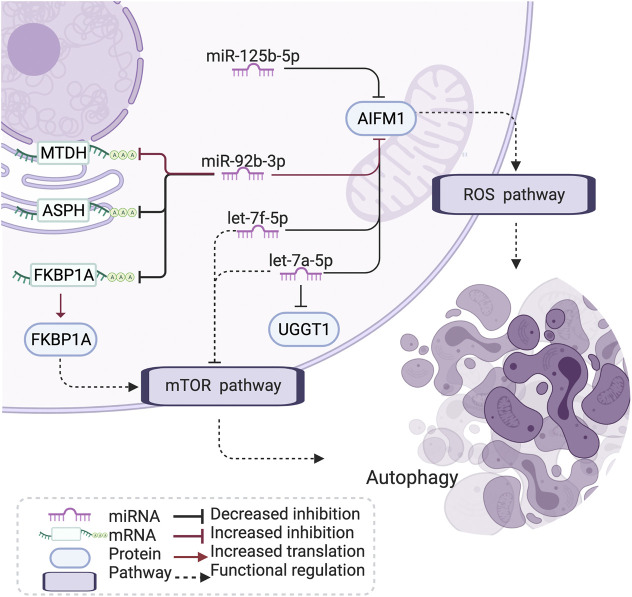
Rationale: Chronic obstructive pulmonary disease (COPD) is a complex disease caused by a multitude of underlying mechanisms, and molecular mechanistic modeling of COPD, especially at a multi-molecular level, is needed to facilitate the development of molecular diagnostic and prognostic tools and efficacious treatments. Objectives: To investigate the miRNA-mRNA-protein dysregulated network to facilitate prediction of biomarkers and disease subnetwork in COPD in women. Measurements and Results: Three omics data blocks (mRNA, miRNA, and protein) collected from BAL cells from female current-smoker COPD patients, smokers with normal lung function, and healthy never-smokers were integrated with miRNA-mRNA-protein regulatory networks to construct a COPD-specific dysregulated network. Furthermore, downstream network topology, literature annotation, and functional enrichment analysis identified both known and novel disease-related biomarkers and pathways. Both abnormal regulations in miRNA-induced mRNA transcription and protein translation repression play roles in COPD. Finally, the let-7-AIFM1-FKBP1A pathway is highlighted in COPD pathology. Conclusion: For the first time, a comprehensive miRNA-mRNA-protein dysregulated network of primary immune cells from the lung related to COPD in females was constructed to elucidate specific biomarkers and disease pathways. The multi-omics network provides a new molecular insight from a multi-molecular aspect and highlights dysregulated interactions. The highlighted let-7-AIFM1-FKBP1A pathway also indicates new hypotheses of COPD pathology.

Keywords: chronic obstructive pulmonary disease; miRNA; miRNA dysregulation; miRNA–mRNA–protein network; multi-omics integration.


Conflict of interest statement

The authors declare that the research was conducted in the absence of any commercial or financial relationships that could be construed as a potential conflict of interest.

Figures

FIGURE 1
FIGURE 1
Schematic of the construction of the miRNA–mRNA–protein dysregulation network. Three data modalities (miRNA, mRNA, and protein) from the three groups of healthy never-smokers (healthy), current-smokers with mild-to-moderate COPD (COPD), and smokers with normal lung function (smokers) (A) were utilized for the construction of a reference network by mapping miRNA to mRNA regulation and mRNA to protein translation in TargetScan and Ensembl databases (B), resulting in the union of three-node basic motifs (bottom left inset). Status-specific dysregulated networks from each contrast of interest were then extracted from differentially co-expressed interactions in each status comparison (C) An integrative dysregulated network (D) was then constructed using the network set operation illustrated in “Network Comparison” (bottom right inset), where Gt (black) represents the main contrast of interest for this investigation, namely, the difference between the “status-specific dysregulated networks” in “COPD vs. healthy” (Gu) and “smoker vs. healthy” (Gs), when intersected with the network of “COPD vs. smokers” (Gc). Finally, sub-networks containing differentially expressed genes (DEGs) were extracted for further investigation (E) In “Basic motif and node colors,” the node and edge shapes applied to all panels and the node colors used that of panel d and (E) In “Network Comparison and edge colors,” the colors for different networks corresponded to both edge and node in panel (C) The edge and node colors are grey and black in Reference Network of panel (B) Created using igraph in R and Cytoscape.
FIGURE 2
FIGURE 2
Integrative dysregulated network (A), its degree distribution (B), and three-node motifs and their counts (C). (A) Integrative dysregulated network is a directed network from miRNA to mRNA, mRNA to protein, or from miRNA to protein (see legend inset, bottom right). Nodes with red, blue, and yellow borders represent miRNA, mRNA, and protein, respectively. Red and blue edges mean increased or decreased co-expression between COPD and smokers, respectively. The full network with the dynamic layout and searchable gene names and functions in the HTML format is available at https://chuanxingli.github.io/pages/Sharing/FigS3.html and in Supplementary Figure S3. (B) Power-law degree distribution with the linear regression of degree (k) ∼ the probability of degree (P(k) in log10 scale) of linear regression R-squared = 0.943, p-value = 8.19*10–6. (C) Four major types of three-node motifs and their counts in the integrative network. Motifs 1 and 2 mean miRNAs significantly (FDR<=0.2) increased or decreased the regulation of mRNA transcription repression in COPD vs. smoker, respectively. Motifs 3 and 4 mean miRNAs significantly (FDR ≤0.2) increased or decreased the regulation of protein expression (potential protein translation inhibition) in COPD vs. smoker, respectively. The number under the motif is their count in the integrative regulated network. Created using igraph and Cytoscape. The full names of genes are provided in Supplementary Table S2.
FIGURE 3
FIGURE 3
Enriched functions, function clusters, and their potential roles in COPD. The board colors of function terms are Hallmark50 (grey), Gene Ontology (GO) biological process (blue), GO cellular component (purple), GO molecular function (red), KEGG pathway (yellow), Reactome pathway (green), and WikiPathway (brown). The width of the edges corresponds to the number of co-annotated genes. Created using igraph, Cytoscape, and BioRender.com.
FIGURE 4
FIGURE 4
Prioritization of disease genes by topological character in the network and DEG in COPD. Plot of miRNA, mRNA, and protein with their log2 fold change in COPD vs. healthy (x-axis) and smoker vs. healthy (y-axis). The color and node size correspond to their bottleneck values in the Integrative Network. The symbols of the top 10 miRNAs, mRNAs, and proteins with the highest bottleneck values are labeled (the full node characters in the network and differentially expressed tests are provided in Supplementary Table S2). VCP: valosin-containing protein; YWHAZ: tyrosine 3-monooxygenase/tryptophan 5-monooxygenase activation protein, zeta; CALU: calumenin; SNX6: sorting nexin 6; M6PR: mannose-6-phosphate receptor, cation-dependent; IER3IP1: immediate early response 3-interacting protein 1; SPCS3: signal peptidase complex subunit 3; RAP2B: RAP2B, member of the RAS oncogene family; STX7: syntaxin 7; AIFM1: apoptosis-inducing factor mitochondria-associated 1; ATP6V1A: ATPase H+-transporting V1 subunit A; Q9UNH7: sorting nexin 6; UGGT1: UDP-glucose:glycoprotein glucosyltransferase 1; RAB8A: Ras-related protein Rab-8A; GOT2: glutamic oxaloacetic transaminase 2; QKI: quaking; VAPA: virulence-associated protein A; VPS26A: vacuolar protein sorting-associated protein 26a; CAST: calpastatin.
FIGURE 5
FIGURE 5
Let-7-AIFM1-FKBP1A pathway and its potential effect in COPD. The let-7 family has an increased correlation with AIFM1 protein expression in COPD, which may induce a stronger inhibition than through the ROS and mTOR pathway to influence autophagy and cell differentiation in COPD. AIFM1: apoptosis-inducing factor mitochondria-associated 1, FKBP1: FKBP prolyl isomerase 1A, MTDH: metadherin, ASPH: aspartate β-hydroxylase, UGGT1: UDP-glucose:glycoprotein glucosyltransferase 1, ROS: reactive oxygen species, mTOR: mammalian target of rapamycin, COPD: chronic obstructive pulmonary disease. Created using BioRender.com.

Similar articles

Cited by

References

    1. Agarwal V., Bell G. W., Nam J. W., Bartel D. P. (2015). Predicting effective microRNA target sites in mammalian mRNAs. Elife 4. 10.7554/eLife.05005 - DOI - PMC - PubMed
    1. Araki K., Turner A. P., Shaffer V. O., Gangappa S., Keller S. A., Bachmann M. F., et al. (2009). mTOR regulates memory CD8 T-cell differentiation. Nature 460 (7251), 108–112. 10.1038/nature08155 - DOI - PMC - PubMed
    1. Ashburner M., Ball C. A., Blake J. A., Botstein D., Butler H., Cherry J. M., et al. (2000). Gene ontology: Tool for the unification of biology. The gene ontology consortium. Nat. Genet. 25 (1), 25–29. 10.1038/75556 - DOI - PMC - PubMed
    1. Babbi G., Martelli P. L., Profiti G., Bovo S., Savojardo C., Casadio R. (2017). eDGAR: a database of Disease-Gene Associations with annotated Relationships among genes. BMC Genomics 18, 554. 10.1186/s12864-017-3911-3 - DOI - PMC - PubMed
    1. Balgoma D., Yang M., Sjodin M., Snowden S., Karimi R., Levanen B., et al. (2016). Linoleic acid-derived lipid mediators increase in a female-dominated subphenotype of COPD. Eur. Respir. J. 47 (6), 1645–1656. 10.1183/13993003.01080-2015 - DOI - PubMed

LinkOut - more resources