. 2023 Feb;29(2):633-645.
doi: 10.1111/cns.14043. Epub 2022 Dec 5.

Effect of molecular hydrogen treatment on Sepsis-Associated encephalopathy in mice based on gut microbiota

Affiliations

Effect of molecular hydrogen treatment on Sepsis-Associated encephalopathy in mice based on gut microbiota

Qingqing Han et al. CNS Neurosci Ther. 2023 Feb.

Abstract

Introduction: In our experiments, male wild-type mice were randomly divided into four groups: the sham, SAE, SAE + 2% hydrogen gas inhalation (H2 ), and SAE + hydrogen-rich water (HW) groups. The feces of the mice were collected for 16 S rDNA analysis 24 h after the models were established, and the serum and brain tissue of the mice were collected for nontargeted metabolomics analysis.

Aim: Destruction of the intestinal microbiota is a risk factor for sepsis and subsequent organ dysfunction, and up to 70% of severely ill patients with sepsis exhibit varying degrees of sepsis-associated encephalopathy (SAE). The pathogenesis of SAE remains unclear. We aimed to explore the changes in gut microbiota in SAE and the regulatory mechanism of molecular hydrogen.

Results: Molecular hydrogen treatment significantly improved the functional outcome of SAE and downregulated inflammatory reactions in both the brain and the gut. In addition, molecular hydrogen treatment improved gut microbiota dysbiosis and partially amended metabolic disorder after SAE.

Conclusions: Molecular hydrogen treatment promotes functional outcomes after SAE in mice, which may be attributable to increasing beneficial bacteria, repressing harmful bacteria, and metabolic disorder, and reducing inflammation.

Keywords: gut microbiota; hydrogen gas (H2); hydrogen-rich water (HW); molecular hydrogen treatment; sepsis-associated encephalopathy (SAE).


Conflict of interest statement

The authors declare that they have no competing interests.

Figures
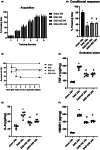
FIGURE 1
FIGURE 1
Effect of molecular hydrogen treatment on septic mice. The data plotted are the mean ± SD. (A) Training stage, (B) evaluation stage, (C) survival rate, (D) TNF‐α, (E) IL‐6, and (F) HMGB1 were measured by ELISA in each group (n = 6 mice per group). *p < 0.05 vs. sham group. #p < 0.05 vs. SAE group (n = 6 per group)
FIGURE 2
FIGURE 2
Effect of molecular hydrogen therapy on the gut microbiota of SAE mice. (A) The Venn diagram showed each group of unique and common OTUs. (B) PCoA shows differences between individuals or groups. The samples with high similarity of community structure tend to gather together, and the samples with large community differences tend to be far apart. Relative abundances of intestinal microbiota constituents at the (C) phylum and (D) genus levels in the sham, SAE, SAE + H2, and SAE + HW groups (n = 6 per group)
FIGURE 3
FIGURE 3
LEfSe analysis of gut microbiota. Cladogram of enriched taxa based on LEfSe determinations revealing significant differences in microbial communities between the (A) H2 and SAE groups and between the (B) HW and SAE groups (n = 6 per group). Bacterial taxa with an LDA score of >2 were selected as biomarker taxa (p, phylum level; c, class level; o, order level; f, family level; g, genus level).
FIGURE 4
FIGURE 4
OPLS‐DA of serum and brain in the SAE group after H2 and HW treatments. (A1, B1): SAE + H2 group. (A2, B2): SAE + HW group. OPLS‐DA of the serum (A1, A2) and brain (B1, B2) show that the cluster of metabolites was significantly separated between the SAE group and postmolecular hydrogen treatment.
FIGURE 5
FIGURE 5
Volcano plot of serum and brain sample data from the SAE group after H2 and HW treatments. (A1, B1): SAE + H2 group. (A2, B2): SAE + HW group. Univariate statistical analysis of the volcano plot shows the metabolite changes in the serum (A1, A2) and brain (B1, B2) between the SAE group and postmolecular hydrogen treatment
FIGURE 6
FIGURE 6
Negative ion mode significant difference brain metabolite analysis. (A) Significantly different metabolites. SAE + H2 group vs. SAE group (p < 0.05). (B) Significantly different metabolites. SAE + HW group vs. SAE group (p < 0.05)
FIGURE 7
FIGURE 7
KEGG pathways enriched analysis. (A) KEGG pathways enriched in the SAE group compared with the sham group. (B) KEGG pathways enriched in the SAE + HW group compared with the SAE group
FIGURE 8
FIGURE 8
Spearman correlation analysis network diagram and Hierarchical clustering heatmap showing the associations between the metabolites and gut microbiota. (A) Spearman correlation analysis network diagram. The circle represents the gut microbiota, and the rectangle represents the metabolites. The blue line represents a negative correlation, the red line represents a positive correlation, and the thickness of the line is proportional to the absolute value of the correlation coefficient. The node size positively correlates with its degree, that is, the greater the degree, the larger the node size. (B) Hierarchical clustering heatmap of differentially expressed gut microbiota and metabolites.

References

    1. Zhang LN, Wang XT, Ai YH, Guo QL, Huang L, Liu ZY. Epidemiological features and risk factors of sepsis‐associated encephalopathy in intensive care unit patients: 2008–2011. Chin Med J (Engl). 2012;125(5):828‐831. - PubMed
    1. Mei B, Li J, Zuo Z. Dexmedetomidine attenuates sepsis‐associated inflammation and encephalopathy via central alpha2A adrenoceptor. Brain Behav Immun. 2021;91:296‐314. - PMC - PubMed
    1. Chen S, Tang C, Ding H, Wang Z, Liu X, Chai Y. Maf1 ameliorates sepsis‐associated encephalopathy by suppressing the NF‐kB/NLRP3 inflammasome signaling pathway. Front Immunol. 2020;11:594071. - PMC - PubMed
    1. Matheis F, Muller PA, Graves CL, Gabanyi I, Kerner Z, Costa‐Borges D. Adrenergic signaling in muscularis macrophages limits infection‐induced neuronal loss. Cell. 2020;180(1):64‐78e16. - PMC - PubMed
    1. Ladinsky MS, Araujo LP, Zhang X, Veltri J, Galan‐Diez M, Soualhim S. Endocytosis of commensal antigens by intestinal epithelial cells regulates mucosal T cell homeostasis. Science. 2019;363(6431):eaat4042. - PMC - PubMed

Publication types