

H-Scan Ultrasound Monitoring of Breast Cancer Response to Chemotherapy and Validation With Diffusion-Weighted Magnetic Resonance Imaging
- PMID: 36468546
- PMCID: PMC10250021
- DOI: 10.1002/jum.16143
H-Scan Ultrasound Monitoring of Breast Cancer Response to Chemotherapy and Validation With Diffusion-Weighted Magnetic Resonance Imaging
Abstract
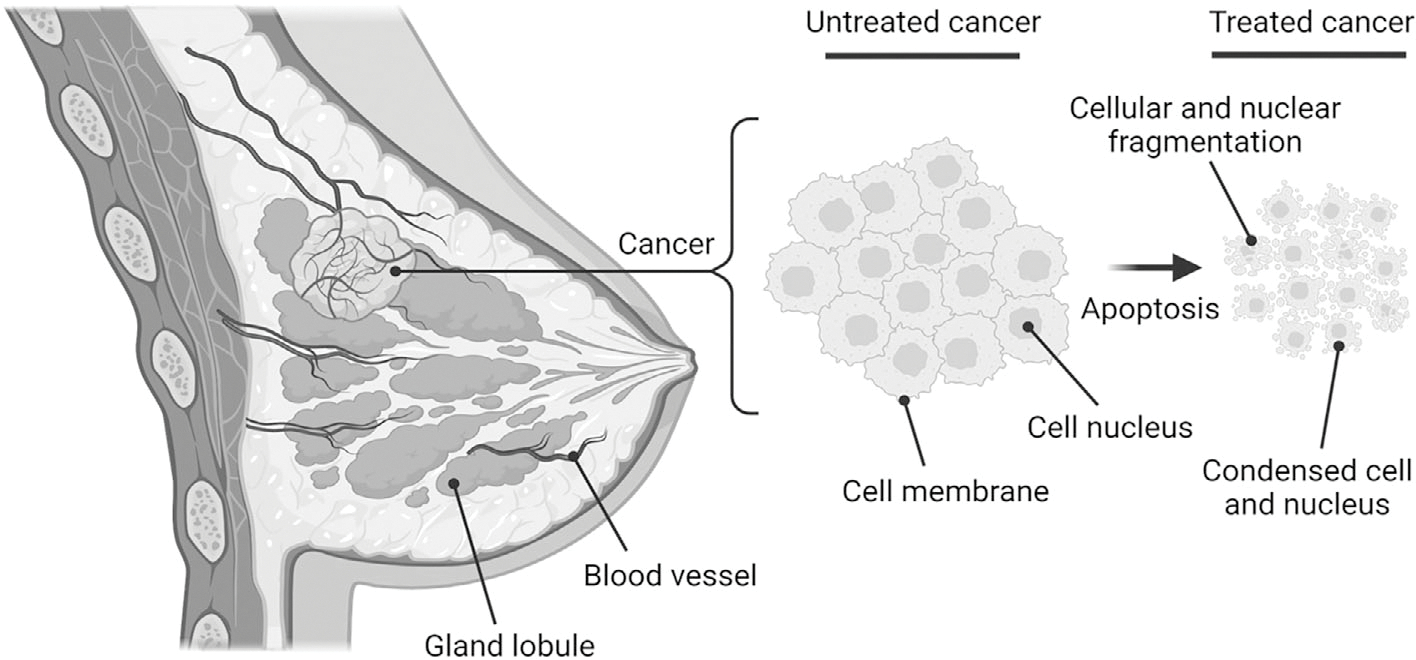
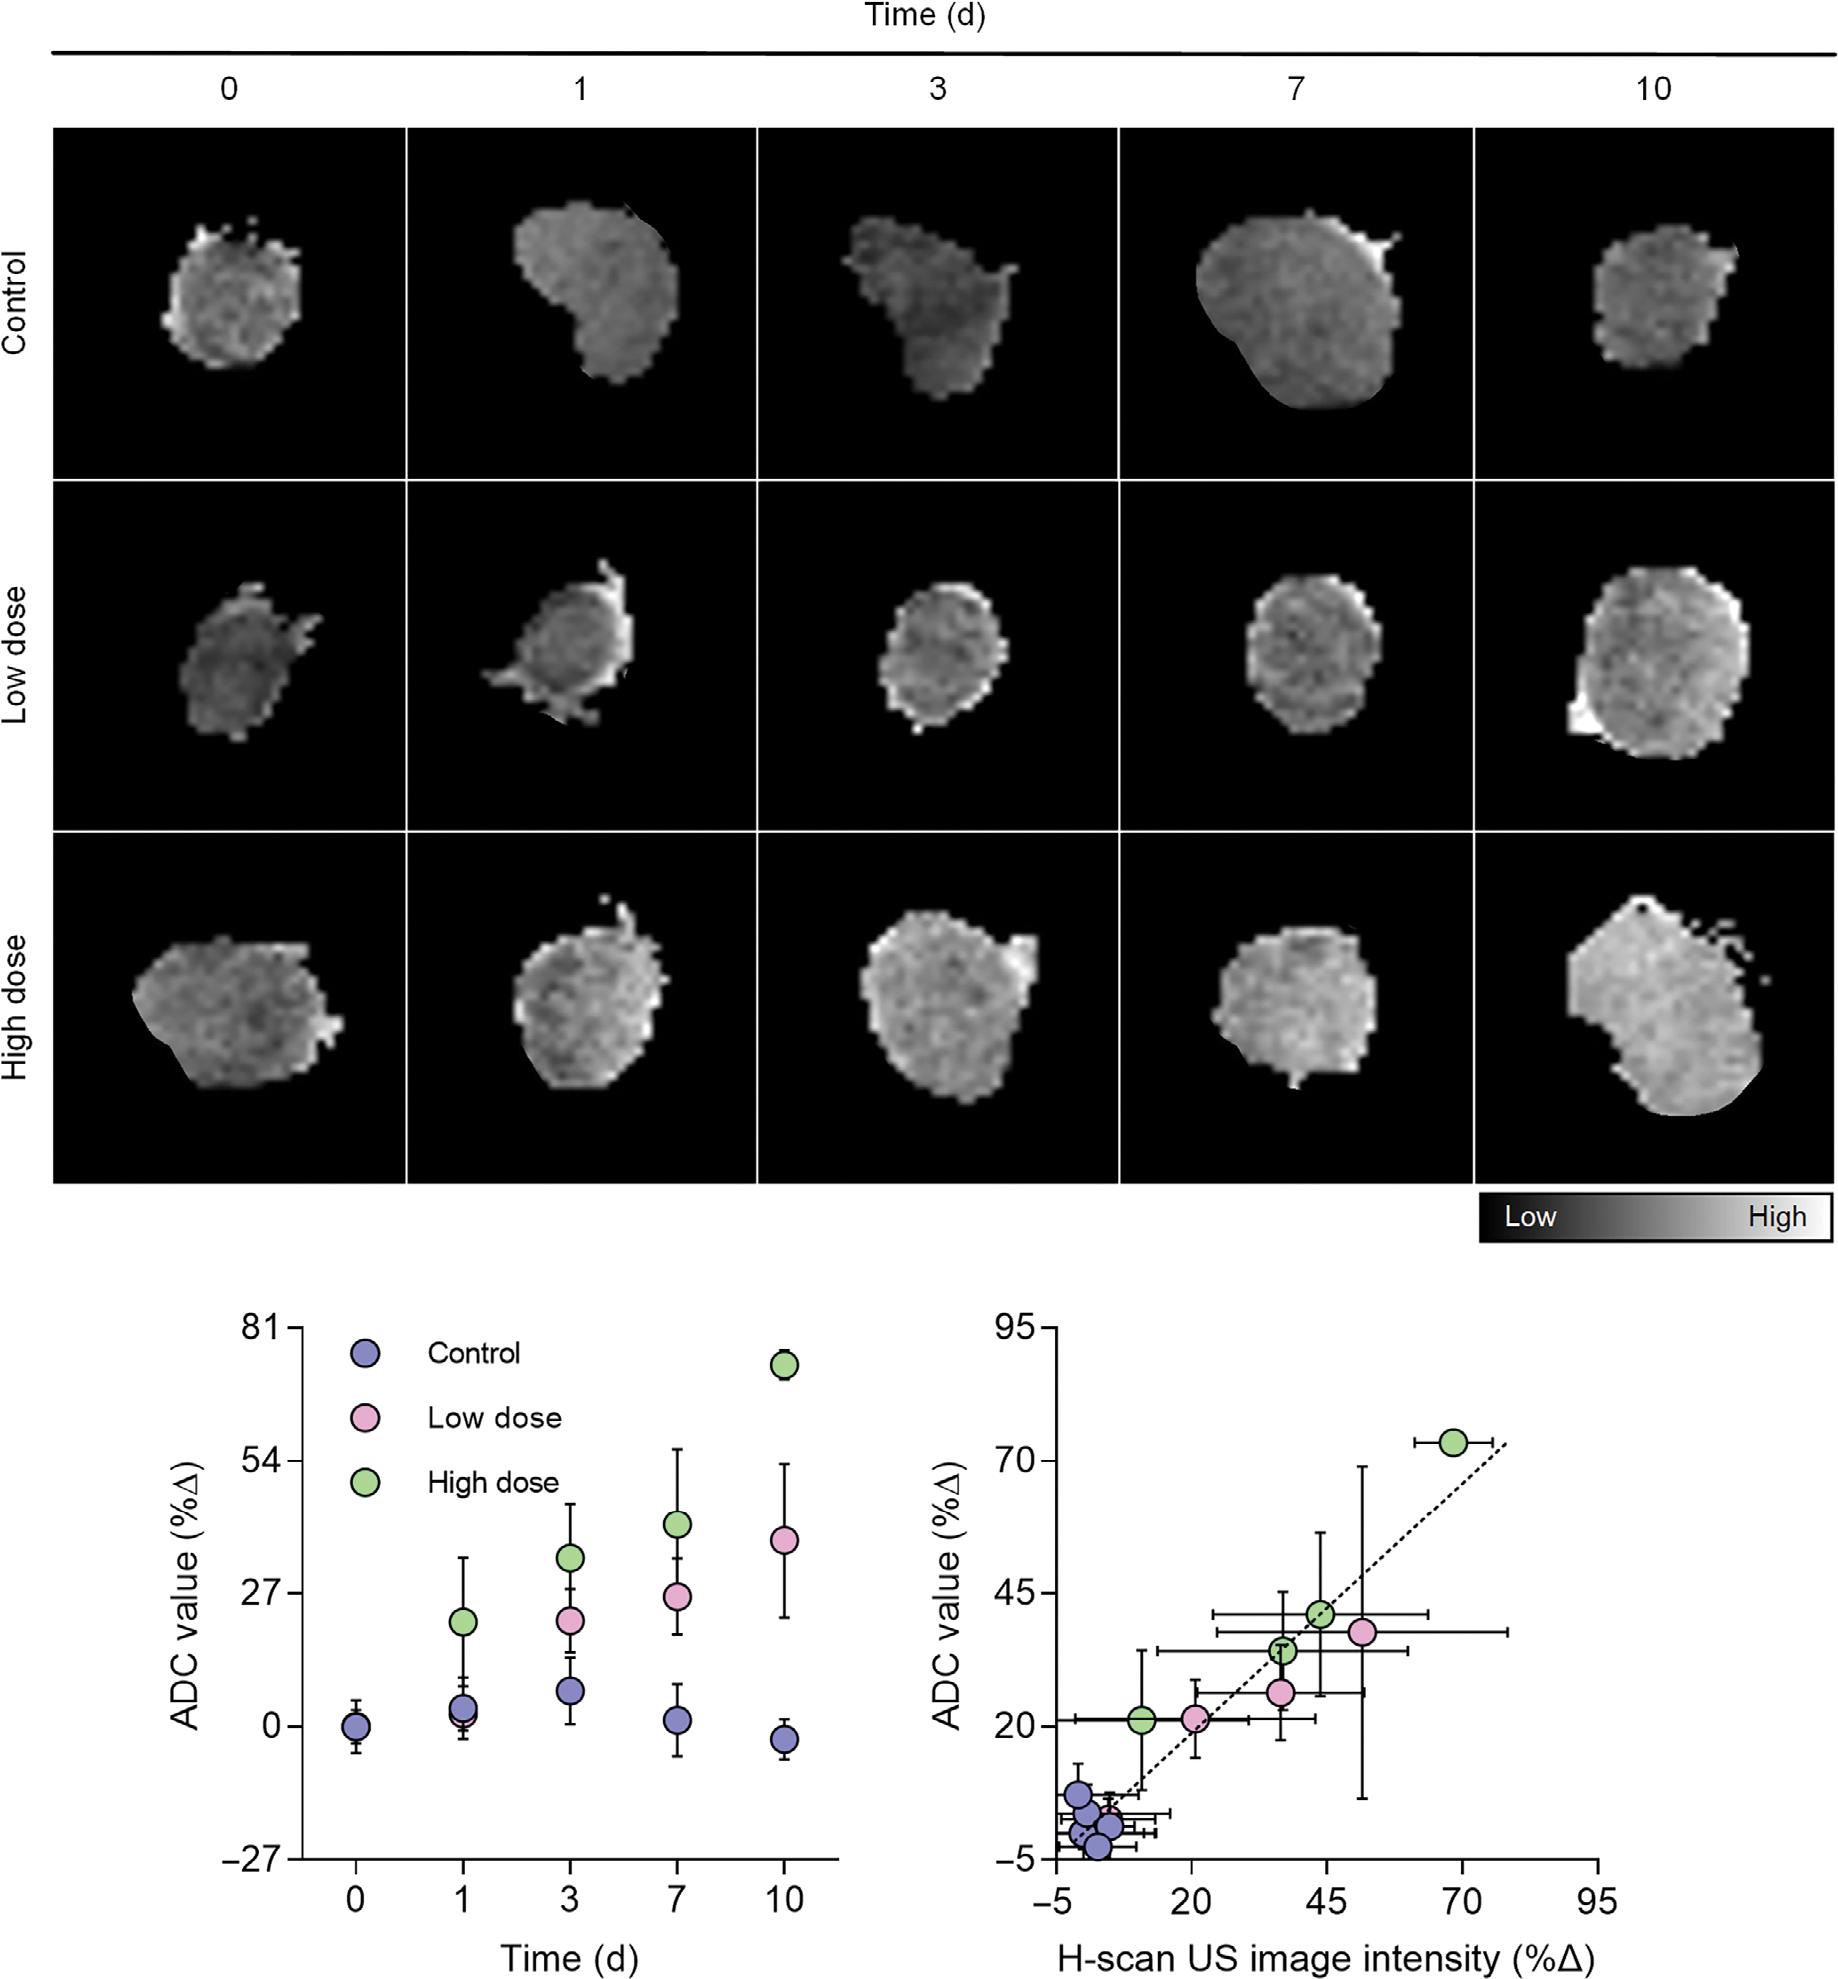
Objectives: H-scan ultrasound (US) imaging is a novel tissue characterization technique to detect apoptosis-induced changes in cancer cells after the initiation of effective drug treatment. The objective of the proposed research was to assess the sensitivity of 3-dimensional (3D) H-scan US technique for monitoring the response of breast cancer-bearing animals to neoadjuvant chemotherapy and correlate results to diffusion-weighted magnetic resonance imaging (DW-MRI) measurements of programmed cancer cell death.
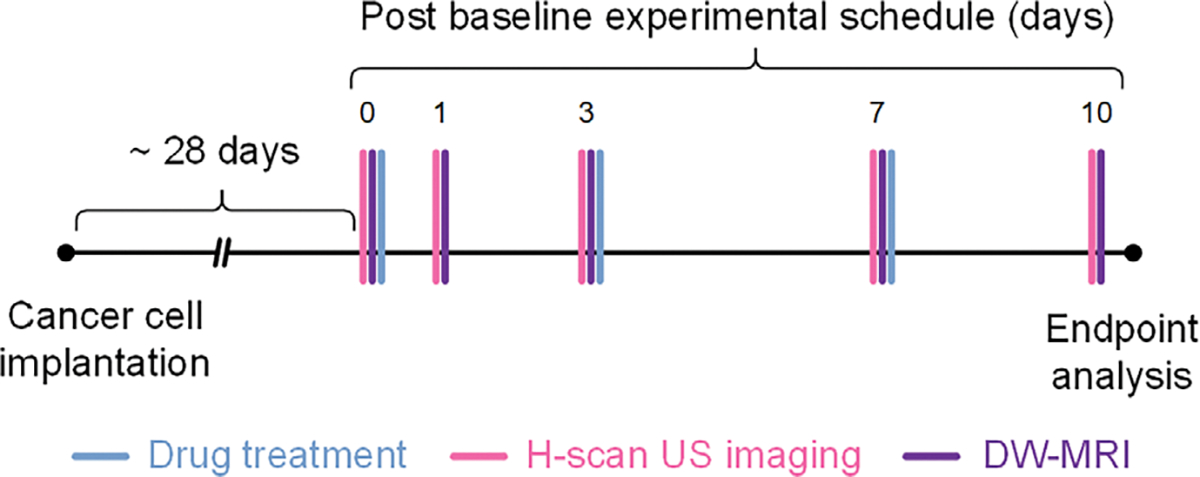
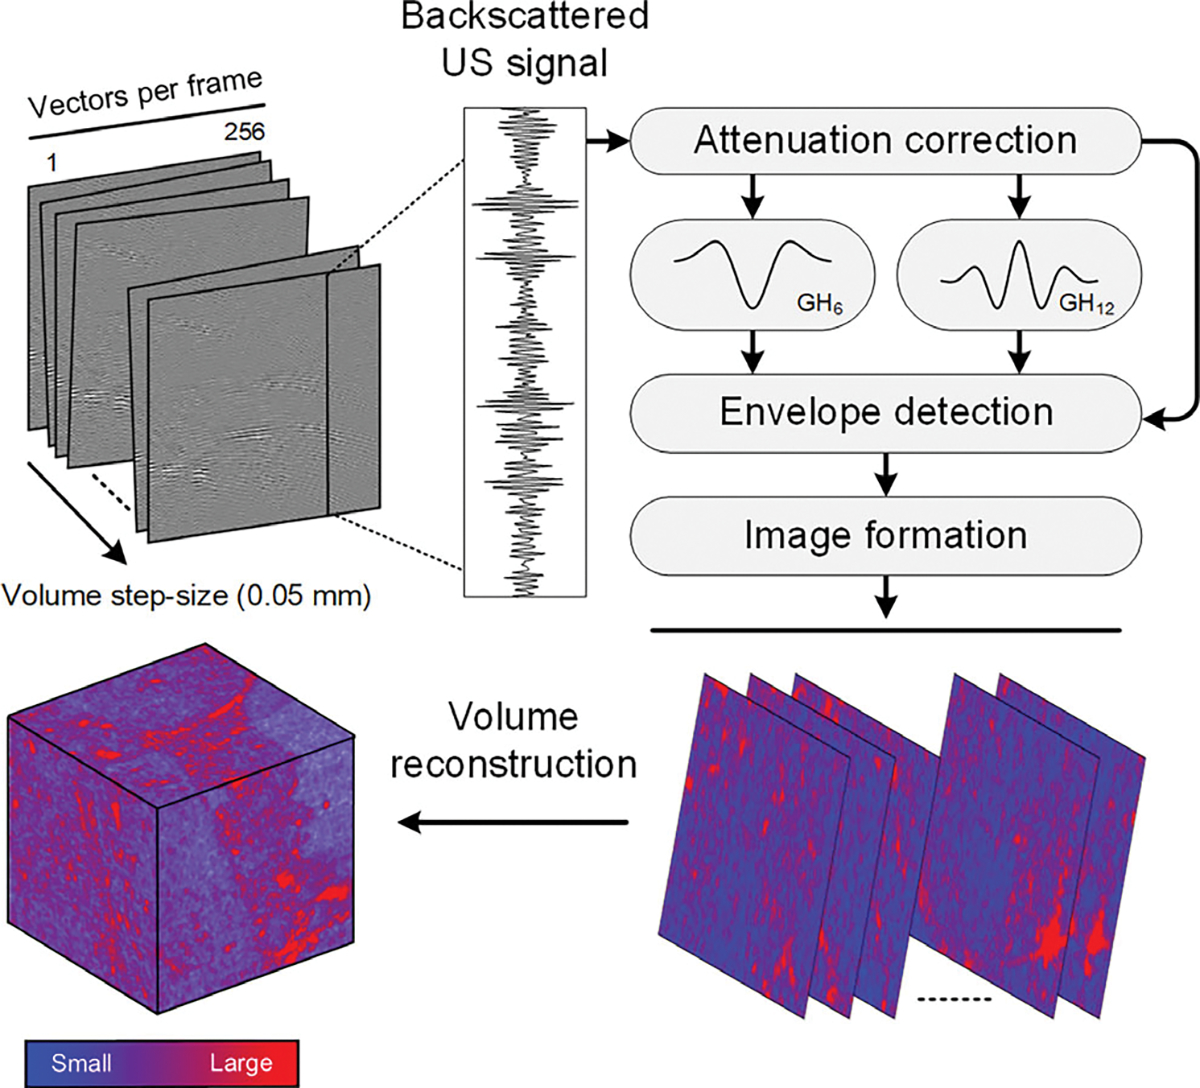
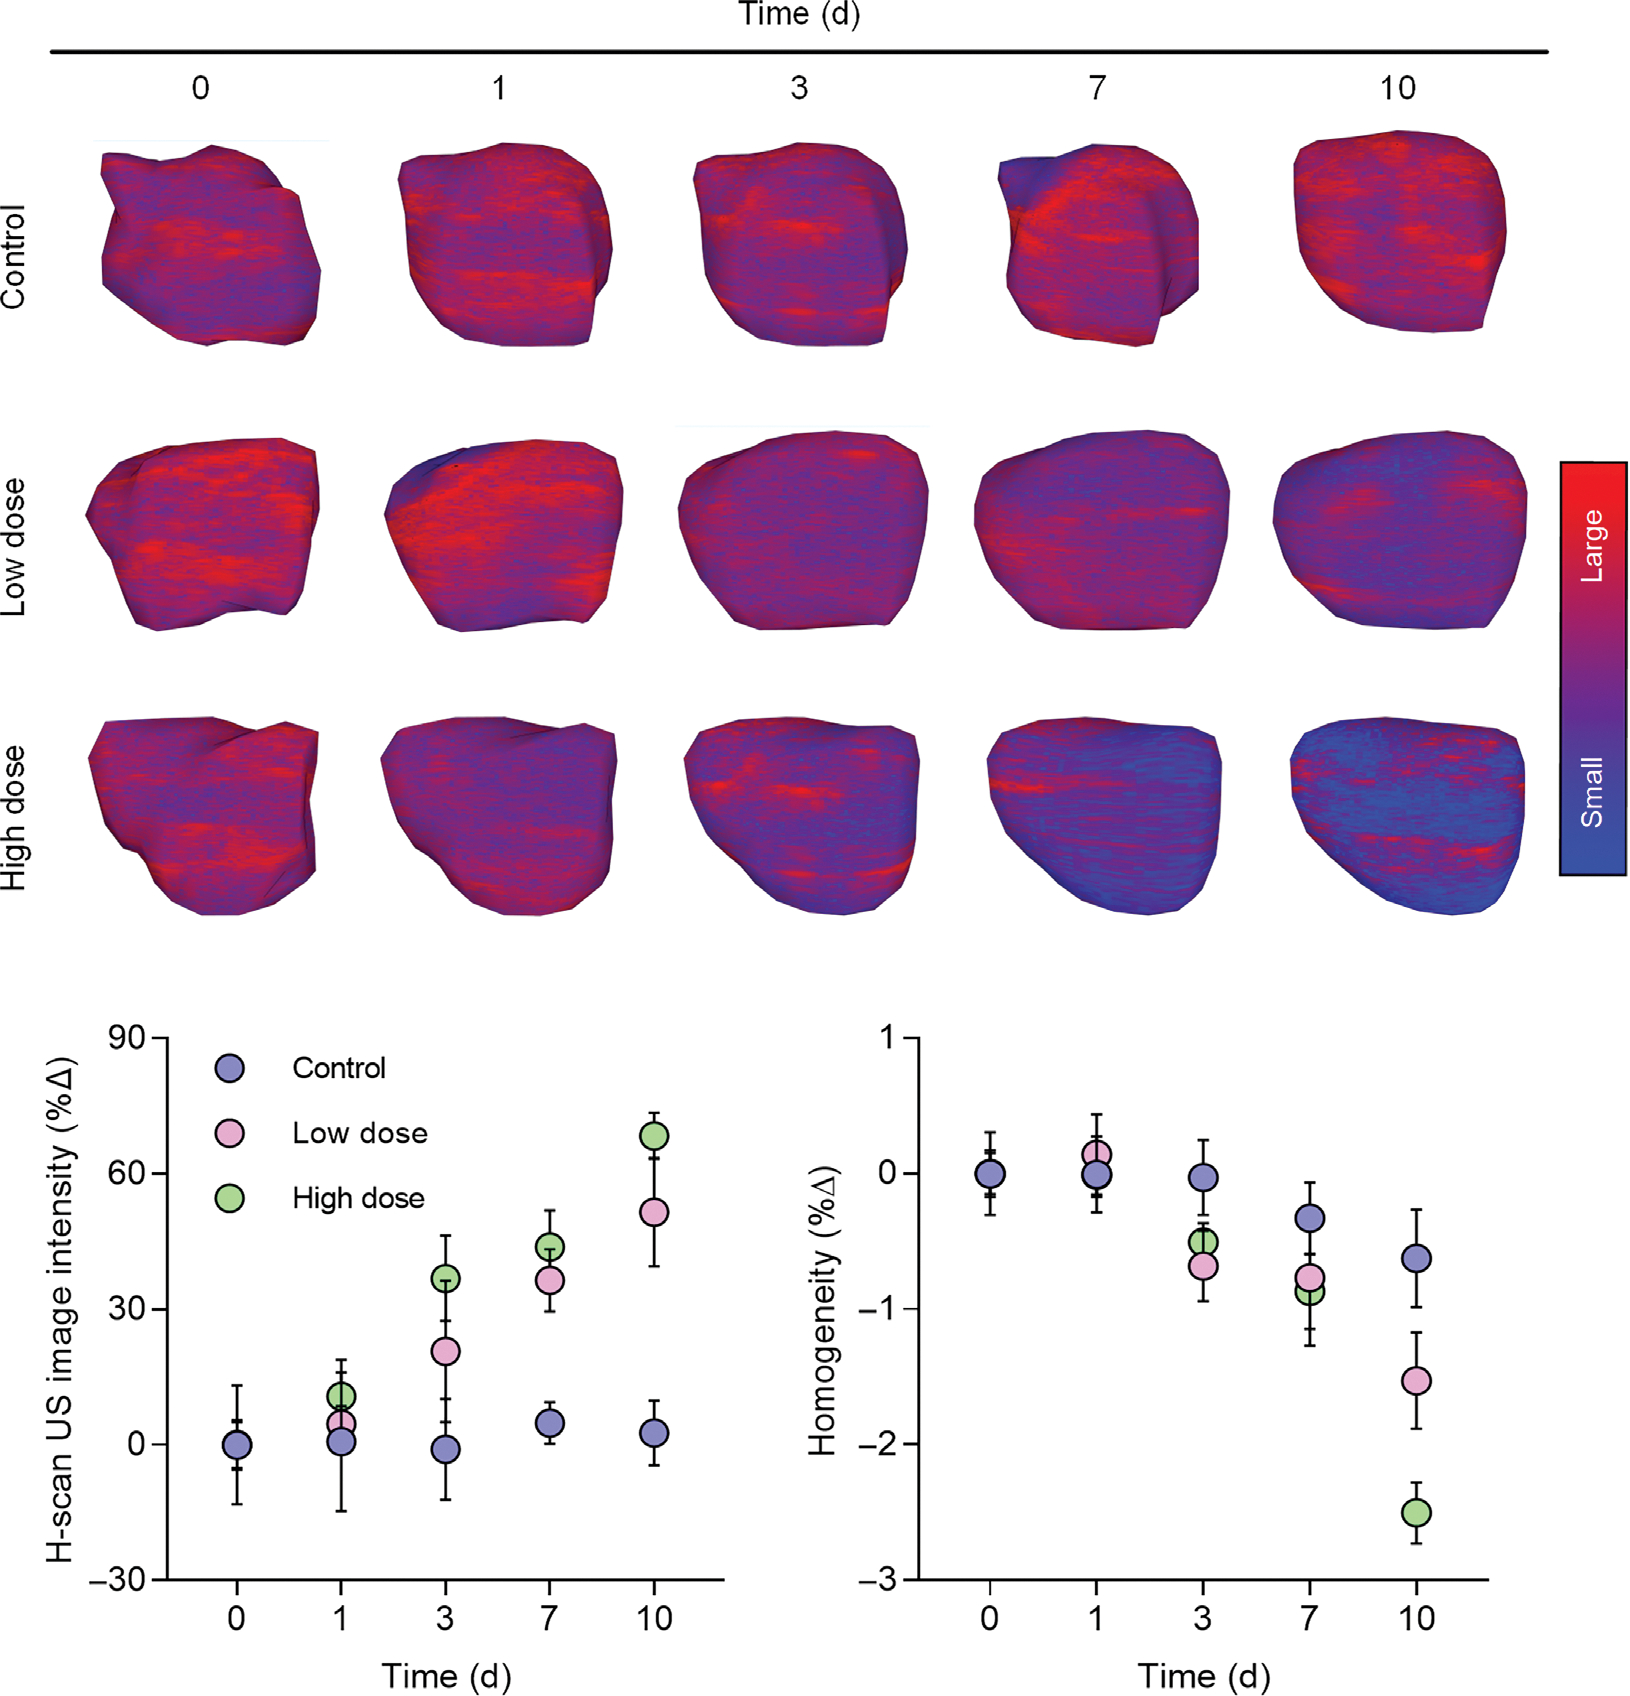
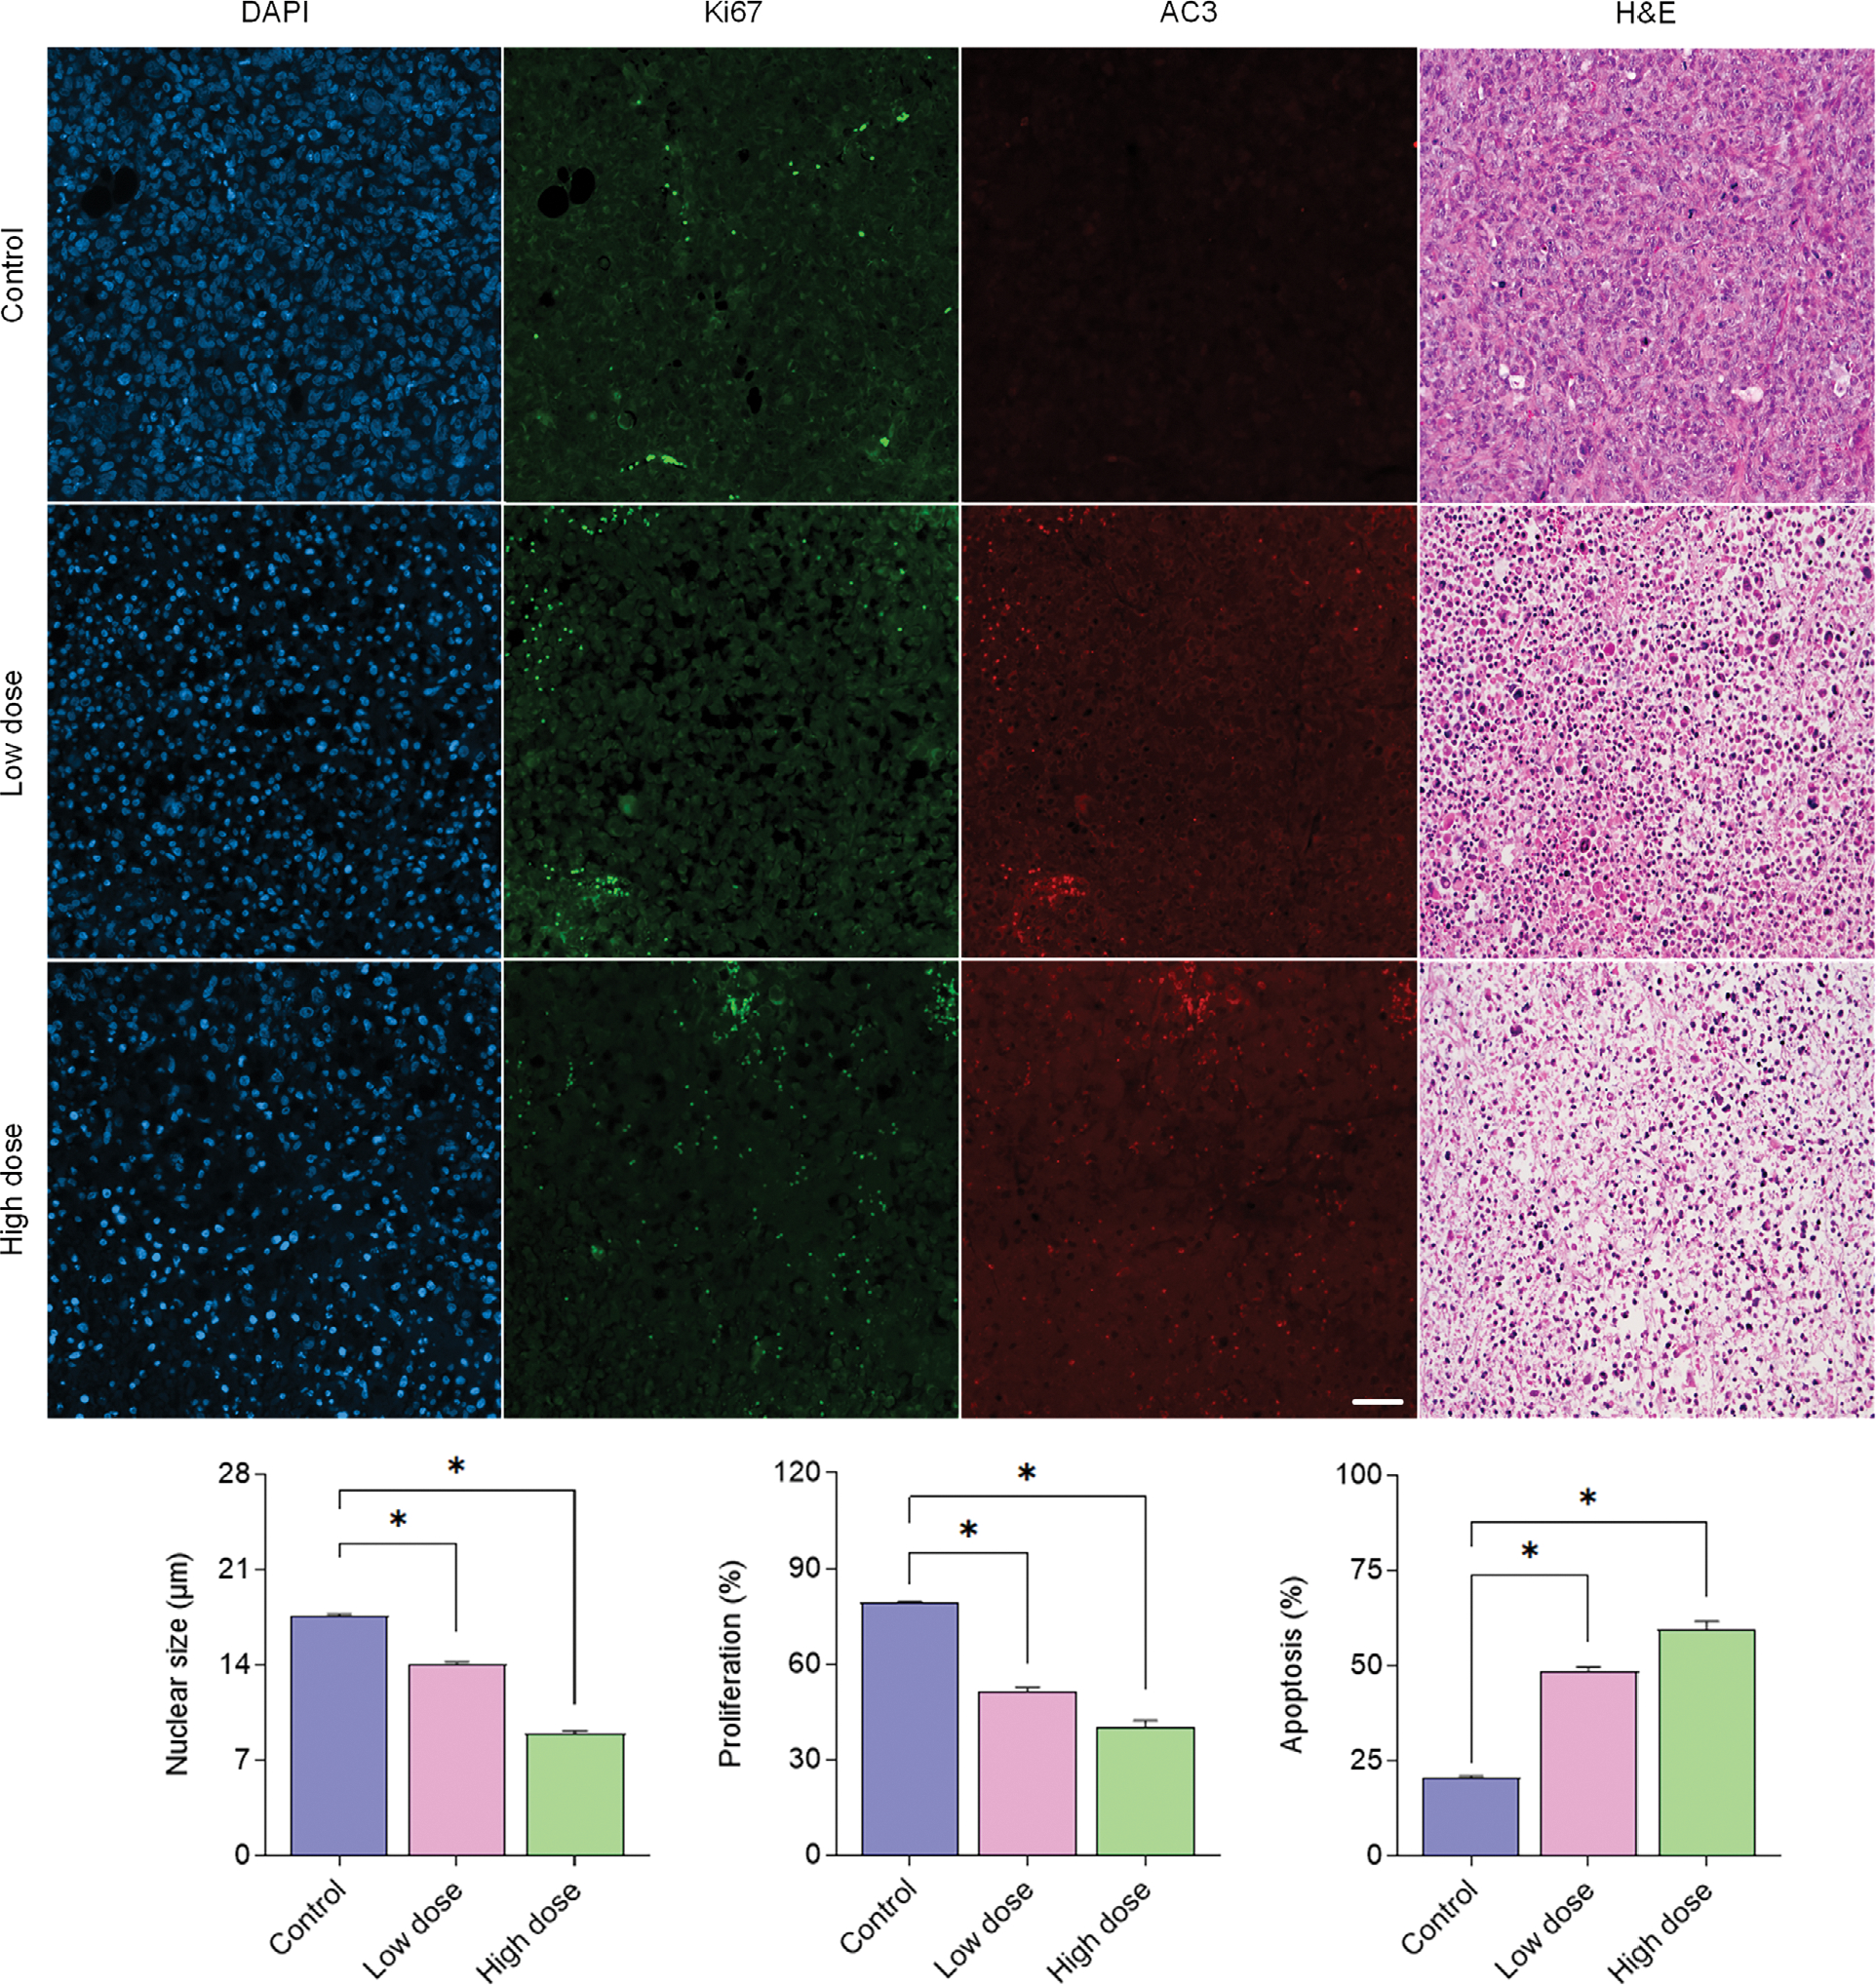
Methods: Experimental studies used female mice (N = 18) implanted with human breast cancer cells. Animals underwent H-scan US and DW-MRI imaging on days 0, 1, 3, 7, and 10. After imaging at day 0, breast tumor-bearing nude mice were treated biweekly with an apoptosis-inducing drug. Texture analysis of H-scan US images explored spatial relationships between local US scattering. At day 10, H-scan measurements were compared with DW-MRI-derived apparent diffusion coefficient (ADC) values and histological findings.
Results: H-scan US imaging of low and high dose cisplatin-treated cancer-bearing animals revealed changes in image intensity suggesting a progressive decrease in aggregate US scatterer size that was not observed in control animals. Longitudinal trends discovered in H-scan US result matched with texture analysis and DW-MRI (P < .01). Further, analysis of the H-scan US image intensity and corresponding DW-MRI-derived ADC values revealed a strong linear correlation (R2 = .93, P < .001). These changes were due to cancer cell apoptotic activity and consider as early detectable biomarker during treatment.
Conclusions: The 3D H-scan technique holds promise for assisting clinicians in monitoring the early response of breast cancer tumor to neoadjuvant chemotherapy and adding value to traditional diagnostic ultrasound examinations.
Keywords: H-scan; apoptosis; breast cancer; diffusion-weighted magnetic resonance imaging; tissue characterization; ultrasound.
© 2022 American Institute of Ultrasound in Medicine.
Figures
Similar articles
-
Three-Dimensional H-Scan Ultrasound Imaging of Early Breast Cancer Response to Neoadjuvant Therapy in a Murine Model.Invest Radiol. 2022 Apr 1;57(4):222-232. doi: 10.1097/RLI.0000000000000831. Invest Radiol. 2022. PMID: 34652291 Free PMC article.
-
Diffusion weighted magnetic resonance imaging (DW-MRI) as a non-invasive, tissue cellularity marker to monitor cancer treatment response.BMC Cancer. 2020 Feb 19;20(1):134. doi: 10.1186/s12885-020-6617-x. BMC Cancer. 2020. PMID: 32075610 Free PMC article.
-
Role of diffusion-weighted MRI: predicting axillary lymph node metastases in breast cancer.Acta Radiol. 2014 Oct;55(8):909-16. doi: 10.1177/0284185113509094. Epub 2013 Nov 14. Acta Radiol. 2014. PMID: 24234236
-
Diffusion-Weighted Magnetic Resonance Imaging of the Breast: Standardization of Image Acquisition and Interpretation.Korean J Radiol. 2021 Jan;22(1):9-22. doi: 10.3348/kjr.2020.0093. Epub 2020 Aug 28. Korean J Radiol. 2021. PMID: 32901461 Free PMC article. Review.
-
Role of Magnetic Resonance Imaging in Detection of Pathologic Complete Remission in Breast Cancer Patients Treated With Neoadjuvant Chemotherapy: A Meta-analysis.Clin Breast Cancer. 2017 Jul;17(4):245-255. doi: 10.1016/j.clbc.2016.12.010. Epub 2017 Jan 11. Clin Breast Cancer. 2017. PMID: 28209330 Review.
Cited by
-
Amplitude-Modulation Frequency Optimization for Enhancing Harmonic Motion Imaging Performance of Breast Tumors in the Clinic.Ultrasound Med Biol. 2025 Jan;51(1):169-179. doi: 10.1016/j.ultrasmedbio.2024.09.021. Epub 2024 Oct 19. Ultrasound Med Biol. 2025. PMID: 39428259
-
Correlation between ultrasound measurements and the expression of Her-2 and CD147 in breast cancer.Am J Transl Res. 2025 Apr 15;17(4):3109-3118. doi: 10.62347/JAVK7987. eCollection 2025. Am J Transl Res. 2025. PMID: 40385050 Free PMC article.
-
Microvascular blood flow ultrasound imaging with microbubble-based H-Scan technology.Med Biol Eng Comput. 2025 Jun;63(6):1649-1660. doi: 10.1007/s11517-024-03262-1. Epub 2025 Jan 21. Med Biol Eng Comput. 2025. PMID: 39836289 Free PMC article.
References
-
- Siegel RL, Miller KD, Fuchs HE, Jemal A. Cancer statistics, 2022. CA Cancer J Clin 2022; 72:7–33. - PubMed
-
- Liedtke C, Mazouni C, Hess KR, et al. Response to neoadjuvant therapy and long-term survival in patients with triple-negative breast cancer. J Clin Oncol 2008; 26:1275–1281. - PubMed
-
- Dagogo-Jack I, Shaw AT. Tumour heterogeneity and resistance to cancer therapies. Nat Rev Clin Oncol 2018; 15:81–94. - PubMed
MeSH terms
Grants and funding
LinkOut - more resources
Full Text Sources
Medical
