. 2023 Apr;89(4):1481-1495.
doi: 10.1002/mrm.29551. Epub 2022 Dec 5.

Model-constrained reconstruction accelerated with Fourier-based undersampling for hyperpolarized [1-13 C] pyruvate imaging

Affiliations

Model-constrained reconstruction accelerated with Fourier-based undersampling for hyperpolarized [1-13 C] pyruvate imaging

Zhan Xu et al. Magn Reson Med. 2023 Apr.

Abstract

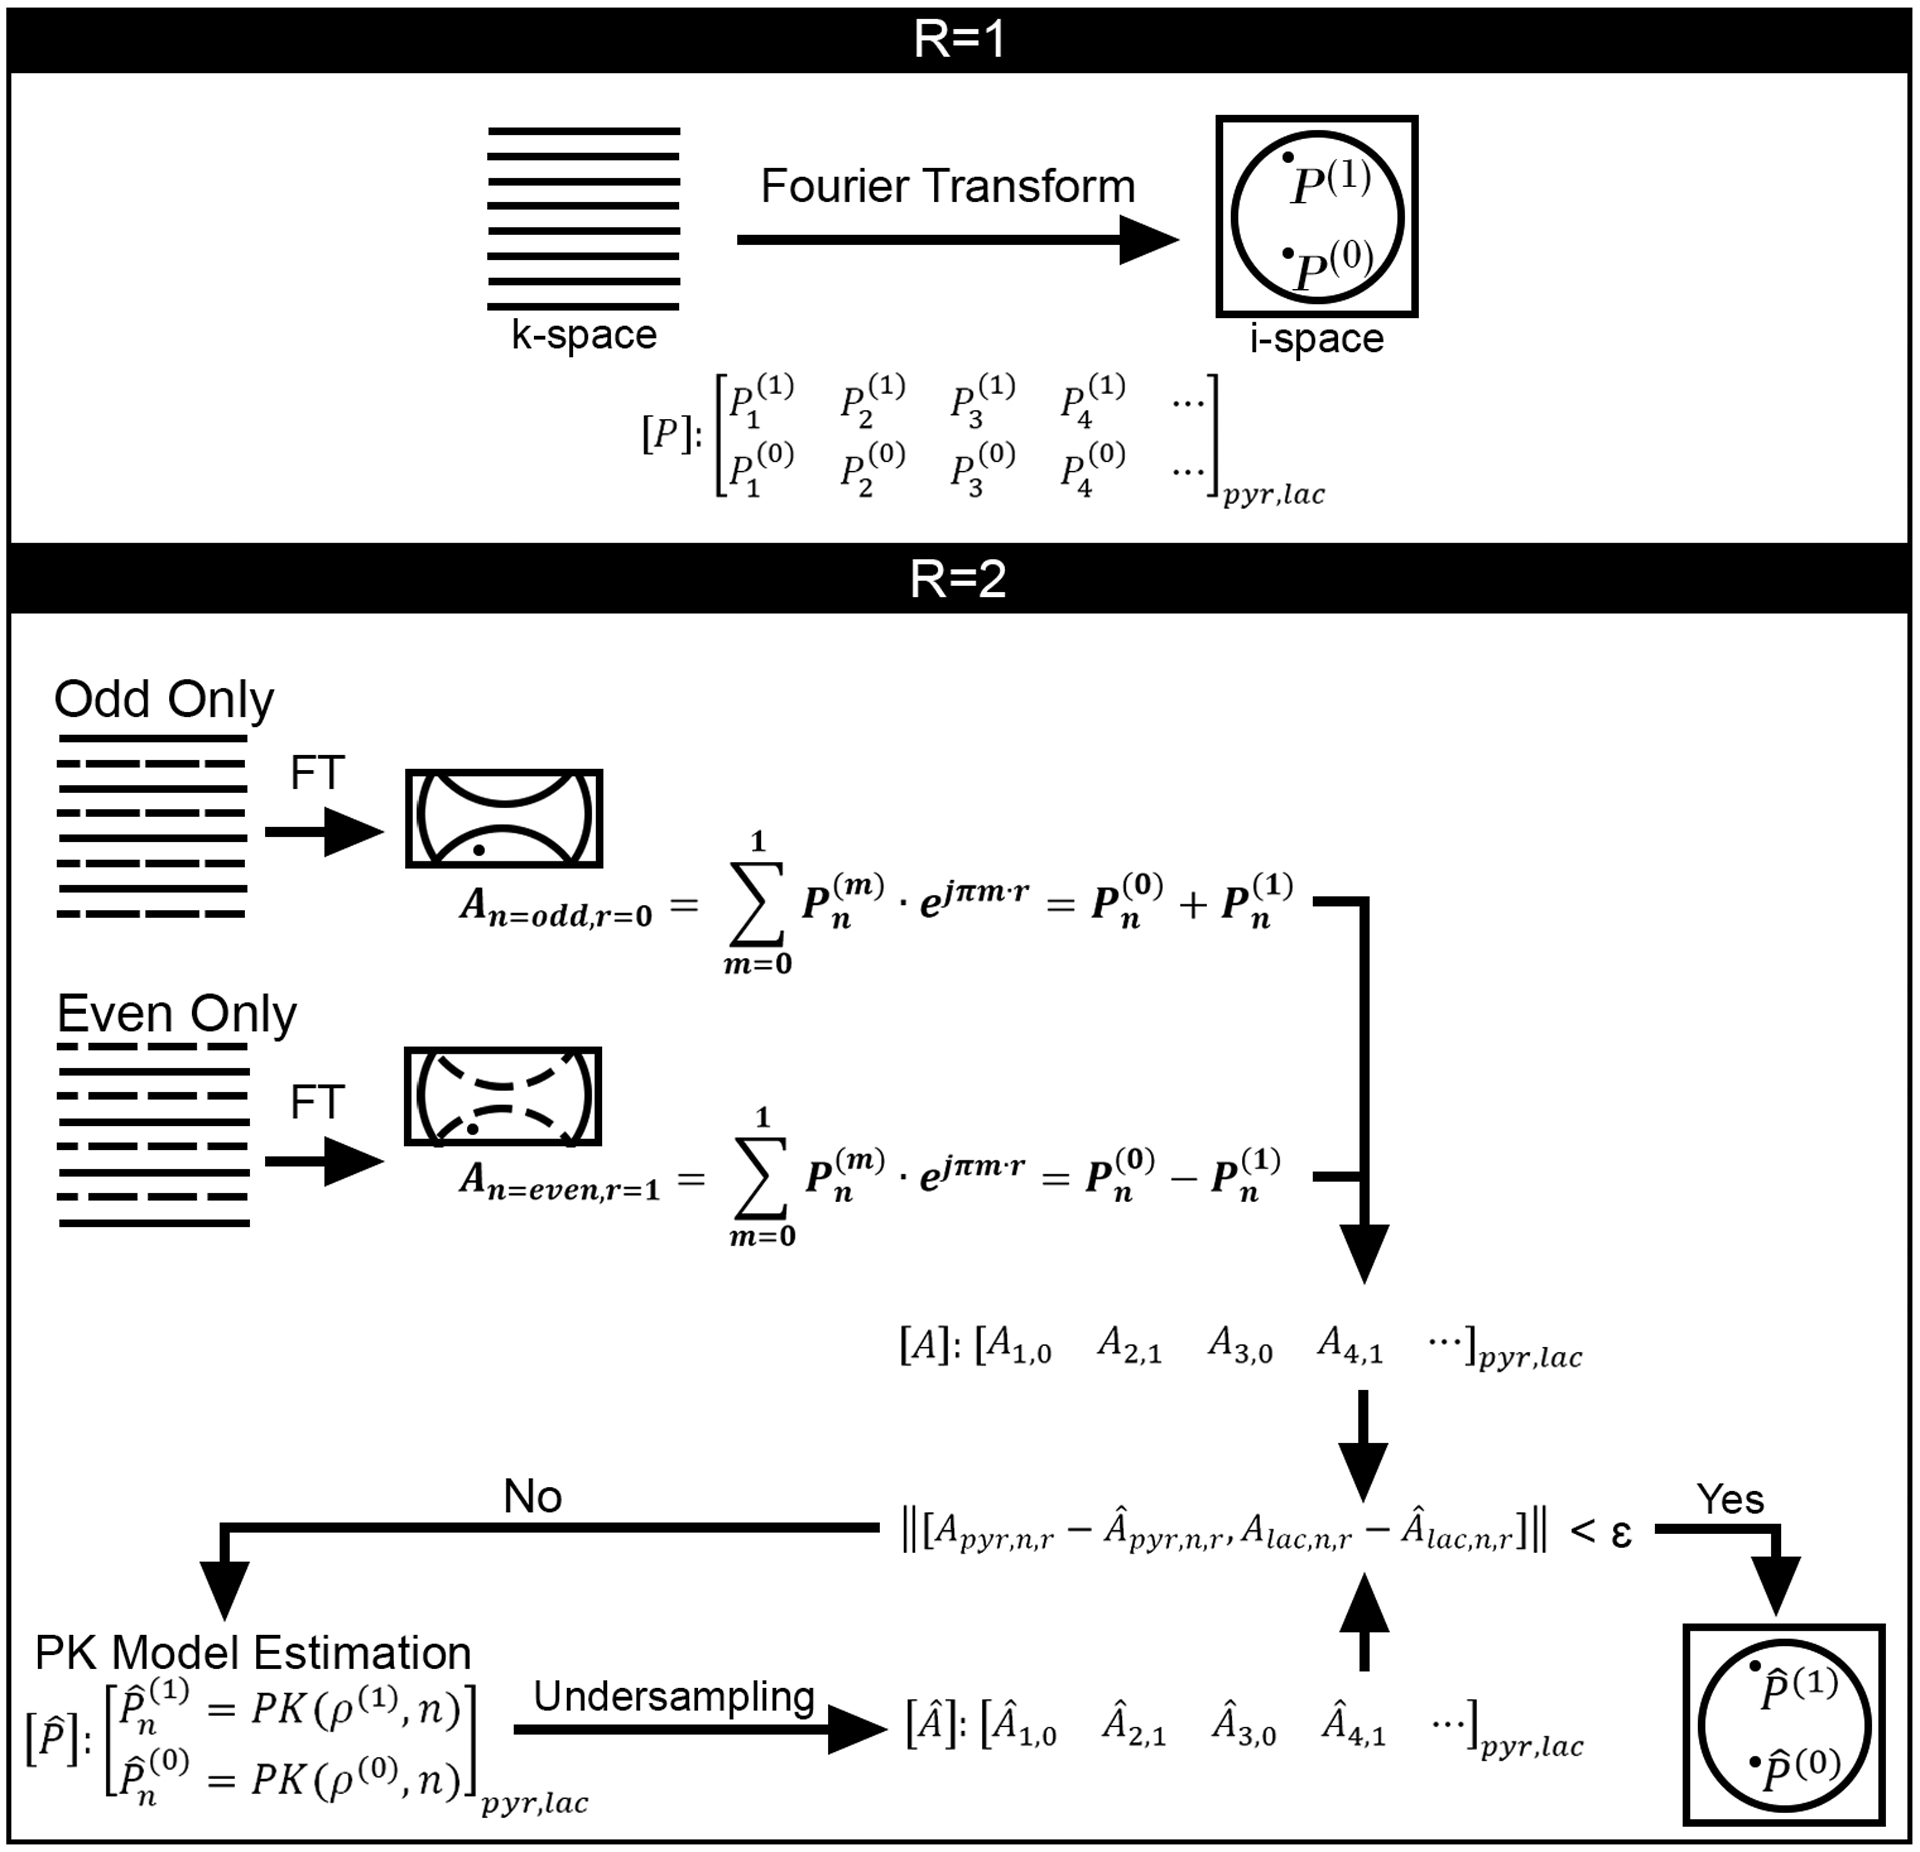
Purpose: Model-constrained reconstruction with Fourier-based undersampling (MoReFUn) is introduced to accelerate the acquisition of dynamic MRI using hyperpolarized [1-13 C]-pyruvate.

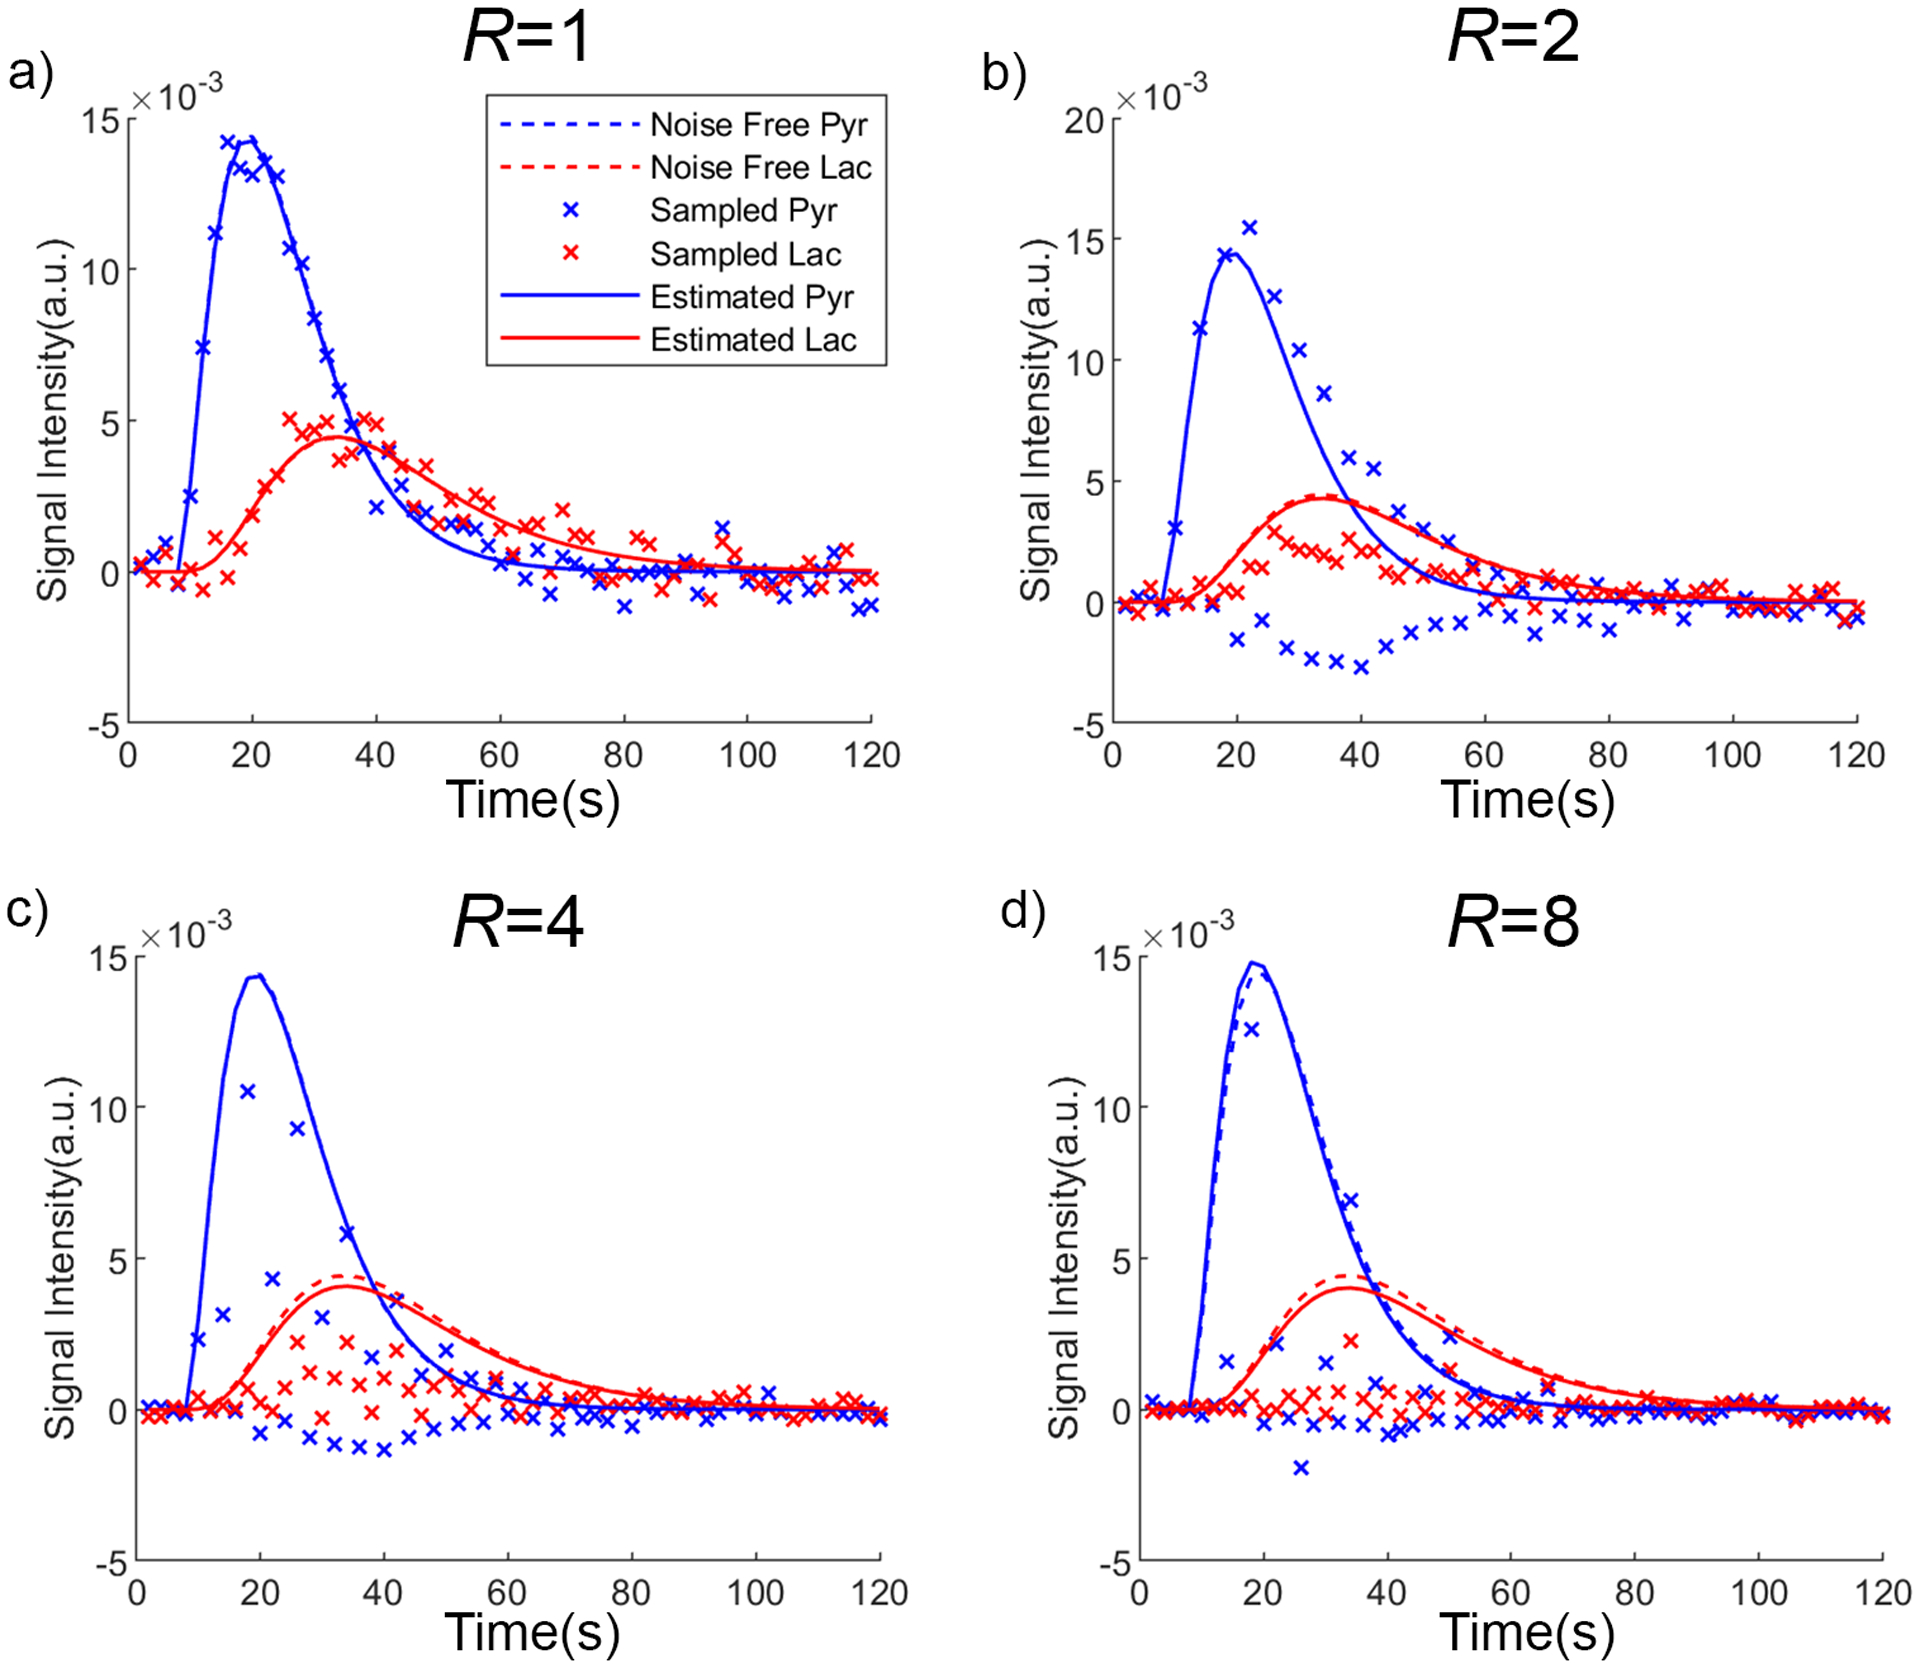
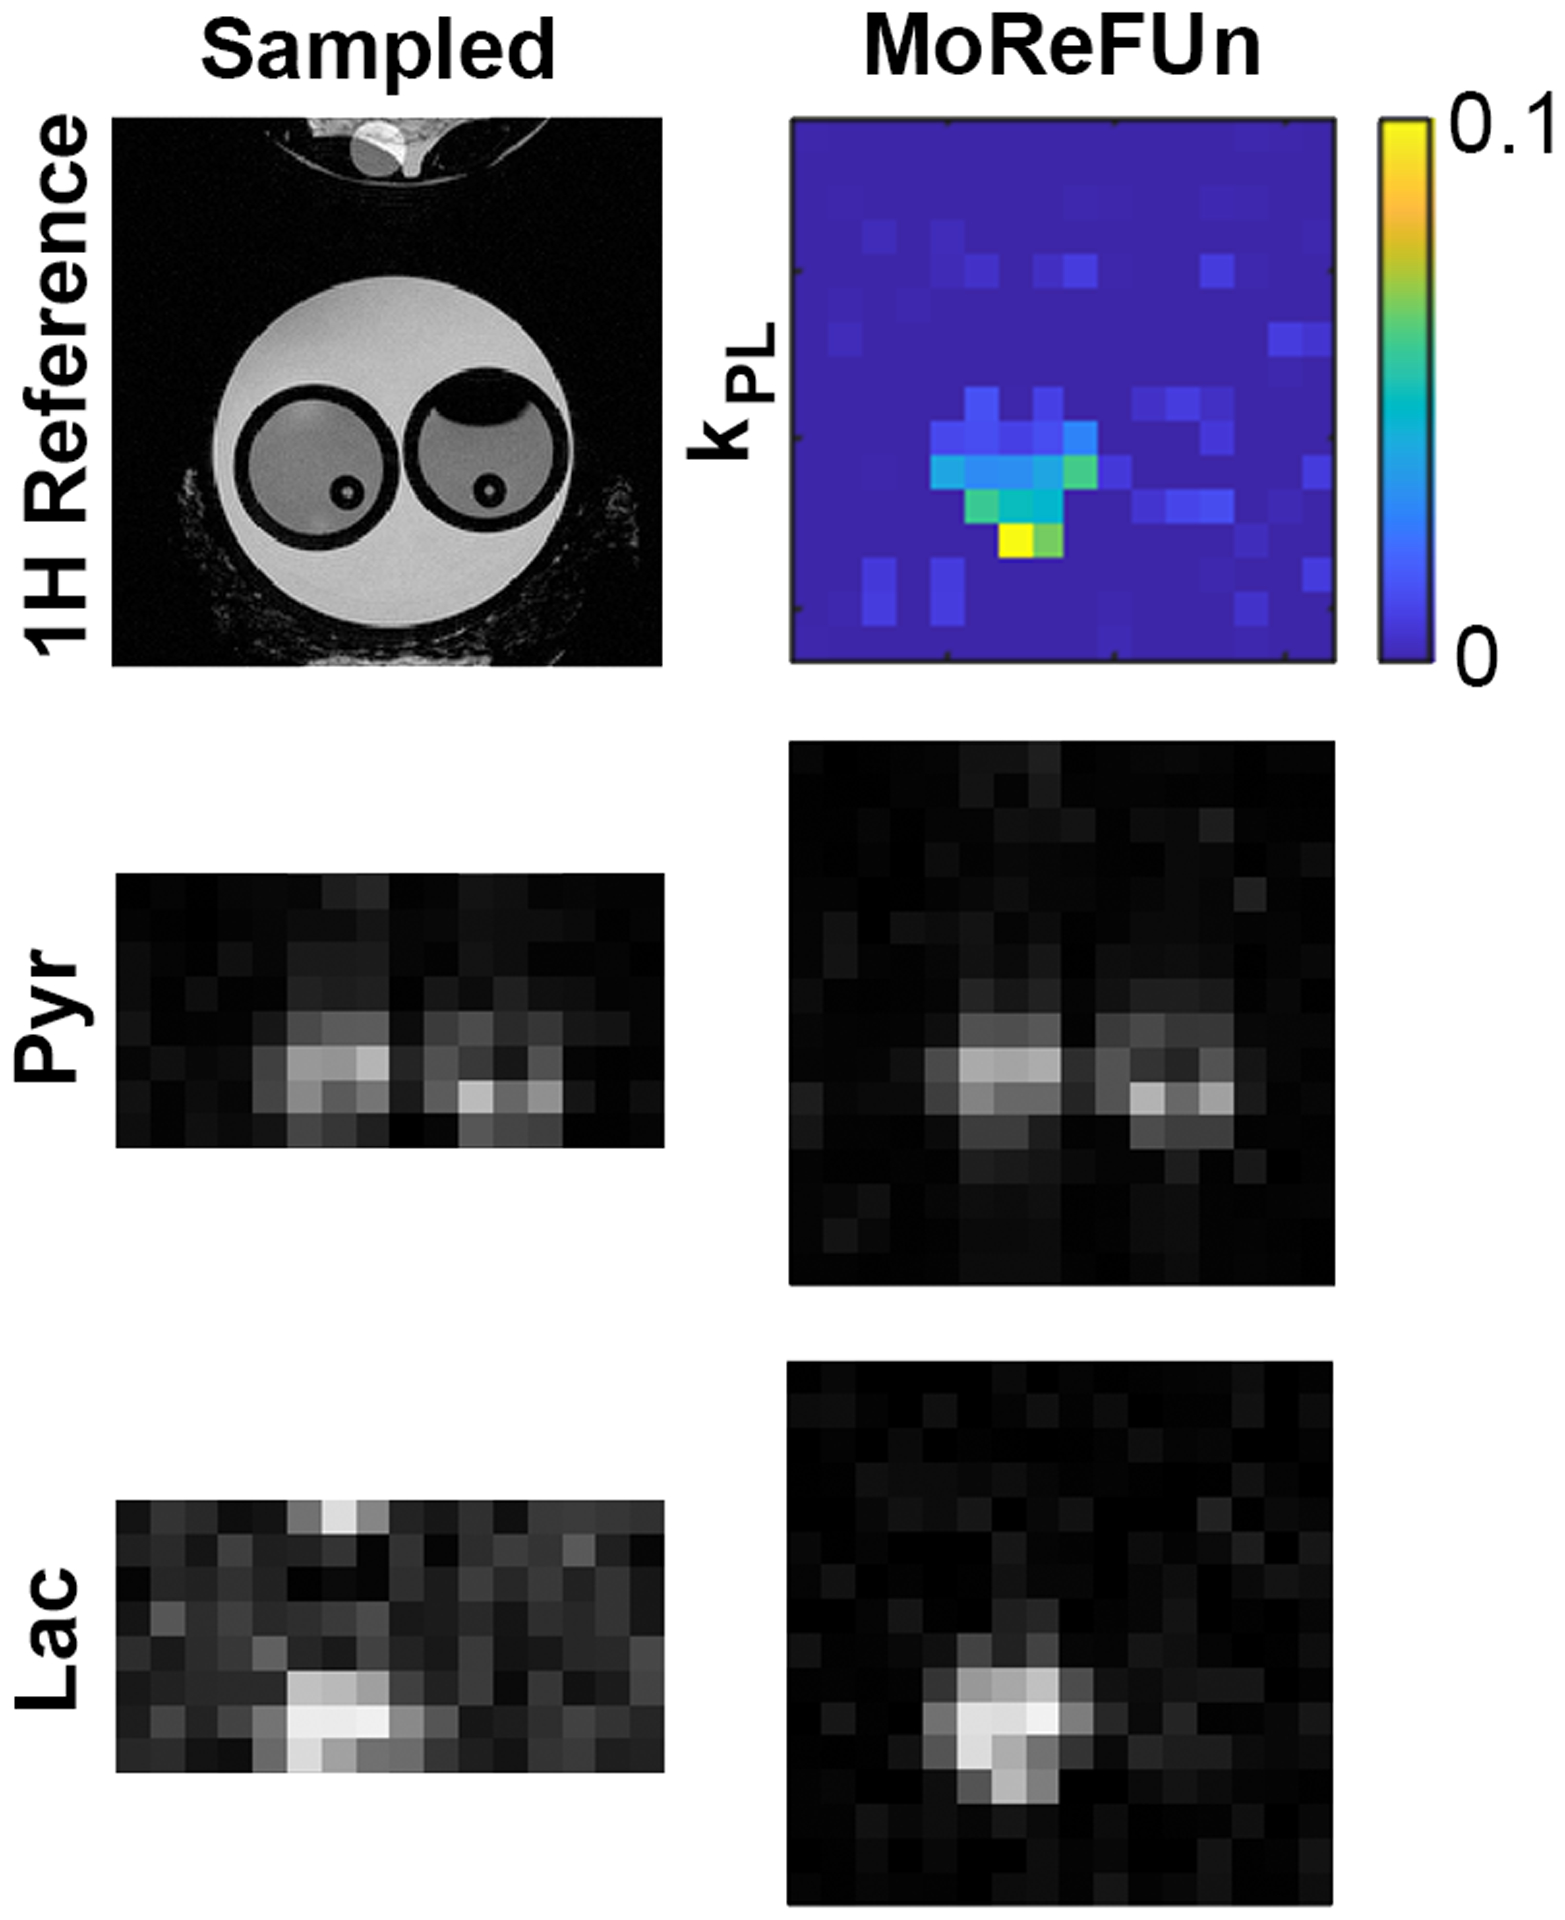
Methods: The MoReFUn method resolves spatial aliasing using constraints introduced by a pharmacokinetic model that describes the signal evolution of both pyruvate and lactate. Acceleration was evaluated on three single-channel data sets: a numerical digital phantom that is used to validate the accuracy of reconstruction and model parameter restoration under various SNR and undersampling ratios, prospectively and retrospectively sampled data of an in vitro dynamic multispectral phantom, and retrospectively undersampled imaging data from a prostate cancer patient to test the fidelity of reconstructed metabolite time series.

Results: All three data sets showed successful reconstruction using MoReFUn. In simulation and retrospective phantom data, the restored time series of pyruvate and lactate maintained the image details, and the mean square residual error of the accelerated reconstruction increased only slightly (< 10%) at a reduction factor up to 8. In prostate data, the quantitative estimation of the conversion-rate constant of pyruvate to lactate was achieved with high accuracy of less than 10% error at a reduction factor of 2 compared with the conversion rate derived from unaccelerated data.

Conclusion: The MoReFUn technique can be used as an effective and reliable imaging acceleration method for metabolic imaging using hyperpolarized [1-13 C]-pyruvate.

Keywords: constrained reconstruction; hyperpolarized MR; pharmacokinetic modeling; pyruvate; undersampling.


Figures

Figure 1.
Figure 1.
Data acquisition and constrained reconstruction scheme for MoReFUn. R stands for the undersampling ratio, P stands for the value of a voxel in the full FOV image, A stands for the value of an aliased pixel in the undersampled image with reduced FOV, A_cap is the estimated aliased pixel that is synthesized under the same undersampling scheme as A from the MoReFUN reconstructed image. ‘PK’ stands for the pharmacokinetic model as stated by equation 4,5 or equation 6–8 depends the application. ‘ρ’ stands for the parameter space (kPL, kve, vb, etc.) going to be estimated. ‘r’ defines the amount of k-space shift depending on undersampling pattern. The solid and dashed lines represent, respectively, the acquired and skipped phase steps in k-space. The k-space undersampling patterns vary over time, but are set as identical across pyruvate and lactate.
Figure 2.
Figure 2.
Parameter maps for the two-physical-compartment model and representative full resolution images. (a) Maps of primary parameters for the digital reference object. The kPL map is comprised of boxed regions at relatively large (yellow), moderate (teal), and small (blue) kPL values indicating tissue at different metabolic rates. The kve and vb maps are homogeneous for simplicity. (b) Noise-free pyruvate and lactate images from three time points.
Figure 3.
Figure 3.
PK model parameter rate map estimation from MoReFUn reconstructed data. The peak pyruvate tSNR of the raw data was 30. Measurement was made over 100 runs. The mean of estimated kPL maps accurately reflected the ground truth (figure 2a). The medians of the standard deviation (SD) of the estimated kPL were 4.4% and 5.5% for the high kPL region (center square) and the moderate kPL region (bottom right square) when the undersample ratio R = 1, 6.1% and 8.1% when R = 2, 7.4% and 9.9% when R = 4, 9.9% and 12.8 when R = 8. The arrows and crosses indicate voxels at the same location from different image modalities, whose time series are shown in Figure 4. Similar with kPL estimation, kve (medians of SD = 2.8%, 3.9%, 4.8%, 6.3% at R=1,2,4,8, respectively) and vb (medians of SD = 4.3%, 6.1%, 7.5%, 10.5% at R=1,2,4,8, respectively) maps were also accurately mapped.
Figure 4.
Figure 4.
The time series at the same voxel location with different undersampling rates. Only the real components from phase corrected time series are displayed. (a) The fully sampled metabolite series (‘x’) at peak pyruvate SNR = 30 fluctuates along the noise-free series (dashed lines), while the estimated series (solid) from pharmacokinetic model matches the noise-free series with a slight offset. (b) The undersampled pyruvate series with undersample ratio R = 2 (blue ‘x’) fluctuates dramatically around the noise-free series (dashed lines), and the lactate series (red ‘x’) is severely deviated, but the MoReFUn restored series (solid) matches the noise-free series with only a moderate offset. (c,d) The undersampled data and the MoReFUn reconstructed data at R = 4, and R = 8 respectively.
Figure 5.
Figure 5.
Estimation accuracy of kPL estimation from MoReFUn reconstructed images of undersampled images at R = 2, R = 4, and R = 8 at peak pyruvate SNR ranging from 10 – 50. Estimation RMSE and SD is over 1000 runs. The reliable estimation, defined as the relative RMSE and standard deviation, both are less than 10% from the actual kPL and labeled with dots in the above bar graph of the corresponding R.
Figure 6.
Figure 6.
The estimation of kPL from various spatial resolutions, using DRO 3. This new DRO was designed with kPL map including details at multiple level(high kPL: at the center region, medium kPL: at the right bottom region), and homogeneous kve (=0.0066) and vb (=0.037) maps for simplicity (left column). The other model parameters (T1,P, T1,L, flip angle, kve, vb VIF profile) were the same as those from original DRO introduced in the method section 3.1,. The images with highest spatial resolution was reconstructed at matrix size of 64×64 and pixelwise SNR=7.5. The time series were then spatially subsampled to matrix size of 32×32, 16×16. The low spatial resolution time series were then undersampled and reconstructed by MoReFUn (undersampling ratio R=1,2,4,8). RMSE was measured over the high kPL region. RMSE(HighRes): first interpolated then or directly compared with the ground truth high resolution kPL map (the top left image). RMSE(NsFree): measured with the kPL map (the 2nd column from the left) at the same spatial resolution but noise-free time series.
Figure 7.
Figure 7.
MoReFUn reconstruction using retrospective LDH phantom data. (a) 1 ml of 20 mM HP [1-13C] pyruvate was simultaneously injected into a vial (left) prefilled with 1 ml solution containing LDH, NADH, and TRIS buffer, and a vial (right) prefilled with 1 ml TRIS buffer. (a) Raw images of the dynamic pyruvate and lactate from spectral-spatial selected flyback-EPI at t=12s, and auto-thresholded mask that calculated using lactate AUC map for RMSE measurement. (b) Estimated images using the full k-space. (c, d, e) MoReFUn reconstructed imaging from the undersampled k-space at acceleration ratios of R = 2, R = 4, and R = 8, respectively. Both pyruvate and lactate image series are self-normalized for displaying. (f) T1 reference image and the correlation between kpl maps estimated from different R values. Statistically significant correlation coefficient value (p<0.05) in the top left corner were colored in red. Arrows refer two representative voxels with low lactate SNR and large kve offset between R=1 and R=8. In the raw data, the peak SNR across all voxels within the vial that lactate signal was detected was 87±58 for pyruvate, and 34±19 for lactate. The large SNR variation resulted from the heterogeneous metabolite distribution following injection.
Figure 8.
Figure 8.
Prospective MoReFUn reconstruction at R=2. Using the same LDH phantom system as retrospective study (result in figure 6). Quantitative analysis was not performed due to the drastic inter-trial difference of the phantom system. The peak SNR is 25±12 and 25±7 for pyruvate and lactate.
Figure 9.
Figure 9.
MoReFUn reconstruction using a retrospectively undersampled in vivo prostate dataset. (a) Lactate area under the curve (AUC) map overlaid on the corresponding T2 anatomical reference. The FOV of the overlay was highlighted at the boundary voxels. The pyruvate AUC map, lactate AUC map, and the auto-thresholded RMSE mask based on the lactate AUC map were displayed at the corners. Only voxels within the mask were used for RMSE calculation and comparison of estimated kPL across different R values. (b) Raw images of the dynamic pyruvate and lactate at t = 20s. (c) Estimated images using MoReFUn with the full k-space. (d,f,g) reconstructed images by MoReFUN from the undersampled k-space at acceleration ratios of R = 2, 4, and 8. Both pyruvate and lactate images were self-normalized for displaying. The estimated kPL maps and their voxelwise comparison across different R factors were listed in (e); significant correlation coefficient (p < 0.01) that stated at the top-left corner were colored in red, while insignificant correlation coefficient (p > 0.05) were colored in black. The peak SNR across all voxels was 11.3±3.6 for pyruvate, and 3.7±0.6 for lactate.

References

    1. Ardenkjaer-Larsen JH, Fridlund B, Gram A, et al. Increase in signal-to-noise ratio of > 10,000 times in liquid-state NMR. Proc Natl Acad Sci USA Sep 2 2003;100(18):10158–63. doi: 10.1073/pnas.1733835100. - DOI - PMC - PubMed
    1. Golman K, Zandt RI, Lerche M, Pehrson R, Ardenkjaer-Larsen JH. Metabolic imaging by hyperpolarized 13C magnetic resonance imaging for in vivo tumor diagnosis. Cancer Res. Nov 15 2006;66(22):10855–60. doi: 10.1158/0008-5472.CAN-06-2564. - DOI - PubMed
    1. Day SE, Kettunen MI, Gallagher FA, et al. Detecting tumor response to treatment using hyperpolarized 13C magnetic resonance imaging and spectroscopy. Nat Med. Nov 2007;13(11):1382–7. doi: 10.1038/nm1650. - DOI - PubMed
    1. Nelson SJ, Kurhanewicz J, Vigneron DB, et al. Metabolic imaging of patients with prostate cancer using hyperpolarized [1-(1)(3)C]pyruvate. Sci Transl Med. Aug 14 2013;5(198):198ra108. doi: 10.1126/scitranslmed.3006070. - DOI - PMC - PubMed
    1. Albers MJ, Bok R, Chen AP, et al. Hyperpolarized 13C lactate, pyruvate, and alanine: noninvasive biomarkers for prostate cancer detection and grading. Cancer Res. Oct 15 2008;68(20):8607–15. doi: 10.1158/0008-5472.CAN-08-0749. - DOI - PMC - PubMed

Publication types