. 2023 Jan;37(1):e22660.
doi: 10.1096/fj.202201683R.

Molecular interaction networks and drug development: Novel approach to drug target identification and drug repositioning

Affiliations

Molecular interaction networks and drug development: Novel approach to drug target identification and drug repositioning

Joseph Loscalzo. FASEB J. 2023 Jan.

Abstract

Conventional drug discovery requires identifying a protein target believed to be important for disease mechanism and screening compounds for those that beneficially alter the target's function. While this approach has been an effective one for decades, recent data suggest that its continued success is limited largely owing to the highly prevalent irreducibility of biologically complex systems that govern disease phenotype to a single primary disease driver. Network medicine, a new discipline that applies network science and systems biology to the analysis of complex biological systems and disease, offers a novel approach to overcoming these limitations of conventional drug discovery. Using the comprehensive protein-protein interaction network (interactome) as the template through which subnetworks that govern specific diseases are identified, potential disease drivers are unveiled and the effect of novel or repurposed drugs, used alone or in combination, is studied. This approach to drug discovery offers new and exciting unbiased possibilities for advancing our knowledge of disease mechanisms and precision therapeutics.

Keywords: ligand; pathway; pharmacology; therapy.


Figures

FIGURE 1
FIGURE 1
Network medicine disease module hypothesis. The protein–protein interaction network (‘interactome’) is depicted on the left within which are subnetworks for specific diseases, denoted disease modules.
FIGURE 2
FIGURE 2
Disease module construction. Disease module for cerebrovascular disease with blue nodes denoting seed (disease) proteins and gray nodes denoting connector proteins not more than one edge removed from another seed protein. [Reproduced with permission from Ref. .]
FIGURE 3
FIGURE 3
Novel drug target identification. (A) TGFβ‐dependent signaling pathway leading to perivascular fibrosis in pulmonary arterial hypertension, illustrating the role of aldosterone in promoting oxidation of NEDD9 (Ox‐NEDD9), thereby activating COL3A1 transcription and collagen III synthesis. (B) Proteins associated with adaptive fibrosis (blue), pathogenic fibrosis (red), or both (blue with red border) mapped to the consolidated interactome, defining the endophenotype module, the fibrosome. (C) Betweenness centrality (BC), a measure of importance of a particular protein (node) on information flow across a network and based on shortest path analysis, was calculated to identify NEDD9 as a critical node in the transition of endophenotype from adaptive fibrosis to pathogenic fibrosis. [Reproduced, in part, with permission from Ref. .]
FIGURE 4
FIGURE 4
Drug repurposing in myocardial infarction. The proximity relationships between myocardial infarction (MI)‐related drug targets and MI disease proteins in the interactome. (A) MI‐related drugs, drug targets, and MI disease proteins are mapped to the interactome. (B) Construction of a bipartite network of MI‐related drug targets and MI disease proteins, defining drug‐target‐disease modules. (C) Venn diagram illustrating overlap of MI‐related drug targets and MI disease proteins. (D) MI‐related drug targets and MI disease proteins have a significantly greater number of interactions (‘observed value’) than expected by chance. [Reproduced, in part, with permission from Ref. .]
FIGURE 5
FIGURE 5
Drug repurposing in vascular calcification. (A) The vascular calcification endophenotype module (‘calcificasome’), with node size correlating with degree or number of proteins to which a protein is bound, and node color indicating betweenness centrality (pink→purple, low→high). (B) Drug targets for everolimus/temsirolimus (upper) and pomalidomide (lower). (C) Human coronary artery smooth muscle cells were treated with everolimus (Ev), temsirolimus (Tem), or pomalidomide (Pom) in conditioned media (CM) for 10 days, and calcification assessed using Alizarin red staining (upper), semiquantitatively reported (lower). [Reproduced, in part, with permission from Ref. .]
FIGURE 6
FIGURE 6
Limitations of single drug target‐based therapy in cancer. A 38 year‐old man with mutant BRAF (V600E) melanoma is shown with extensive subcutaneous metastases (A) before treatment, (B) after 15 weeks of therapy with the mutant BRAF inhibitor vemurafenib, and (C) 23 weeks after treatment showing relapse, biopsy of which demonstrated a new mutation in the downstream kinase MEK1 (C121S) that sustained tumor recurrence. [Reproduced with permission from Ref. .]
FIGURE 7
FIGURE 7
Covidome. Schematic illustration of relationships among the SARS‐CoV‐2 viral proteins and their human (host) protein binding targets, which comprise a discrete subnetwork or Covid19 disease module, denoted the ‘covidome’, and the latter's interactome‐based relationship to drug targets whose drugs may be repositioned for treatment of Covid19 based on proximity calculations. [Adapted from Ref. .]
FIGURE 8
FIGURE 8
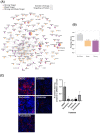
The subnetwork formed by the drug targets of strong and weak drugs based on high‐throughput screening of those drugs in a dose‐dependent SARS‐CoV‐2 infectivity assay using human VeroE6 cells. Of the 77 total drugs that had strong or weak effects out of 918 (the remainder of which had no effect), purple denotes proteins targeted by strong drugs only; orange by weak drugs only, and pie charts illustrate proteins targeted by strong and weak drugs in which the chart‐based distribution reflects the proportional number of drugs in each category. (B) Drugs with no effect have a positive proximity z‐score to the covidome, which is interpreted as their being farther from the module than expected by chance, while strong and weak drugs have negative z‐scores, which is interpreted as their being closer to the module than expected by chance. (C) Viricidal effect of lead candidates predicted from in silico interactome‐based analysis on SARS‐CoV‐2 infection in primary human intestinal epithelial cells. After 3 days of incubation with virus and drug, cells were stained with viral N‐protein with a specific antibody (red) and host cell nuclei with Hoechst 33342 (blue). Bar graph illustrates viral staining relative to dimethylsulfoxide (DMSO) control. [Reproduced with permission from Refs. , .]
FIGURE 9
FIGURE 9
Deep neural network algorithm for drug target identification, deepDTnet. In this schematic illustration of the workflow of deepDTnet, 15 types of chemical, genomic, phenotypic, and cellular networks are embedded in order for the neural net to learn a low‐dimensional vector representation of the features for each node. The resulting feature matrices X and Y for drugs and drug targets, respectively, are then subjected to Pugh (PU)‐matrix completion by deepDTnet in order to define the best projection from the drug space onto the drug target space that optimizes the geometric proximity of the projected feature vectors of drugs to the feature vectors of their drug targets. DeepDTnet then infers new targest for a drug by virtue of its ranking by geometric proximity to the projected feature vector of the drug in the projected space (for details, see Ref. 25). [Reproduced with permission from Ref. .]
FIGURE 10
FIGURE 10
Medical digital twins and drug target prioritization. (A) Peripheral blood mononuclear cells (PBMCs) from subjects with seasonal allergic rhinitis (SAR) (red) and non‐allergic controls (green) were stimulated with allergen (ragweed) or diluent control. (B) Major allergy‐related Th1/Th2 cytokines (INF‐γ, IL‐4, IL‐5, and IL‐13) were measured in the cell supernatants from SAR subjects (yellow) or non‐allergic controls (blue) over time of incubation. (C) Time‐dependent changes in single cell RNA‐seq (scRNA‐seq) of PBMCs following exposure to allergen. Multicellular network model (MNM) construction demonstrating predicted molecular interactions between cell types at each time point. Ranking of upstream regulators by the number of cell types each is predicted to regulate at each time point. Top‐ranking upstream regulator prioritization for those mediators that regulate the greatest number of cell types over the greatest number of time points, which is platelet‐derived growth factor B (PDGFB) in these experiments. Experimental validation of two upstream regulators, IL4 and PDGFB, whose gene products were blocked by specific antibodies. For details, see Ref. . [Reproduced with permission from Ref. .]
FIGURE 11
FIGURE 11
Interactome‐based drug toxicity analysis. Schematic illustration of the localization of a target for the narcolepsy drug pitolisant, potassium voltage‐gated channel, subfamily H (eag‐related) member 2 (KCNH2), in both the (nonischemic) cardiomyopathy disease module and the long QT syndrome adverse effect module.
FIGURE 12
FIGURE 12
Patient‐specific interactomes (reticulotypes) in hypertrophic cardiomypathy (HCM). (A) Left ventricular (LV) myocardial biopsy specimens were obtained from rejected cardiac explants as healthy controls (N = 5) (C1–C5) and analyzed using RNA‐Seq, after which the Pearson correlation coefficient (r) was calculated for all gene (g) pairs. n, total combinations of pairwise correlations; m, total number of genes. (B) (Anterior) septal myectomy specimens were obtained from patients with HCM undergoing septal reduction surgery and analyzed using RNA‐Seq. The transcriptomic profile of an individual HCM patient was next added to the control gene expression matrix, and a new Pearson correlation coefficient (r′) was calculated for each gene pair. The HCM patient transcriptome was then removed from the matrix and the process repeated ad seriatim for the other HCM patients (n = 18). (C) (Step 1) Statistically significant differences in r and r′ coefficients were collated, and (Step 2) those significant gene pairs (g1–g2) were mapped to the interactome (Step 3). (Step 4) Gene pairs for which an interactome‐based interaction was identified were used to generate individual‐patient HCM interactomes (reticulotypes), examples of which from 5 patients are shown in (D). [Reproduced with permission from Ref. .]

References

    1. Ehrlich P. Die Behandlung der Syphilis mit dem Ehrlichschen Präparat 606. Deutsche Med Wochenschr. 1910;41:1893‐1896.
    1. Laermann‐Nguyen U, Backfisch M. Innovation crisis in the pharmaceutical industry? A survey. SN Bus Econ. 2021;1:164.
    1. Schork NJ. Time for one‐person trials. Nature. 2015;520:609‐611. - PubMed
    1. Chartier M, Morency L‐P, Zylber MI, Najmanovich RJ. Large‐scale detection of drug off‐targets: hyopotheses for drug repurposing and understanding side‐effects. BMC Pharmacol Toxicol. 2017;18:18. - PMC - PubMed
    1. Drew KLM, Baiman H, Khwanounjoo P, Yu B, Reynisson J. Size estimation of chemical space: how big is it? J Pharm Pharmacol. 2012;64:490‐495. - PubMed

Publication types

LinkOut - more resources