

Long noncoding RNA MEG3 inhibits oral squamous cell carcinoma progression via GATA3
- PMID: 36468944
- PMCID: PMC9811608
- DOI: 10.1002/2211-5463.13532
Long noncoding RNA MEG3 inhibits oral squamous cell carcinoma progression via GATA3
Abstract
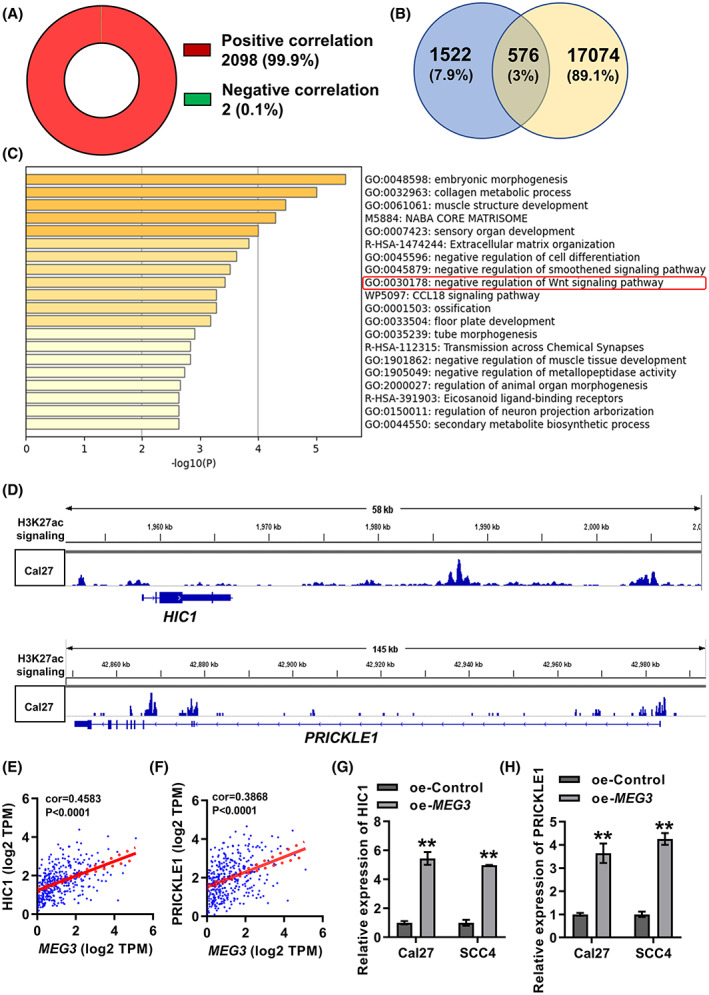
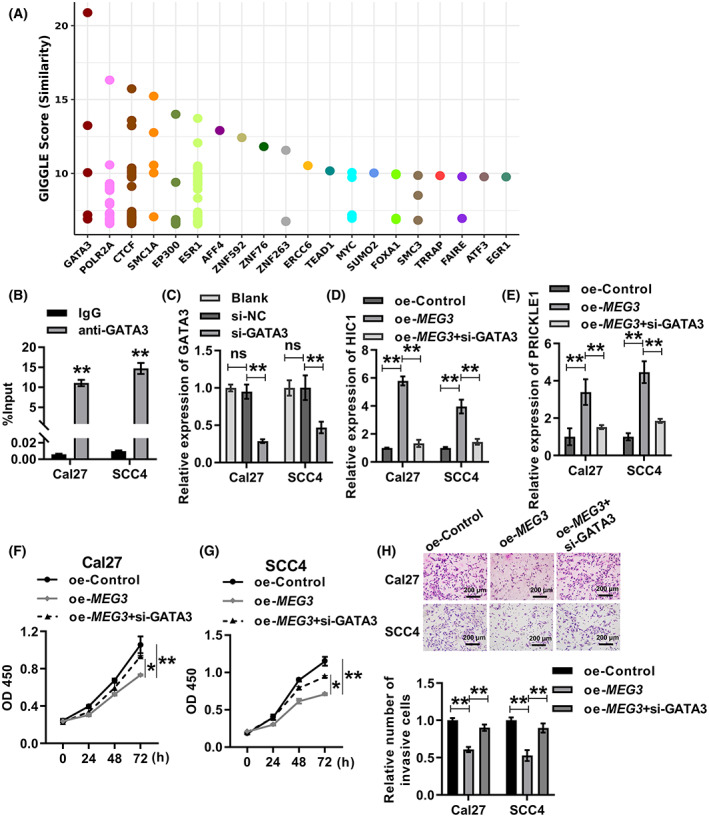
Oral squamous cell carcinoma (OSCC) accounts for about 90% of oral cancers. Expression of the long noncoding RNA (lncRNA) maternally expressed 3 (MEG3) has previously been reported to be downregulated in OSCC, and its overexpression can inhibit proliferation, migration, and invasion and promote apoptosis of OSCC cells. However, the mechanism underlying MEG3 downregulation in OSCC has not been well characterized. Here we report that low expression of MEG3 is caused by H3K27me3 modification of the MEG3 gene locus, and this is associated with the poor prognosis of OSCC. Overexpression of MEG3 inhibited the proliferation and invasion of OSCC cells. We observed that MEG3 was modified by m6A and bound to YTHDC1. Enhancer-controlled genes positively regulated by MEG3 were functionally enriched for the 'negative regulation of Wnt signaling pathway' term, as determined using metascape. GATA3 was predicted to be a transcription factor for these genes, and was demonstrated to bind to MEG3. Knockdown of GATA3 countered the effects on proliferation, invasion, and increased transcription of HIC1 and PRICKLE1 induced by MEG3 overexpression. In conclusion, our data suggest that MEG3 is downregulated in OSCC due to trimethylation of H3K27 at the MEG3 gene locus. The inhibitory effect of MEG3 on proliferation and invasion of OSCC cells was dependent on the binding of GATA3.
Keywords: MEG3; GATA3; H3K27me3; m6A; noncoding RNA; oral squamous cell carcinoma.
© 2022 The Authors. FEBS Open Bio published by John Wiley & Sons Ltd on behalf of Federation of European Biochemical Societies.
Conflict of interest statement
The authors declare no conflict of interest.
Figures


Similar articles
-
Low expression of lncRNA MEG3 promotes the progression of oral squamous cell carcinoma by targeting miR-21.Eur Rev Med Pharmacol Sci. 2018 Dec;22(23):8315-8323. doi: 10.26355/eurrev_201812_16529. Eur Rev Med Pharmacol Sci. 2018. PMID: 30556872
-
LncRNA MEG3 suppresses migration and promotes apoptosis by sponging miR-548d-3p to modulate JAK-STAT pathway in oral squamous cell carcinoma.IUBMB Life. 2019 Jul;71(7):882-890. doi: 10.1002/iub.2012. Epub 2019 Feb 26. IUBMB Life. 2019. PMID: 30809930
-
LncRNA AC007271.3 promotes cell proliferation, invasion, migration and inhibits cell apoptosis of OSCC via the Wnt/β-catenin signaling pathway.Life Sci. 2019 Dec 15;239:117087. doi: 10.1016/j.lfs.2019.117087. Epub 2019 Nov 20. Life Sci. 2019. PMID: 31759044
-
Maternally expressed gene 3 in metabolic programming.Biochim Biophys Acta Gene Regul Mech. 2020 Apr;1863(4):194396. doi: 10.1016/j.bbagrm.2019.06.007. Epub 2019 Jul 1. Biochim Biophys Acta Gene Regul Mech. 2020. PMID: 31271897 Free PMC article. Review.
-
Biogenic Analysis of the Effect of TERC on Cell Proliferation and Migration of Oral Squamous Cell Carcinoma under Digital Minimally Invasive Treatment.Biomed Res Int. 2022 Aug 18;2022:2102795. doi: 10.1155/2022/2102795. eCollection 2022. Biomed Res Int. 2022. Retraction in: Biomed Res Int. 2023 Jun 21;2023:9798465. doi: 10.1155/2023/9798465. PMID: 36033580 Free PMC article. Retracted. Review.
Cited by
-
Relationship between tumor thickness and GATA3 immunoexpression in lip and tongue squamous cell carcinomas.Oral Maxillofac Surg. 2024 Sep;28(3):1259-1266. doi: 10.1007/s10006-024-01251-0. Epub 2024 Apr 11. Oral Maxillofac Surg. 2024. PMID: 38600414
-
Competing endogenous RNAs network dysregulation in oral cancer: a multifaceted perspective on crosstalk and competition.Cancer Cell Int. 2024 Dec 26;24(1):431. doi: 10.1186/s12935-024-03580-2. Cancer Cell Int. 2024. PMID: 39725978 Free PMC article. Review.
-
Oral squamous cell carcinoma pharmacological treatment; A long non-coding RNAs (long ncRNAs) story.Int J Mol Cell Med. 2025 Jul 1;14(2):736-752. doi: 10.22088/IJMCM.BUMS.14.2.736. eCollection 2025. Int J Mol Cell Med. 2025. PMID: 40765751 Free PMC article. Review.
-
Diagnostic value of circulating lncRNAs HOTAIR, ANRIL, and MEG3 in oral squamous cell carcinoma and their correlation with clinicopathological features.J Liq Biopsy. 2025 Jul 25;9:100315. doi: 10.1016/j.jlb.2025.100315. eCollection 2025 Sep. J Liq Biopsy. 2025. PMID: 40792230 Free PMC article.
-
Expression of Long Noncoding RNAs in Fibroblasts from Mucopolysaccharidosis Patients.Genes (Basel). 2023 Jan 20;14(2):271. doi: 10.3390/genes14020271. Genes (Basel). 2023. PMID: 36833198 Free PMC article.
References
-
- Sung H, Ferlay J, Siegel RL, Laversanne M, Soerjomataram I, Jemal A, et al. Global cancer statistics 2020: GLOBOCAN estimates of incidence and mortality worldwide for 36 cancers in 185 countries. CA Cancer J Clin. 2021;71:209–49. - PubMed
-
- Khurshid Z, Zafar MS, Khan RS, Najeeb S, Slowey PD, Rehman IU. Role of salivary biomarkers in Oral cancer detection. Adv Clin Chem. 2018;86:23–70. - PubMed
Publication types
MeSH terms
Substances
LinkOut - more resources
Full Text Sources
Medical
